Clinical and functional outcomes
The objective and subjective clinical outcomes are shown in Table 2. After TKA, a steady improvement in the clinical outcomes (WOMAC, KSS, VAS score) was observed.
Effects of UCLA activity rating on average rBMD in the proximal tibia over 5 years of follow up
The baseline rBMD was measured within 1 week after TKA. The percent change in rBMD (rBMD%) was calculated by the following equation: rBMD% =100%*[rBMD (baseline)-rBMD (each time)]/ rBMD (baseline). In brief, in this study, a UCLA activity rating of 4-5, 6-7 and 8-9 was considered to describe a low, moderate and high activity level, respectively. There were no significant differences in patient age, sex, BMI or HKA angle among the various UCLA activity ratings (Table 3). The UCLA activity rating was significantly associated with the average rBMD% in the proximal tibia at 1 year (P<0.001) and 3 years (P=0.002) but not at 5 years (P=0.239). The average rBMD% in the proximal tibia decreased with UCLA activity rating until a moderate activity level and then started to increase (Fig. 2). The smallest reduction in the average rBMD was at a moderate activity level, and the rBMD increased (0.86%, 0.43%) at a moderate activity level compared with the corresponding baseline at both 1 and 3 years.
Nonlinear regression of rBMD% in the proximal tibia and UCLA activity rating
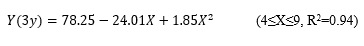
The parabola fitted by nonlinear regression was a suitable trend curve for representing the relationship of the average rBMD% in the proximal tibia with the UCLA activity rating (Fig. 3). Regression of the average BMD% against the UCLA activity rating showed the following optimal equations:
See Formulas 1 and 2 in the supplemental files.
Where Y(1y) and Y(3y) are the average rBMD% in the proximal region at 1 and 3 years, respectively, and X is the UCLA activity rating.
Influence of UCLA activity rating on rBMD in medial, lateral and distal metaphysis at 1 and 3 years
The UCLA activity rating significantly influenced the rBMD% in the medial (P<0.001, P=0.005) and lateral (P=0.02, P=0.002) metaphysis, while the influence was not significant in the distal metaphysis at either 1 or 3 years. The change trend of the rBMD% in the medial and lateral metaphysis was generally similar to that of the average rBMD% in the proximal tibia. Compared with the rBMD in the lateral metaphysis, the rBMD in the medial metaphysis showed a significantly greater reduction at both 1 year (P=0.003) and 3 years (P=0.002). A decreased rBMD in the medial metaphysis was consistently seen at each activity level, while an increased rBMD was found in the lateral metaphysis at a moderate activity level (Table 4). The differences in rBMD% between the corresponding lateral and medial regions L1, L2, M1, and M2 were significant at both 1 year (P=0.001, P=0.026) and 3 years (P<0.001, P=0.008), while the differences in rBMD% between the corresponding lateral and medial regions L3, L4, M3, and M4 were not significant at either 1 year (P=0.053, P=0.396) or 3 years (P=0.359, P=0.678). The greatest difference in rBMD% between corresponding lateral and medial regions was found between regions L1 and M1.