Plant Materials
Maize stalks were sampled from two replicates of five commercially available hybrids of dent corn (maize) seeded at five planting densities (119,000, 104,000, 89,000, 74,000, and 59,000 plants ha − 1) in two locations in Iowa. A total of 1000 plants were sampled (10 plants per each hybrid-planting density-replicate-location combination). Plants were cut just above the ear and just above the ground immediately prior to harvest and were placed on forced air dryers to reduce stalk moisture to approximately 10–15% moisture by weight. Dry and mature stalks were utilized as this state mimics the natural state of stalks in the field just prior to harvest (which is when they are most susceptible to late season stalk lodging) and enables storage of stalk samples without degradation.
Measuring Stalk Geometry
All stalks were imaged using an X-ray computed tomography (CT) scanner (NorthStar Imaging, Rogers, MN) as described in (10). The scan region of each stalk was centered on the most central node of the stalk sample. The scans allowed for accurate determination of rind thickness, cross-sectional diameter, and tissue density as described in (10).
Measuring Stalk Bending Strength
An Instron Universal Testing System (Instron 5965, Instron Corp., Norwood, MA, USA) was utilized to conduct three point bending tests of stalk samples as described in (11,18). Synchronized force and displacement data were captured by Instron software (Bluehill 3.0). The most central node of each stalk was loaded while the most basal and apical nodes of the stalk were supported. This methodology produces the same failure types and patterns observed in naturally lodged stalks (19) and is therefore one of the most accurate methods of quantifying stalk-lodging resistance (i.e., stalk bending strength) on a plant-by-plant basis. The stalks typically failed (broke) just apical of the loaded node (i.e., in the same region the CT-scan was conducted).
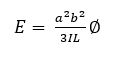
Young’s Modulus (E) of the rind tissue of each stalk was estimated using principles and approximations of engineering beam theory as described in (20). In particular, the Young’s Modulus of the rind was defined as
See Formula 1 in the Supplemental Files
where L is the distance between the left and right supports, a and b are the distances from the left and right anvils to the point of applied load, ∅ is the slope of the force-deflection curve, and I is the moment of inertia of the rind determined from the CT scans as described in (5,10). This method ignores the contribution of the pith, which has been shown to be negligible (9,20). Derivation of Eq. 1 is given in (20,21).
Rind Penetration Measurements
Rind penetration measurements were acquired using the same universal testing system described above. The universal testing system provided a constant insertion velocity and a constant insertion angle during rind penetration experiments. Stalk samples were secured to a horizontal plate and oriented such that the minor axis of the stalk cross-section was vertical. Probes were lowered at a rate of 30 mm / sec and synchronized force displacement data was recorded by the Instron software (Bluehill 3.0) at a rate of 100 Hz.
Each stalk was also submitted to a single rind penetration test in which the puncture force was applied manually (by hand). The same single researcher conducted all the manual penetration tests to eliminate any errors associated with inter-user variability. These tests were conducted to determine if the method of force actuation (machine-controlled test vs a hand actuated test) had a substantial influence on test results.
Probe Geometry
During preliminary testing, the authors investigated the use of over 15 unique rind penetration probes. Most of these were either too small (probes broke), inflicted significant damage to the stalk, or required forces greater than 200 N to puncture the stalk. These probes were eliminated, and two probe geometries were selected for further study. The first probe was 1.5 mm in diameter and tapered to a point over 5 mm (hereafter referred to as pointed probe). The second probe was 2 mm in diameter and had a 0.5 mm, 45-degree chamfer on its end (hereafter referred to as chamfered probe). Both probes were constructed of high-strength steel. The detailed geometry of each probe is displayed in Fig. 1.
Puncture Location
Rind penetration tests were conducted at numerous locations on each stalk with each probe geometry. Figure 2 displays each probe geometry / puncture location combination. Chamfered probe penetration tests were conducted in two locations on each stalk. First, the central portion of the internode located immediately apical of the node loaded during the three-point-bending test (i.e., the most central internode) was punctured. Second, the chamfered probe was utilized to puncture each stalk in the center of the most basal internode. Pointed probe penetration tests were conducted in the central portion of each internode of each stalk as well as 5 cm apical and basal of the node loaded in the three-point-bending test. In addition, the most basal node of each stalk was submitted to an additional puncture test in which the pointed probe was forced through the stalk by hand (as opposed to by the Instron universal testing system). During all tests the probe was lowered until it had punctured the rind and entered the pith tissue
Rind Penetration Metrics
The standard rind penetration protocol requires puncturing the rind of the stalk and measuring the maximum force encountered during the test. However, it is possible to compute several other metrics from rind penetration data. Figure 3 displays a typical force-displacement curve acquired from a single rind penetration experiment and highlights four alternative rind penetration computations. These alternative computations or metrics include the structural yield point, the slope of the linear portion of the curve, and the area under the curve up to the structural yield point. The structural yield point was calculated by offsetting the slope line by 2% of the deflection at the max load. The intersection between the offset average slope line and the force deflection curve was then defined as the structural yield point (see Fig. 3). For every rind penetration test except the hand operated tests, the 4 alternative metrics listed above were calculated. Alternative metrics were not calculated for the hand operated test because no displacement data was recorded during these manually actuated tests.
Summary of Rind Penetration Experiments
Table 1
displays a summary of the rind penetration experiments employed in the study including puncture locations, probe geometries, and number of rind penetration metrics recorded for each test.
| Table 1. Summary of Rind Penetration Experiments |
| Actuation Method | Probe Geometry | Locations | Metrics |
| # | Description | # per location | Description |
| Hand Actuated | Pointed | 1 | most basal internode | 1 | max load |
| Machine Actuated | Pointed | 8 | every internode and 5 cm apical and basal of most central node | 4 | max load, slope, area, yield point |
| Machine Actuated | Chamfered | 2 | most basal internode, most central internode | 4 | max load, slope, area, yield point |