Measurement of fat deposition and myofiber type traits
The intramuscular fat area and fibre number in the longissimus dorsi muscles of animals in the semi free-grazing farm (FF) group were significantly (p<0.01) bigger than that in the indoor feeding farm (DF) group (Fig. 1A). Back, abdominal and lard fat area of pigs in the FF group were significantly (p<0.01) bigger than that in the DF group (Fig. 1B). The mRNA expression of MyHC1, MyHC2b and MyHC2x in the longissimus dorsi muscles of animals in the FF group was significantly (p<0.05) higher than that in the DF group (Fig. 1D). The percentage of MyHC2x and MyHC1 in FF group was higher than that in DF group (Fig. 1C). The mRNA expression of adipocyte development genes, including FAS, ATGL and HSL, in the longissimus dorsi muscles of animals in the FF group was significantly (p<0.05) higher than that in the DF group (Fig. 1E). The mRNA expression of MyOD1 and SOSC3 in the longissimus dorsi muscles of animals in the FF group was significantly (p<0.05) lower than that in the DF group (Fig. 1E).
Taxonomic profiles in pig feces
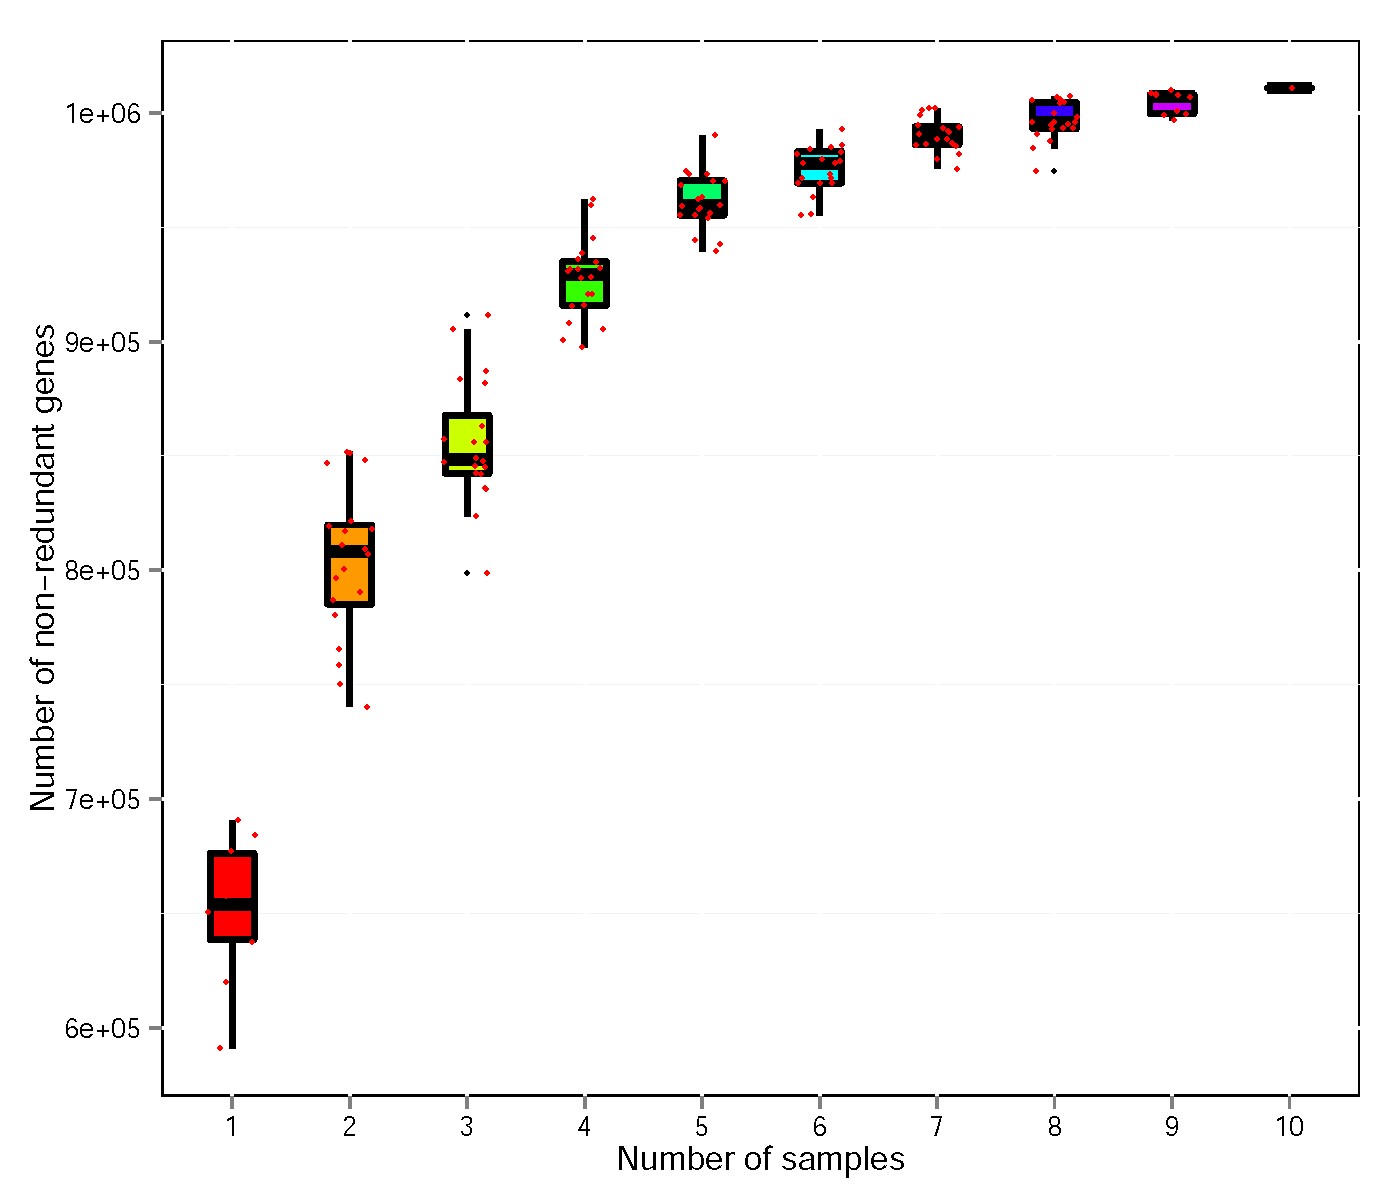
Metagenome sequencing by using HiSeq Illumina platform produced 64,035.32 Mbp of raw data from 10 faecal samples (Table S1). A total of 63,409.46 Mbp clean data were obtained after quality control. A total of 1,282,750,898 bp scaftigs were obtained, which were assembled from the single or mixed sample assembly. MetaGeneMark software predicted 1,992,770 open reading frames (ORFs). A total of 1,069,209 ORFs with 644.58 Mbp lengths, which include 348,172 complete genes, were obtained after redundanting. MicroNR database was used to blast with no-redundant gene catalogue, and 78.76%, 75.37%, 69.83%, 69.35%, 58.72%, 55.00% and 41.31% at the kingdom, phylum, class, order, family, genus, or species level, respectively, were annotated using the lowest common ancestor (LCA) method. The observed numbers of non-redundant genes curves for all samples of FF and DF groups are shown in Fig. S1.
A total of 1,646 annotated genera were found in all samples. Differences were observed at the genus level between the DF and FF groups, indicating different microbial community profiles and abundances. The most dominant genera in the DF group were Prevotella (8.59%), Clostridium (6.05%), Oscillibacter (3.74%), Lactobacillus (3.28%), Ruminococcus (3.03%), Bacteroides (2.15%), Treponema (1.84%), Streptococcus (1.44%), Alistipes (1.24%) and Methanobrevibacter (0.68%), while those in the FF group included Prevotella (8.64%), Oscillibacter (6.81%), Clostridium (4.72%), Ruminococcus (2.90%), Bacteroides (2.65%), Streptococcus (1.73%), Treponema (1.25%), Alistipes (0.60%), Lactobacillus (0.48%) and Methanobrevibacter (0.10%) (Fig. 2A).
A total of 7,016 species were annotated from the MicroNR database, accounting for an average of 9.71% or 11.40% of the total NR from the DF or FF group, respectively (Table. S2). Firmicutes bacterium CAG:110 exhibited high abundances and was dominant in sample from DF (3.30%)) and FF (2.84%). The species were followed in abundances by Lactobacillus johnsonii (1.19%), Prevotella sp. P5-92 (0.89%) and Prevotella sp. P2-180 (0.74%) in the DF group and by Ruminococcus sp. CAG:177 (1.65%), Oscillibacter sp. PC13 (1.35%) and Clostridium sp. CAG:138 (1.34%) in the FF group (Fig. S2).
Principal component analysis (PCA) and ANOSIM distances were utilised to visualise the differences in taxa composition between groups. The PCA cluster showed an obvious separation between the DF and FF group (Fig. 2B), and the ANOSIM enhanced this dissimilarity (R=0.373, p < 0.05) in the species level (Fig. 2C), wherein identical communities are given R statistic near 0, and completely distinct communities are given a value of +1. LDA indicated that the bacteria were significantly reduced in the DF group compared with those in the FF group, which was composed of s__Succinatimonas_sp_CAG_777 in species level and g__Megasphaera and g__Anaerovibrio in genus level (Fig. 4c). The bacteria were significantly increased in the DF group compared with those in the FF group, consisting of s__Mycoplasma_sp_CAG_472, s__Eubacterium_sp_CAG_841, s__Firmicutes_bacterium_CAG_176, s__Eubacterium_coprostanoligenes, s__Clostridium_sp_CAG_533, s__Oscillibacter_sp_CAG_241_62_21, s__Firmicutes_bacterium_CAG_83, s__Ruminococcus_flavefaciens, s__Lactobacillus_reuteri and s__Lactobacillus_johnsonii in the species level (Fig. 2D).
Correlation between the phenotypic data and microbial abundance
We used the canonical correlation analysis (CCA) to detect the correlation between the eight selected environmental variables and the overall microbial community (Fig. 3A). CCA analysis showed that the abdominal fat area (p<0.05), back fat area (p=0.1) and MyHC2b (p=0.1) had the greatest effect on microbial community composition, followed by myofiber density, leaf fat area, intramuscular fat area, ATGL mRNA, SOSC3 mRNA and MyOD1 mRNA. After applying CCA, all significant correlation between the selected phenotypic data and gut microbial by using the spearman rank correlation at the genus level are shown as a heat map in Fig.3B. The effect size and direction of the correlation was presented by the fold change value and colour. In total, 27 significant correlations between individual variables and gut microbial were observed in multivariate analysis, including 8 positive correlations (red square) and 19 negative (blue square) correlations.
At the genus level, a significant positive correlation was observed in the intramuscular fat area of g__Clostridium (R=0.65, p=0.04), and a significant negative correlation was observed in the intramuscular fat area of g__Streptococcus (R=−0.93, p=0.0001) (Fig. 3B). A significant positive correlation was observed in myofiber density and the abdominal fat area of g__Sphaerochaeta (R=0.72, p=0.01; R=0.64, p=0.04) and g__Succinatimonas (R=0.70, p=0.02; R=0.66, p=0.04), whereas a significant negative correlation was observed in myofiber density and abdominal fat area of g__Oribacterium (R= −0.64, p=0.05; R=−0.72, p=0.02), g__Phascolarctobacterium (R=−0.72, p=0.02; R=−0.87, p=0.001), g__Eubacterium (R=−0.70, p=0.02; R=−0.68, p=0.03) and g__Butyricicoccus (R=−0.76, p=0.01; R=−0.85, p=0.001). A significant negative correlation was observed in ATGL mRNA expression of g__Oribacterium (R= −0.77, p=0.009), g__Butyricicoccus (R=−0.68, p=0.03), g__Faecalibacterium (R=−0.67, p=0.02) and g__Butyrivibrio (R=−0.68, p=0.03) (Fig. 3B). A significant positive correlation was observed in the myofiber density of g__Parabacteroides (R=0.77, p=0.009) (Fig. 3B). A significant positive correlation in MyOD1 mRNA expression (R=0.73, p=0.01) and a significant negative correlation in leaf (R=−0.77, p=0.009) and back fat area (R=−0.83, p=0.003) were observed on g__Angelakisella (Fig. 3B). A significant positive correlation in MyOD1 mRNA (R=0.72, p=0.02) expression and a significant negative correlation in leaf (R=−0.72, p=0.02) and abdominal fat area (R=−0.68, p=0.03) were observed on g__ Eubacterium (Fig. 3B).
Functional composition of the metagenome analysis
Functional classification of annotated NR genes by using Kyoto Encyclopedia of Genes and Genomes (KEGG) revealed a predominance of pathways related to metabolism (carbohydrates, amino acid and nucleotide metabolism), genetic information processing (translation) and environmental information processing (membrane transport) as shown in Fig. S3. PCoA clustered the two feeding models (DF vs. FF) distinctly with two PCoA axes describing 89% of the total variation, wherein 81.33% of variation was in the first principal axis (Fig. 4A). Chief differences between groups were reads that were functionally annotated as being involved in carbohydrate and amino acid metabolism. Interesting, samples from the FF group were significantly enriched for pathway to alanine, aspartate and glutamate metabolism by the action of glutamate dehydrogenase (K00262, EC:1.4.1.4), glutamate synthase and NADPH large chain (K00265, EC:1.4.1.13) and 2-oxoglutarate/2-oxoacid ferredoxin oxidoreductase subunit alpha (K00174, EC:1.2.7.3, 1.2.7.11). Moreover, the samples remarkably enriched pathway to glycolysis/gluconeogenesis by the action of aldose 1-epimerase (K01785, EC:5.1.3.3) and 2,3-bisphosphoglycerate-independent phosphoglycerate mutase (K15633, EC:5.4.2.12) and remarkably enriched the module to inosine monophosphate (IMP) biosynthesis by the action of phosphoribosylformylglycinamidine synthase (K01952, EC:6.3.5.3) and amidophosphoribosyltransferase (K00764, EC:2.4.2.14) (Fig. 4B).