Ex vivo human skin organ culture
We received skin samples from healthy donors of various ages who underwent skin-resection procedures in the Division of Plastic Surgery at the Medical University of South Carolina under an approved IRB protocol. The demographic information of the donors is summarized in table 1. The ex-vivo human skin organ culture model was used as previously described (19, 24, 25). For experimentation, we used a six-well tissue culture dish (Costar, Corning, NY) with six 3-mm punches/wells placed dermal side down in serum-free, phenol-red-free DMEM (Corning, Corning, NY). In all experiments, skin punches and supernatants were harvested at the specified times and stored at -800C until further evaluation.
Cell Culture
Primary fibroblasts were isolated from human dermal tissue using the previously described outgrowth method (19). Primary dermal fibroblasts (passages 3-8) were plated in six-well culture dishes (Costar, Corning, NY) at a concentration of 2.0 x10⁵ cells/mL. Prior to stimulation, the cells were serum-starved in serum-free, phenol-red-free DMEM (Hyclone, South Logan, UT). Cells were then treated with 10 mM of a mitogen-activated protein kinase/ extracellular signal-regulated kinase (MAPK/ERK) inhibitor, U0126 (26), estrogen receptor alpha (ER α) inhibitor fulvestrant (ICI 182,780) or TGFb1 receptor inhibitor, SB-431542 (27), one hour before stimulation with E2 or ethanol (ETOH) as vehicle. U0126, SB-431542 and E2 were obtained from MilliporeSigma (St. Louis, MO), ICI 182,780 from Tocris (Minneapolis, MN), and the ETOH from Hyclone (South Logan, UT). For subcellular fractions, cells were grown in 10-cm culture dishes and maintained in complete media (DMEM supplemented with 1x antibiotic and antimycotic) from Hyclone. Once 90-95% confluent, the cells were serum-starved for at least eight hours in phenol red-free media then stimulated with ETOH or E2 for the indicated timepoints. The subcellular fractions were isolated using a subcellular protein fractionation kit for cultured cells (Thermofisher Scientific, Rockford, IL).
Measurement of steady-state mRNA levels
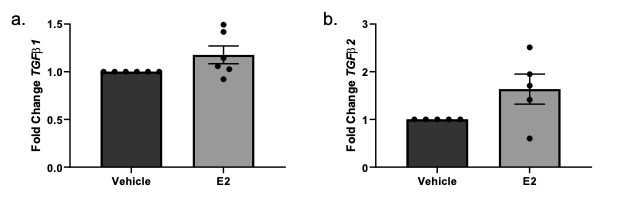
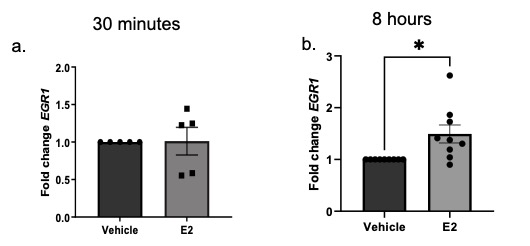
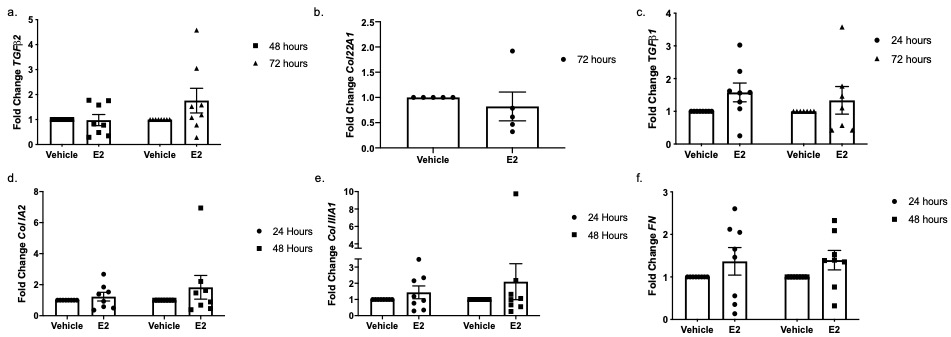
Total RNA was isolated from human skin punches through homogenization using TRIzol (Invitrogen, Carlsbad, CA), with further purification using a RNeasy isolation kit (Qiagen, Hilden, Germany). RNA from primary dermal fibroblasts was isolated with a RNeasy isolation kit. Steady-state mRNA levels were measured using quantitative PCR (qPCR) and levels are shown as fold change over vehicle following normalization of signal to B2M and GAPDH. Primers specific for FN, Col22A1, TGFβ1, TGFβ2, TGFβ3, collagen IA2 (Col IA2), collagen IIIA1 (Col IIIA1) and early growth response 1 (EGR1) were all purchased from Thermofisher Scientific (Rockford, IL).
siRNA Transfection
Primary dermal fibroblasts were plated at 1.5 x10⁵ cells/mL in six-well culture dishes. After reaching 70% confluency, the cells were transfected with siRNA targeted to EGR1 or a negative control pool (composed of four siRNAs) of non-targeting siRNA (CTL) (Horizon Discovery, Cambridge, UK) at 100 nM for 24 hours and then serum-starved in phenol red-free media for eight hours before treatment with ETOH or E2 for 24 hours.
Immunoblot Analysis
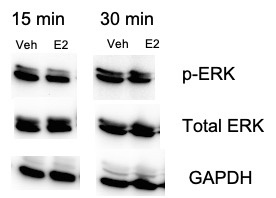
Whole-cell protein lysates or cellular fractions from dermal fibroblasts were subjected to immunoblot analysis. Equal volumes (20 mL/lane) were resolved on 10% SDS PAGE gel and transferred to a nitrocellulose membrane (GE Healthcare Life Sciences, Pittsburgh, PA). Following blocking with 5% non-fat dry milk, membranes were incubated with antibodies against phosphorylated ERK (Rabbit polyclonal, catalog # 9101, 1:1000 dilution, Cell Signaling Technology, Danvers, MA), total ERK (Rabbit monoclonal, catalog # 4695 S, 1:1000 dilution, Cell Signaling Technology, Danvers, MA), TGFβ1, (Rabbit monoclonal, clone EPR18163, 1:1000 dilution, Abcam, Cambridge, UK), EGR1 (Rabbit monoclonal, clone 15F7, 1:1000 dilution, Cell Signaling Technology, Danvers, MA), or GAPDH (Mouse monoclonal, catalog # sc-47724, dilution 1:5000, Santa Cruz, Santa Cruz, CA), followed by horseradish peroxidase–conjugated secondary antibodies. After being washed, immunoblots were developed with chemiluminescence reagents according to the manufacturer’s protocol (Pierce, Rockford, IL). Total MAP kinases were examined in the same immunoblots as their phosphorylated forms. Signal intensities of the phosphorylated MAP kinase bands were quantitated by densitometry, and the results, which were normalized against the intensities of the corresponding total MAP kinase bands in each sample, were expressed as the magnitude of increase compared with controls. Densitometry was calculated using Image J.
Statistical Analysis
All data were tested for normal distribution using the Shapiro-Wilk normality test. If the data were normally distributed, a one-way ANOVA with Sidak's multiple comparisons post-hoc test or paired, two-sample T-test were used to determine statistical significance. For non-normally distributed data, non-parametric one-way ANOVA using Dunn's multiple comparisons post-hoc test or Wilcoxon matched-pairs signed rank tests were used to determine statistical significance, which was defined as a p-value 0.05 using GraphPad.