Phylogeny and Time Divergence estimation
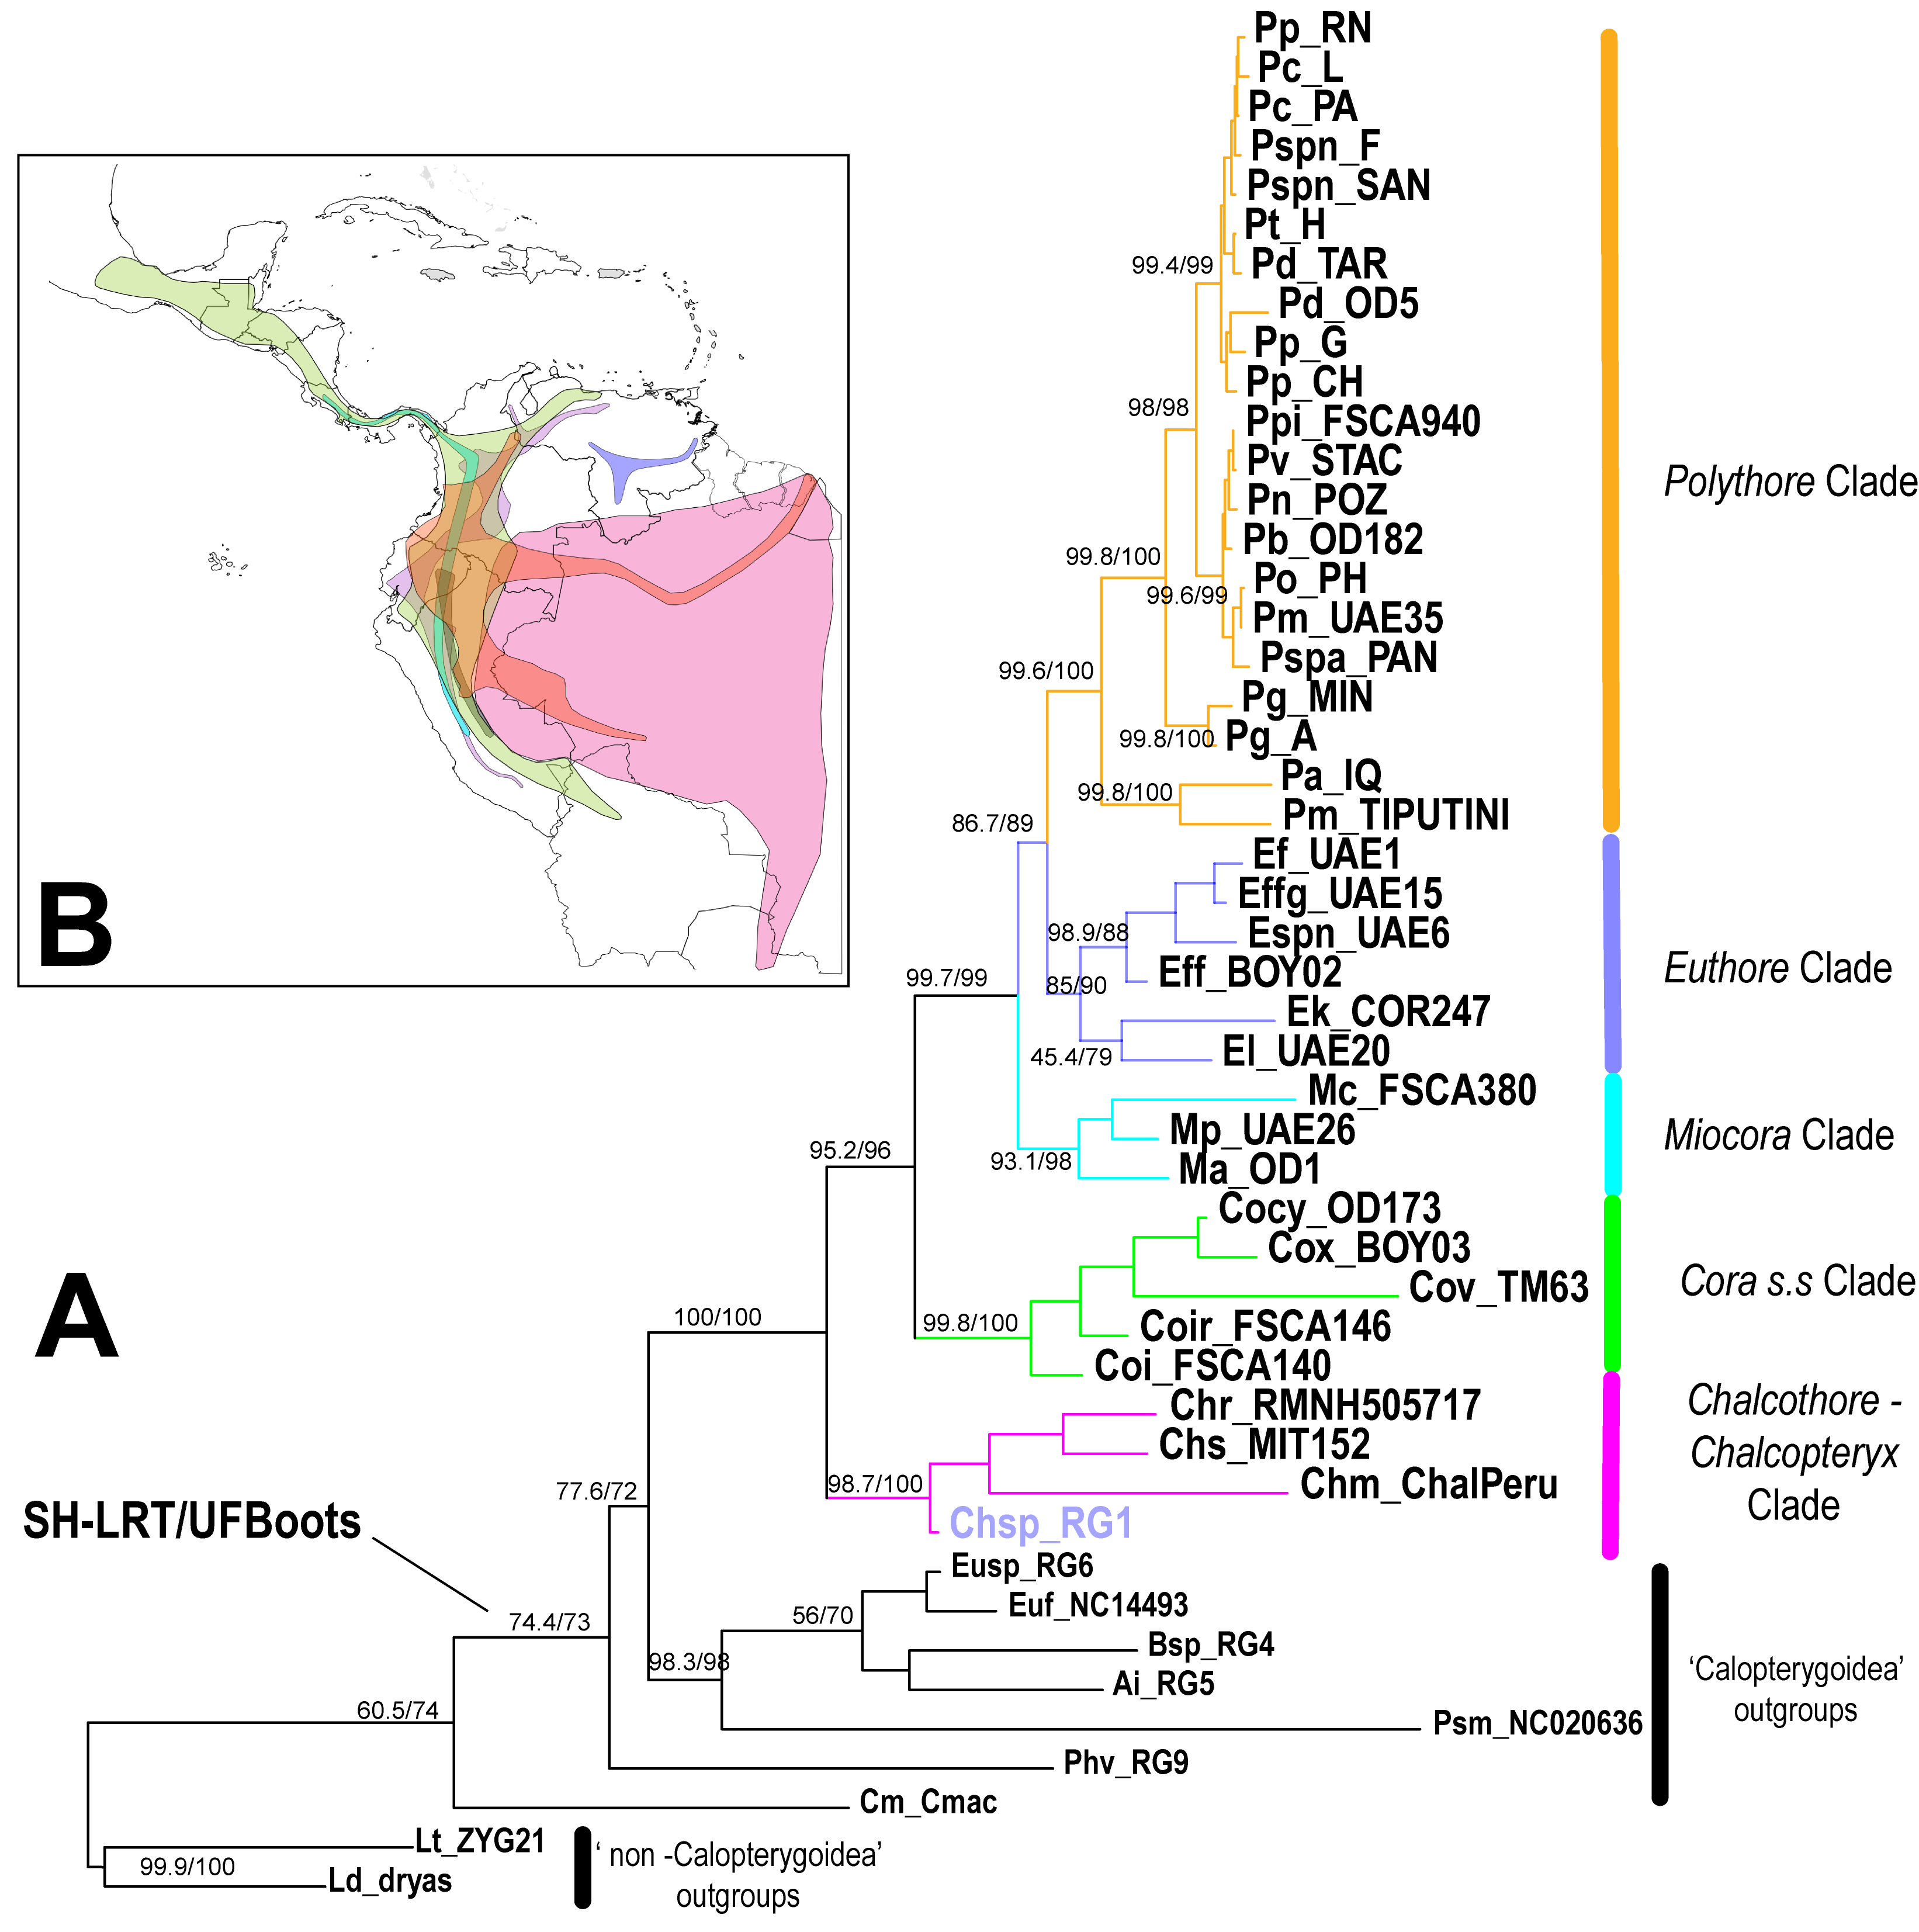
Our IQTree ML phylogenetic reconstruction, as well as our BEAST time calibrated tree, were completely concordant with the clades previously recovered by Sánchez Herrera et al. [13](Fig 1, Fig S1), though our current dataset includes twelve additional species. The family Polythoridae separated from our Outgroups ~46 Ma (49 - 42 Ma 95% HPD [High Probability Density intervals], pp [posterior probability] = 0.9125). Our time divergence reconstruction suggests that the MRCA (Most Recent Common Ancestor) of the family Polythoridae diverged ~ 33 Ma (37 – 29 Ma 95% HPD, pp = 1) during the late Oligocene and early Miocene boundary. The Chalcopteryx –Chalcothore crown clade itself began to diversify later during the early Miocene ~17.13 Ma (24.17- 9.6 Ma 95% HPD, pp = 1), while the crown group of all of the other Polythoridae genera (Cora s.s., Miocora, Euthore and Polythore clades) began to diversify ~27 Ma (23.10 – 31.20 Ma 95% HPD, pp = 1) during the late Oligocene. Chalcothore separated from Chalcopteryx ~17.13 Ma (24.17 – 9.6 Ma 95% HPD, pp = 1) around the mid Miocene, however the crown group of Chalcopteryx only diversified during the late Miocene ~ 10.5 Ma (13.8 – 6.24 Ma 95% HPD, pp = 0.8). The MRCA of the Cora s.s clade separates from all the other taxa ~27 Ma, however its crown group of Cora s.s. appears ~15.8 Ma (19.8 – 12.13 Ma 95% HPD, pp = 1) around the end of the early Miocene (Fig 1). The crown group of the Miocora clade appears ~ 10.2 Ma (13.9 – 6.62 Ma 95% HPD, pp = 1), a few million years after Cora s.s during the mid-Miocene, although the MRCA of Miocora (separate from the Euthore and Polythore clade) appears ~ 17.7 Ma (20.7 – 14.8 Ma 95% HPD, pp = 1) during the early Miocene epochs (Fig 1). The two sister clades of Euthore and Polythore diverged from each other around the same epoch as Miocora, ~16.9 Ma (19.4 – 13.8 Ma 95% HPD, pp = 0.65), but both form crown groups concurrently around the mid Miocene, though Euthore estimates are slightly older than those for Polythore (Fig 1). Euthore crown group diversified ~13.2 Ma (15.8 - 10.6 Ma 95% HPD, pp = 1) while Polythore seems to be ~12.1 Ma (14.8 – 9.55 Ma 95% HPD, pp = 1). Within the Euthore clade we recovered two sister clades: Euthore sensu stricto (e.i. E. fasciata fasciata, E. fasciata fastigiata,, E. fassli, E. sp. nov), and what used to be part of Cora (i.e. E. lugubris and E. klenei). Within the Euthore clade the divergence times recovered suggest that Euthore sensu stricto, ~8.9 Ma (11.3 – 6.6 Ma, 95% HPD; pp = 0.8), is younger that the previous classified Cora species within this clade, ~11.13 Ma (13.45 - 6.6 Ma, 95% HPD; pp = 0.7).
In the highly speciose Polythore clade we recovered the divergence times for all the previous geographical clades reported in Sanchez Herrera et al[13] (Fig 1, Fig S1). The crown group of the Amazonian clade appeared ~7.03 Ma (7.33 – 3.04 Ma 95% HPD, pp = 1), while the Andean clade was ~6.5 Ma (6.67 – 2.89 Ma 95% HPD, pp = 1). Within the Andean clade, the crown groups of the West and East Andean clades appeared ~ 1.56 Ma (6.55 - 3.42 Ma 95% HPD, pp = 1) and ~4.1 Ma (7.93 – 3.5 Ma 95% HPD, pp = 1), respectively. Moreover, estimates for the North (~2.28 Ma, 2.8 – 0.99 Ma 95% HPD, pp = 1) and South Eastern (~1.96 Ma, 3.17 - 1.19 Ma 95% HPD, pp = 1) crown groups suggest they appeared around the Pliocene - Pleistocene epochs (Fig 1).
Biogeographical Reconstruction
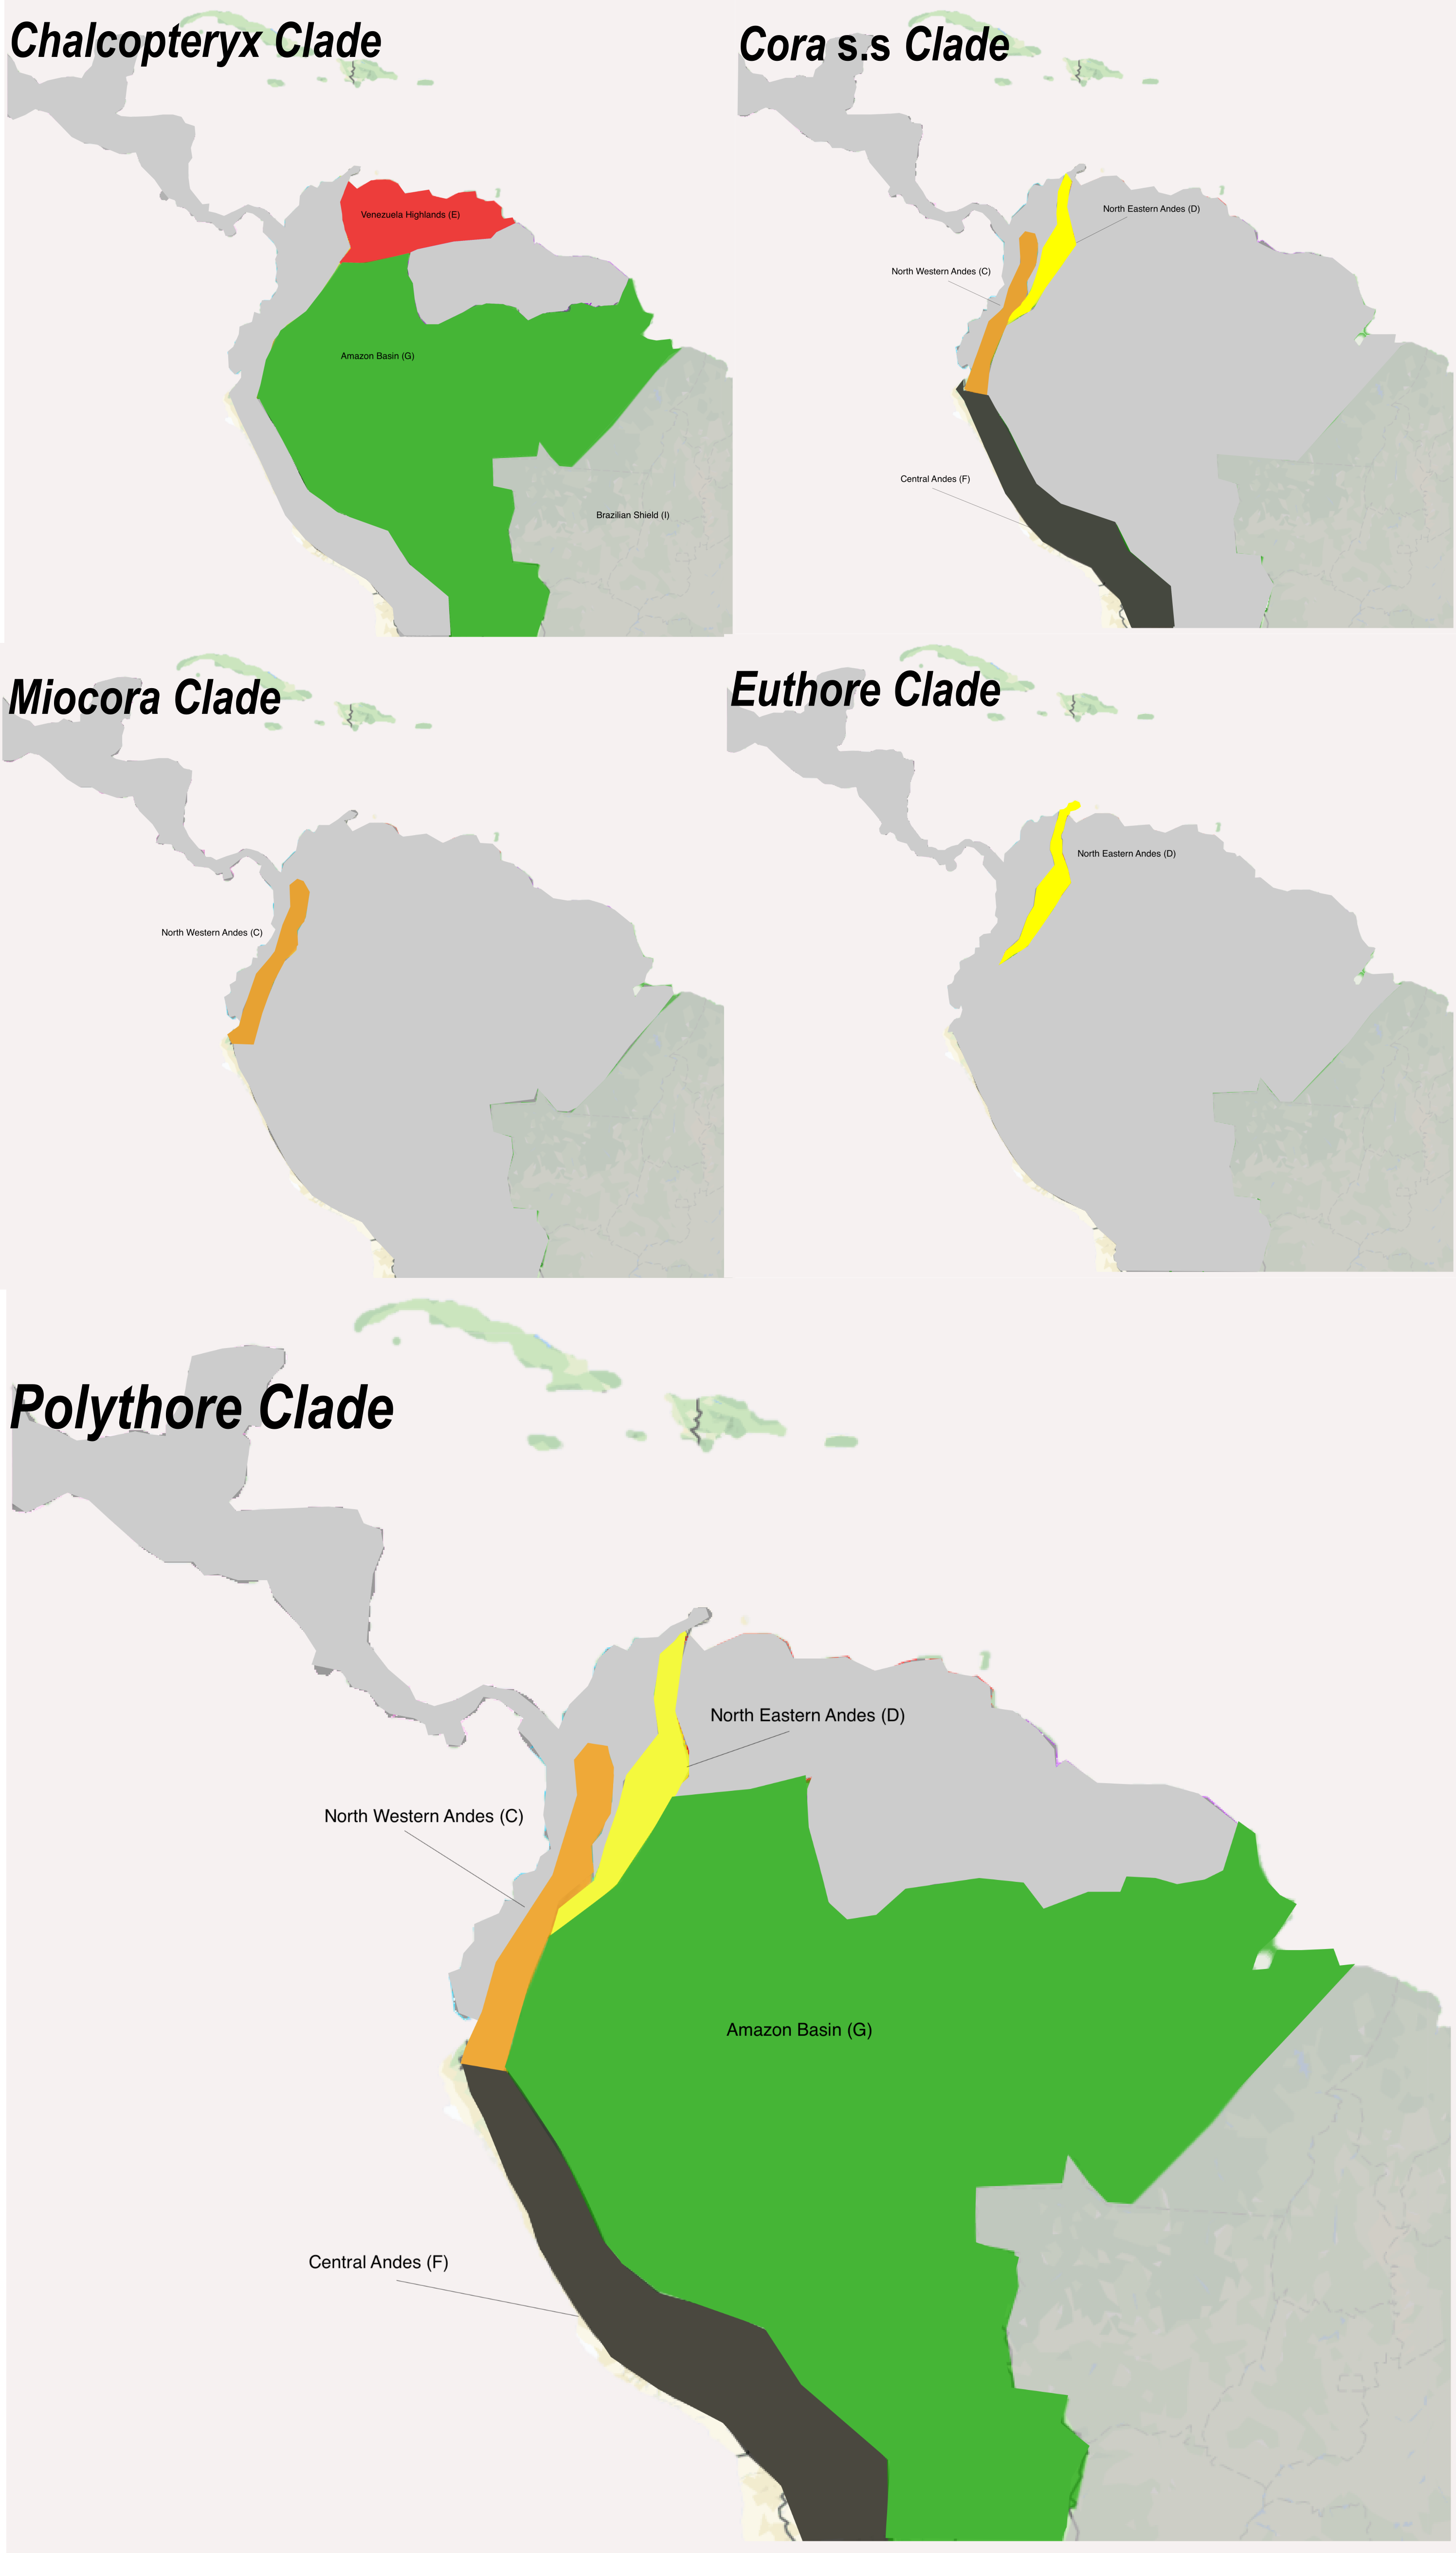
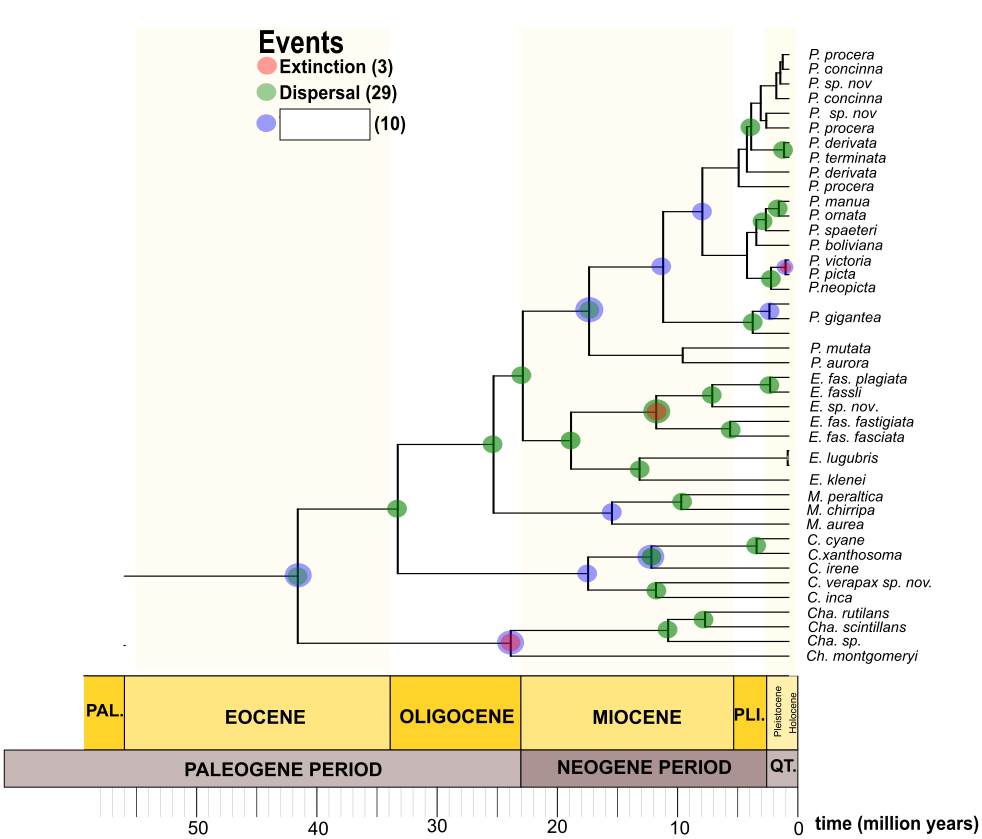
We designed and tested five different scenarios—Control (S0), Pebas & Acre Systems (P&AS, S1), ANDES Old uplift (ANDES O, S2), ANDES young uplift (Andes Y, S3), Pebas & Old Andes (P&OA, S4) and Pebas & Young Andes (P&YA, S5)—to reconstruct the Ancestral Areas through multiple biogeographical models (e.g. DIVA, DEC or BayAreaLike) for the Polythoridae. The designated areas include; (A) Central America, (B) Tumbes-Choco-Magdalena, (C) North Western Andes, (D) North Eastern Andes, (E) Venezuela Highlands, (F) Central Andes, (G) Amazon Basin, (H) Guiana Shield, and (I) Brazilian Shield. For the control scenario, we tested if the phylogenetic relationships (i.e. cladogram) alone will recover the Ancestral Areas without imposing any restrictions (e.g. dispersal and adjacency) of the geological events including the Andes uplift and Marine incursions of South America (see details in Fig 2). We selected the best biogeographical models for all scenarios (S0, S1, S2, etc.) using the AICc criteria from BioGeoBEARS. The lowest AICc value for all the scenarios tested was DEC or DEC + J (Table S2). However, following the Ree and Sanmartín [15] critique of the DEC+J model, we reconstructed the DEC and next best fitted biogeographic model based on the AICc for each scenario (Table 2) . For all the scenarios (S0 – S5) we reconstructed the ancestral areas using the best model selected—DEC and S-DEC—using BioGeoBEARS and RASP software, respectively. However, for the second best model for both the Control (S0) and the P&AS model (S1), we reconstructed the areas using the DIVALIKE and S-DIVA models, while for all the other scenarios (S2, S3, S4 and S5), the BayAreaLike model was reconstructed in BioGeoBEARS. The lowest AICc values across all the scenarios were for the control S0, which was followed very closely by the P&AS (S1) (Table 1). The next lowest AICc values were the P&YA (S5) and the Young ANDES (S3), while the others (S2 and S4) seem not to fit the diversification model. However, there were no major differences in the reconstructed ancestral areas (Table S2) when comparing among all five models in both BioGeoBEARS and RASP. To simplify, here we will describe the most likely ancestral areas estimated for the four scenarios with the lowest AICc values (Fig 3). All reconstructions became problematic at the deeper nodes, so the likelihood values supporting the areas are lower than 70% in nodes 39, 42 and 47 (Fig 3), suggesting uncertainty in the ancestral areas for the MRCA for the family Polythoridae (node 39), for the clade that includes Cora s.s, Miocora, Euthore and Polythore (node 42), and also for the MRCA of the Miocora, Euthore and Polythore clades (node 47). For the MRCA (node 48) of Euthore and Polythore, the Northwest Andes (C) is the most commonly predicted ancestral area for all scenarios (Fig 3). The MRCA (node 49) for the crown group of Euthore is consistently found in the Northwest Andes (C) in all scenarios (Fig 3). The MRCA (node 43) for the crown group of Cora s.s. has an ancestral area in the Northwest Andes (C), with the exception of S3, where in addition the Central Andes (F) and Venezuelan highlands (E) are supported (Fig 3). The MRCA (node 74) for the Miocora crown group is found in the Tumbes-Chocó-Magdalena Valley (B) and the Northwest Andes (C). The youngest MRCA (node 40) of the Chalcopteryx-Chalcothore crown group showed as more plausible areas the Amazon Basin (G), and the Venezuelan Highlands (E); S1 also supports the Brazilian Shield (I) (Fig. 3). Finally, the MRCA (node 54) of the Polythore crown group is the only group that shows different ancestral areas depending on the scenarios: for S0 the Northwest Andes (C) and the Amazon Basin (G), for S1 the Northwest Andes (C), the Amazon Basin (G) and the Central Andes (F), for S3 only the Amazon Basin (G), and for S5 the Central Andes (F) and the Amazon basin (G) (Fig 3, Table S2). It is interesting to note that the different scenarios (S0-S5) within our BioGeoBEARS and RASP analyses did not produce fundamentally different ancestral areas; inclusion of the formation of the Pebas and Acre wetlands systems, as well as mountain building events, did not alter our results in comparison with a simple control scenario that allowed free dispersal between adjoining regions at different periods of geological time (Fig. 2). Our best selected S-DEC model implemented in RASP for the Pebas and Acre Systems (S1) scenario suggests several dispersal (27), and vicariance (9) events within the different genera of Polythoridae (Figure S3); many of these involve movement within and between the different ranges of the Andes, as well as movement into the Amazon, Guiana Shield, Venezuela Highlands, the Tumbes-Chocó-Magdalena Valley, and Central America.
Diversification Analyses
To investigate the patterns of diversification and extinction rate variation through time and across lineages, we chose RevBayes[16, 17] to test the best diversification models and rate shifts, due to the high uncertainty associated with phylogenetic tree estimation. The Episodic Birth-Death with multiple time periods was the best model explaining the diversification pattern in this group of damselflies (Table S4). The estimated net diversification (λ-μ) and speciation (λ) rates show an increase, however the relative extinction (λ/μ) and extinction (μ) rates pattern seem to behave constantly through time (see Figure S5). The Branch specific model detected a shift in diversification (λ-μ) rate corresponding to the Andean Clade in Polythore with the highest shift in the Eastern Clade (Fig 4). When we observed the relative extinction (λ/μ) rate across the tree, we observed that this rate also decreases for this clade (Fig 4). Our estimates show that the other clades within this family have a more constant diversification (λ-μ) and relative extinction (λ/μ) rates across the branches of the estimated tree.