Spatial detection of smFISH and protein at the single-cell level in whole-mount zebrafish embryos
To determine the relationship between input for secretion to the distributions of BMP signaling and BMP signaling activity, we used the RNAScope method to simultaneously detect multiple individual mRNAs at the cellular level in whole-mount embryos. bmp2b mRNA began to be expressed at the zygotic stage, showing an obvious gradient pattern of higher expression levels in the ventral region, whereas chd mRNA was expressed in the dorsal region at 5.7 hpf (Fig. 1A-C). bmp2b mRNA was detected at 2.5 hpf, with no bmp2b mRNA probe binding or background present, as a negative control (Fig. S1H-I). For the positive control, we injected venus-bmp2b fusion mRNA into zebrafish embryos at the one-cell stage, followed by bmp2b and venus mRNA staining at 3 hpf, when few endogenous bmp2b mRNAs were expressed. Based on observations, bmp2b mRNA colocalized well with Venus mRNA (Fig. S1 A-F). szl, as the target of BMP signaling, was also expressed in the ventral region (Fig. 1F-H). Nascent mRNA was observed exclusively in the nucleus and typically appeared as two or four large spots reflecting transcription activity, whereas mature mRNA appeared both inside and outside of the nucleus with smaller sizes, as shown in the diagram of Fig. 1J. We observed mature and nascent mRNA in whole-mount zebrafish embryos for the first time (Fig. 1D, E, I). chd nascent mRNA was easy to discern (Fig. 1E) compared with bmp2b and szl mRNA, the active loci of which were challenging to recognize, suggesting that nascent mRNAs are more evident during higher transcriptional activity. Furthermore, we used tld mRNA as a positive control to detect nascent mRNA. tld nascent mRNA was apparent in the EVL layer. When injected with α-amanitin, an inhibitor of RNA polymerase II and III, embryos only showed few mature tld mRNAs (Fig. S2E-F) compared to embryos injected with DMSO at 4.5 hpf (Fig. S2C-D). However, it was difficult to recognize the nascent mRNA of bmp2b by 2D imaging (Fig. S3A-B), prompting us to analyze bmp2b mRNA at the 3D level. Images were acquired using an upright confocal microscope with a 20x high NA (1.0) objective, which shows similar resolution to images taken on widefield microscopes (Fig. S1J, K).
Transcriptional responses to BMP signaling are mediated through pSmad. Comparison of BMP ligand levels with pSmad levels provides insight into positional information in this pathway. Comparison of pSmad levels with BMP target gene levels provides a measurement of transcriptional efficiency. Here, we demonstrated that we could detect pSmad and bmp2b (Fig. 1K, K’) or szl (Fig. 1L, L') mRNA in identical embryos without sacrificing the intensity of each. Cell membrane staining is critical for single-cell level detection of mRNA and protein because of its importance for image segmentation. Unfortunately, the RNA scope protocol complicates this, as F-actin structures of cell membranes are broken up during preparation. Remarkably, we found that injecting membrane-labeling dye into zebrafish embryos at the one-cell stage circumvented this issue and provided membrane staining (Fig. 1M). Overall, we demonstrate the viability of staining single molecular mRNA and protein and cell membranes at the single-cell level; this method will enable the investigation of positional information and study the relationship between transcription factors and target genes and noise at the cellular or embryonic level.
Absolute quantification of nascent and mature mRNA transcripts in whole-mount zebrafish embryos
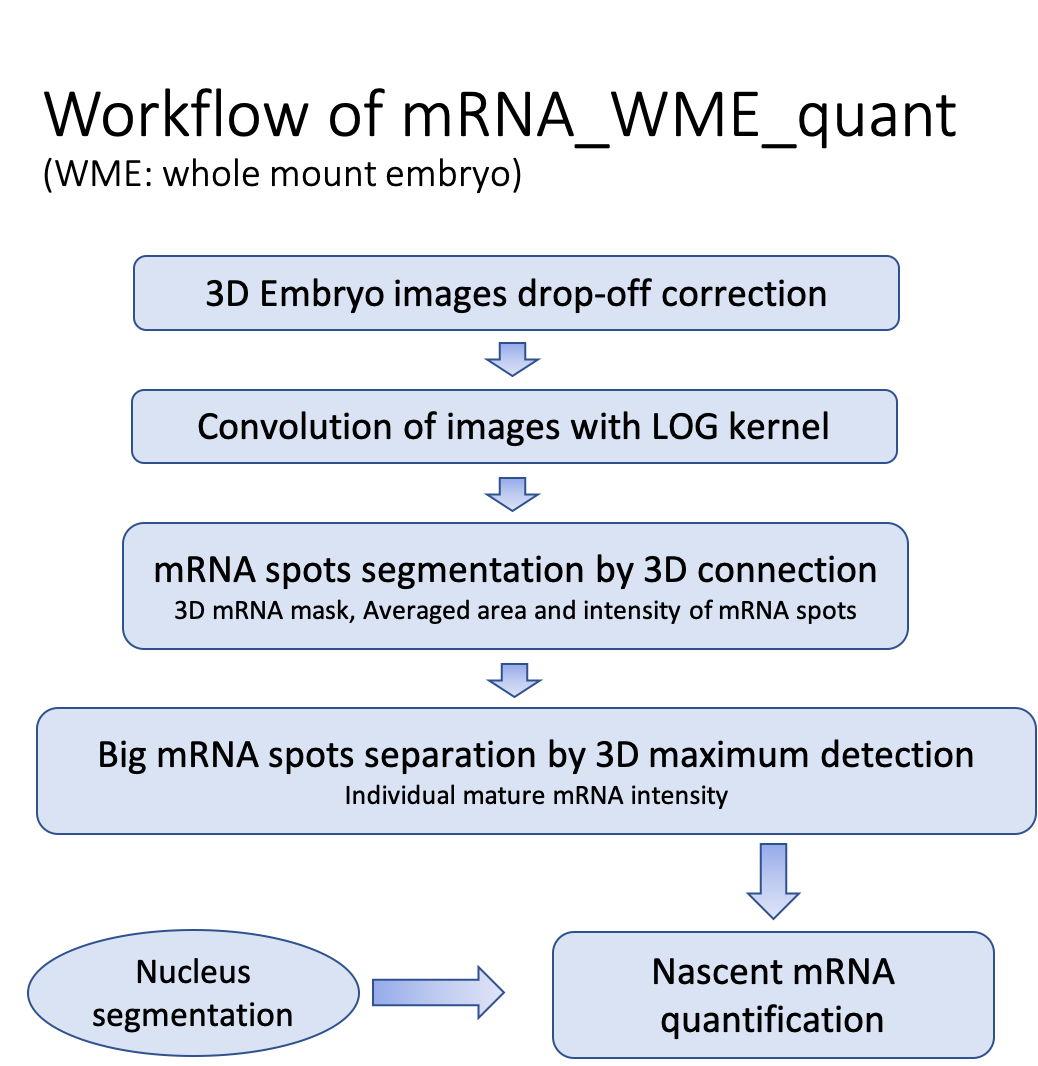
Previously, mRNA quantification in zebrafish embryos was performed by observing the mRNA quantity on 2D segmentation on cryosections (Carine Stapel et al. 2016). This approach loses the overall shape of individual mRNAs of relatively large size. Some large spots, such as nascent mRNA and mature mRNA, can appear on different slices of whole embryos during imaging, influencing each spot's total intensity and volume matrix pixels. We developed 3D mRNA segmentation methods in whole-mount embryos following the flow chart shown in Table 2, during which intensity drop-off correction is a prerequisite (Fig. S3 A-D). Transcription is mainly maintained in the interphase. Up to 4 transcriptional loci can appear in the nucleus during DNA replication (Fig. 4F). This is consistent with similar findings in the mRNA segmentation of Drosophila embryos(Little, Tikhonov, and Gregor 2013) but was not observed in the 2D mRNA segmentation of zebrafish(Carine Stapel et al. 2016). To determine the individual mRNA candidates, we compared the bmp2b mRNA counts in entire embryos at 5.7 hpf by image quantification to those from digital PCR (table 1). Representative transcriptional loci are shown in Fig. 2A, B, with two large nascent mRNA spots inside of the nucleus. In digital PCR, the bmp2b mRNA probe targeted the middle of the bmp2b coding sequence. mRNA intensity is higher in mRNA strings transcribed by more than half and vice versa, so, on average, the intensity of an individual nascent mRNA can be estimated as half of the averaged intensity of mature mRNA to match the digital PCR results. Regardless of size and intensity, mature mRNAs were counted as one individual mRNA except for connected mature mRNAs, separated by local maximum (Fig. 2C). The only variable, the intensity threshold, can be determined by fitting a curve from individual mRNA numbers by different thresholds (Fig. 2D), coupled with a digital PCR number (table 1, n=273778). We found that the ratio of the maximum to the averaged value, including the volume matrix pixels (40/20) and intensity (10/5) of individual mRNAs, was approximately 2 (Fig. S3 G, H), which was also found in previous work(Raj et al. 2008). Many individual mRNAs with a smaller area and lower intensity were also considered the actual single mRNA molecule shown in the peak of Fig. S3 G, H. Combining mRNA segmentation and digital PCR in whole embryos, the background signal was authentically removed from smFISH images. Nascent and mature mRNA was divided based on location, size, and intensity.
Determining critical factors in quantifying mRNA distribution across whole embryos
To detect the relationship between mRNA number and intensity at different positions on whole embryos, we established a whole sphere mesh to represent the zebrafish embryos at the blastula stage and mapped the mRNA spots to the corresponding mesh. Interestingly, the total mRNA number and intensity were linear with each other at each mesh (Fig. 2E). The bmp2b mRNA 3D distributions across whole embryos were also similar between different mRNA numbers (Fig. 2G) and mRNA intensities (Fig. 2H) in each mesh, being more highly expressed in the ventral animal and marginal regions. Embryos were rotated into standard alignment using chd mRNA expression (Fig. 2I) as a marker of the dorsal region. Notably, the mRNA number in each mesh was sensitive to the intensity threshold in mRNA segmentation (Fig. 2F). All of these results suggest that the most accurate and efficient way to visualize the smFISH distribution is to first determine the intensity threshold by combining 3D mRNA segmentation and digital PCR and then apply this threshold to 2D mRNA segmentation of more samples, which is approximately five times faster than 3D mRNA segmentation. Using the intensity from 2D mRNA segmentation, we effectively quantified averaged bmp2b (Fig. S3 E, F) and szl mRNA (Fig. 3E) distributions in more embryos. bmp2b mRNA production evolved from occurring highly in the ventral animal region at 4.7 hpf (Fig. S3 E) to occurring highly in both the ventral animal and ventral marginal regions at 5.7 hpf (Fig. S3 F), suggesting that bmp2b starts to play a vital role in the margin between 4.7 hpf and 5.7 hpf.
Szl maintains the inhibition level in the marginal layer by BMP and Nodal signaling.
Higher-precision methods will give us a better resolution to detect the mRNA spatial distribution appropriate for mathematical modeling input. We found that bmp2b showed a gradient from ventral to dorsal in the ventral marginal and animal regions (Fig. 3D, Fig. S3 E). chd, as the target of Nodal signaling(Bradham et al. 2010), was expressed in the margin at 5.7 hpf (Fig. 3F) and disappeared in the margin at 8 hpf (Fig. S4 C,C’), which is consistent with Nodal expression from the blastula to gastrula stage(Rogers et al. 2017). Interestingly, szl, as the target of BMP signaling, was only expressed on the animal excluded from the ventral margin (Fig. 3E) and not colocalized with pSmad in the margin when simultaneously detecting szl and pSmad in whole-mount embryos at 5.7 hpf (Fig. S4 B, B’). Remarkably, szl recovered the expression in the margin at the gastrula stage (Fig. S4 C, C’). This finding is consistent with another BMP target gene, foxi1, induced by high levels of BMP and low Nodal levels (Soh, Pomreinke, and Müller 2020). We postulated that szl might be inhibited by Nodal, which is only expressed in the marginal layer at 5.7 hpf. To test this hypothesis, we utilized a Nodal inhibitor (SB-505124) and a BMP signaling inhibitor (LDN193189) to evaluate the role of Nodal and BMP signals on szl expression. Importantly, we found that application of the nodal inhibitor led to resumed expression of szl at the ventral margin (Fig. 3A, A’, B, B’), and szl was entirely blocked by the BMP inhibitor (Fig. 3C, C’). These results suggest that BMP and Nodal cooperatively shape the expression of szl.
Previous work shows that BMP and Nodal signaling can selectively inhibit each other to specify the cell type(Soh, Pomreinke, and Müller 2020). Our data implied that this mutual inhibition might play an essential role in BMP morphogen maintenance. To determine the impact of different szl expression on a three-dimensional level, we modified our previously built three-dimensional growing domain model, which includes the growth of epiboly and 3D patterning(Li et al. 2020); the mathematical equations for this model are shown in Table 4. We adopted 182 sets of parameters screened from our 10 million 1D simulations(Tuazon et al. 2020) and applied different expression regions of szl as simulation input, with margin (Fig. 3G) or excluded from the margin (Fig. 3H). We calculated the NRMSD of modeling output data and experimental pSmad data, representing the fitting error, on the margin with two different szl expression inputs. Strikingly, some of the NRMSD could be significantly reduced by removing szl expression in the margin (Fig. 3I) and were closely related to the ratio of the szl production rate to ki, representing the strength of Szl protein suppression (Fig. 3J). These results suggest that szl and chd change the expression region in the margin where dorsal-ventral patterning is determined to maintain the inhibition level of BMP morphogen.
BMP morphogen intrinsic noise implies the cell state
Understanding the stochastic nature of the signaling response between different cells is a fundamental challenge in biology. Intrinsic noise mainly comes from elements involved in transcription rates and can be evaluated by two-factor assays (Elowitz et al. 2002) or the sizes of transcribing loci (Stapel, Zechner, and Vastenhouw 2017)(Little, Tikhonov, and Gregor 2013). Extrinsic noise originates from the differences among cells, such as cell cycle stage or differential abundance of transcription factors (Zopf et al., 2013). We can detect intrinsic noise through the volume pixels and intensity of nascent mRNA by 3D mRNA segmentation. We observed nascent mRNA in 49% of all nuclei ranging from 1 to 4 loci (Fig. 4F), implying that approximately half of the cells are in interphase. Strikingly, we observed four nascent mRNAs in the form of 2 pairs of sister chromatids, indicating DNA undergoing replication. Of the observed nuclei, 20% had only one nascent mRNA (Fig. 4E, F), suggesting that the transcriptional activity is independent between two chromosomes. This could also happen when more than one nascent mRNA colocalizes with each other. To assess the instantaneous transcriptional activity of the BMP morphogen, we evaluated the variation among the total intensity of each nascent mRNA in the nuclei. Importantly, we found that the intrinsic noise was much higher in the marginal region for nuclei with both (Fig. 4A, B) and four nascent mRNAs (Fig. 4C, D). In a whole-mount embryo, the nascent mRNA expression region was similar to the bmp2b mRNA in a whole-mount embryo (Fig. 3D), and only the marginal region was highly noisy, which is clearly shown in the amplified figures (Fig. 4B, 4D). Representative nascent mRNAs with higher noise levels are shown in Figure 4E and were compared with those with lower noise levels (Fig. 2B). Zebrafish embryos start to establish DV patterning in the margin at 5.7 hpf, where and when a consistent noisy pattern is observed for intrinsic BMP morphogen noise, noise can represent the state of the cell across whole embryos.