3.1 Synthesis of Sn(II) substituted ZnO nanoparticles using the sol-gel method: The commercially available zinc nitrate hexahydrate, tin(II) chloride dihydrate, diethylamine, sodium hydroxide, and ethanolamine were purchased from Loba Chem Pvt Ltd, India. Sn(II) substituted ZnO nanoparticles were synthesized from a sol-gel method [30, 31]. Initially, Zn(NO3)2.6H2O and SnCl2.2H2O (1 mol% with respect to Zn2+) were dissolved in 50 ml of distilled water, the mixture was kept under constant magnetic stirring for 15 minutes at room temperature. Then, diethylamine (30 ml) was added dropwise using a burette. Mean the time (NH4HCO3) (2M) was also added dropwise for mainiting pH at 11. After that, the solution was kept under constant magnetic stirring for 5 hours at room temperature. A milky white precipitate was observed. Then, the obtained residue (SZO) was filtered and cleaned many times with deionized water. The final product was kept in an oven at 80°C for 24 hours to dry the product and remove moisture. Finally, the product of ZnO substituted ZnO was heated in a static air furnace at 500°C for 1 h. Sn(II) substituted ZnO in different Sn(II) molar ratios of 0.5%,1.0% and 2.0% were prepared using the same procedure and the yield of Sn(II) doped ZnO NPs summarised in Figure 1.
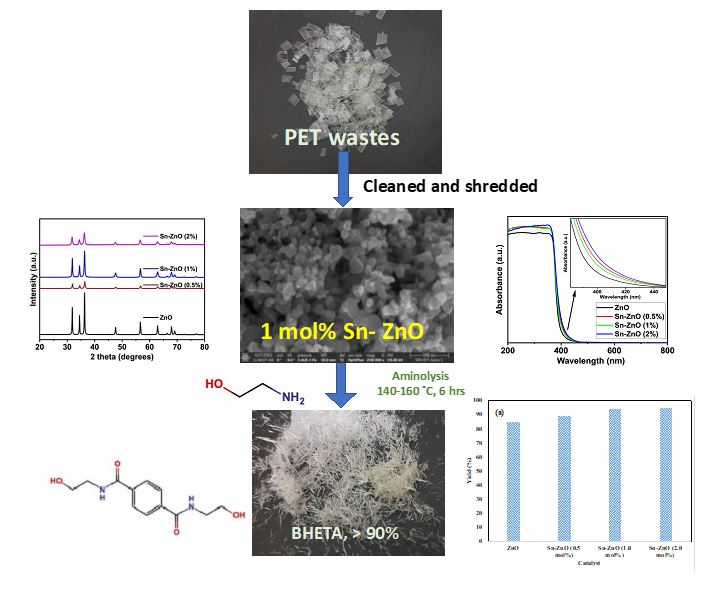
3.2 XRD pattern of tin-doped zinc oxide nanoparticle catalysts: The XRD pattern of Sn(II) doped ZnO nanoparticles synthesized by the sol-gel method. The powder XRD patterns have been recorded from 20 to 80° two theta angles. Figure 2 shows the XRD patterns of the tin-doped ZnO nanoparticles with molar ratios of 0.5, 1.0 and 2.0% of Sn(II).
The change in the crystalline pattern of the Sn(II) substituted ZnO compared with pure zinc oxide nanoparticles. The obtained diffraction patterns of the nanopowders suggest that ZnO showed sharp peaks confirm the good crystalline with a hexagonal wurtzite structure. The peak observed at 2θ = 31.50, 33.760, 35.90, 47.230, 56.180, 62.20 and 67.60 corresponds to the lattice plane (100), (002), (101), (102), (110), (103) and (112), respectively, indicative of the hexagonal structure of wurtzite of ZnO [30, 31].
The reflections (100), (002) and (101) are of high intensity, and other reflections (102), (110), (103) and (112) are of lower intensity. Since the (101) reflection is the highest in all samples, we can conclude that that the particles are oriented mostly in the [101] direction. It means that Sn2+ has been successfully doped. The substitution of different Sn2+ catalysts did not change the hexagonal crystal structure of the wurtzite phase.
Table 1
Yield, lattice parameter, crystallite size and lattice strain of ZnO and Sn-doped ZnO
| Material | Lattice parameters | volume (nm3) | Crystallite size (nm) (Scherrer equation) | Crystallite size (nm) (W-H equation) | Lattice strain € X 10−3 |
| | a (Å) | c (Å) | c/a | | | | |
| ZnO | 1.69 | 5.19 | 3.05 | 12.98 | 37.65 | 80.4 | 1.4 |
| 0.5mol% Sn-ZnO | 1.69 | 5.17 | 3.05 | 12.89 | 19.3 | 38.1 | 2.25 |
| 1.0mol% Sn-ZnO | 1.93 | 5.19 | 2.67 | 16.92 | 21.75 | 49.9 | 2.275 |
| 2.0mol% Sn-ZnO | 2.05 | 5.2 | 2.53 | 19.02 | 15.2 | 15.7 | 2.5 |
The crystallite size was calculated by the Scherrer equation and the Williamson-Hall equation. The crystallite size determined from the three peaks (100), (002) and (101) and the average size is calculated. The crystallite size obtained from Scherrer equation is smaller than the size obtained from the Williamson-Hall equation is observed from Table 1. The crystallite size is decreased on increasing the doping amount of tin % [31]. The crystallite size calculated using Scherrer and W-H method coincide that doping of Sn(II) reduced the crystallite size with respect to the dopant concentration. Similar trend have reported by Siva et al (2020 [31]. In contrary, the lattice strain increased from 1.4 to 2.5 while increasing the dopant concentration due to incorporation of higher ionic radius of Sn(II) in ZnO framework.
3.2 FT-IR spectra of pure and Sn-doped ZnO nanoparticles
FT-IR transmittance spectra of pure and Sn(II) doped zinc oxide nanoparticles of different molar ratios shown in Figure 3, respectively. The spectrum was recorded from 500 to 3500 cm−1. In the pure and different molar ratio of 0.5%, 1.0%, and 2.0% Sn2+, no significant change in vibrational stretching of ZnO observed in the SZO samples compared to the pure synthesized ZnO. For all the samples, major and broad peaks were found between 500 cm−1 and 800 cm−1is assigned due to the stretching vibration of Zn-O. These vibrational frequencies change to 800 cm−1 with an increase in Sn doping. The signals were found in the region 1400 cm−1 - 1700 cm−1 and may be due to C=C and C=O vibrations. Other signals near between 2000 cm−1 and 2400 cm−1 were also observed. Finally, significant peaks were found between 3200 cm−1 and 3500 cm−1. These peaks were attributed to the H2O stretching vibration in the ZnO lattice [34].
3.4 UV-vis absorbance spectra of pure and Sn-doped ZnO nanoparticles:
UV absorption spectra are analyzed for all samples from 200 nm to 800 nm. The optical properties of prepared Sn-doped ZnO nanoparticles were examined by UV Vis spectroscopy (UV Vis 3600 PLUS - SHIMADZU). The UV-visible spectra of the sample Sn (II) doped ZnO nanoparticles showed in Figure 4. Different molar ratios of 0.5%, 1.0%, and 2.0% of the Sn2+ doped ZnO samples exhibit a well-defined absorption peak that corresponds to the hexagonal wurtzite phase [30, 31].
The peaks of the the excitonic absorption was between 380 and 400 nm, which are typical characteristic ZnO NPs peaks, thus, confirm their presence. The bandgap of Sn doped ZnO (molar ratio 1%) is decrease compared to the other molar ratios are 0.5 and 2%. The shifting in absorption peak to the higher wavelength results in decreasing the band gap for Sn- ZnO nanoparticles from 3.23 to 3.12 eV. The incorporation of Sn(II) enhanced photocatalytic activity. The optical direct band gap calculated from the formula Eg = hc/l is 3.24 eV [31].
3.5 HR SEM-EDS:
SEM-EDS study was carried out to examine the morphological changes, particle size, elemental composition of the pure and Sn doped ZnO NPs. SEM images, elemental mapping and EDS signals and their percentage composition of pristine and 1 mol% Sn doped ZnO NPs are shown in Figure 5a-5f. For un-doped ZnO NPs, sharp signals were found for zinc and oxygen, which confirms the formation of ZnO NPs. For 1 mol% Sn-doped sample along with Zn(II), O and Sn(II) signals observed in EDS.
Figures 5a and 5b showed HR-SEM images of pure ZnO and 1mol% Sn doped ZnO magnified at 1µm and 800 nm. SEM images showed that nanoparticles are well dispersed. The ZnO nanoparticles formed are found to be 30 –40 nm in size. The ZnO NPs formed in clusters with well-distinguished nanoparticles. The crystallite size calculated using the Scherrer equation and the William – Hall method obtained from the XRD data also confirmed the formation of 30- 40 nm ZnO nanoparticles. Further, Figure 5b presented 1 mol% Sn doped ZnO nanoparticles magnified at 1 µm, the size of Sn/ZnO nanoparticles found to be in the range of 30 – 40 nm. The XRD pattern also supported the crystallite size observed to be in the range of 30 to 40 nm, as shown in in Table 1. Elemental mapping and the EDS spectrum of pure ZnO and 1 mol% Sn doped ZnO are shown in Figures 5c – 5f (percentage composition of pure ZnO and 1mol% Sn doped ZnO given in supplementary information, Table S1 and Table S2). The ZnO doped with 1 mol % Sn appeared to be well defined nanoparticles cluster at 1 µm magnification. Elemental mapping of 1 mol % Sn/ZnO showed the presence of both Zn as well as Sn atoms (Figure 6c and 6d) [31]. In addition, the EDS spectrum for 1 mole Sn doped ZnO showed the presence of Zn as well as Sn and elemental composition showed as shown in Figure 5e and 5f determined Zn2+ at 80.13% and Sn2+ and at 0.74%, which is very close to 1 mol% Sn(II) doping on ZnO [35, 36].
Depolymerization of PET polymer using ethanolamine:
The deoplymerisation of PET wastes using ethanolamine as aminolyting agent which yield BHETA as a single product [37, 38]. The aminolysis reaction activated by Lewis acidic nature of ZnO, in which carbonyl group of terephthalic ester carbonyl group attracted by ZnO [24]. Further, the incorporation of Sn(II) enhances its catalytic acitivity to give BHETA as a single product. Figure 6a – d showed the aminolysis of PET wastes using ethanolamine (EA) carried out to study the effect of Sn(II) loadings (Fig. 6a), PET-to-EA ratio (Fig. 6b), catalyst-to-PET ratio (Fig. 6c), and efficiency of catalyst with respect to reaction cycle (Fig. 6d).
Figure 6a showed the effect of Sn2+ loading on the yield of bis (hydroxy ethyl) terephthalimide. The increasing doping of Sn2+ has positive influence on the yield of (BHETA). However, ZnO NPs showed yielded 83% of BHETA. 1 and 2 mol% of doping of Sn2+ on the ZnO enhanced BHETA yield upto 95%. The increase in BHETA yield could speculated due to the addition of 2 mol% Sn2+ reduced the bandgap from 3.25 to 3.17 eV, which increased the catalytic efficiency of the ZnO. The optical bandgap calculated from the Tauc plot (Figure 3) indicates the decrease in the band gap when increasing the amount of Sn2+ doping reported that increasing the amount of Sn2+ doping from 3 to 5% as prepared using the coprecipitation method increased the photocatalytic efficiency of ZnO. According to Fig. 6a, the doping of 1 mol % and 2 mol % Sn loaded ZnO showed BHETA yield more than 95% the single product. The BHETA is hot-water soluble, which have been isolated and crystallised as needle shaped pale yellow-coloured crystals without any further purification. As observed in Fig. 6a, the pristine ZnO showed almost 85% BHETA without Sn doping. The analysis of BHETA showed the formation of single depolymerised product using the eluent 40:60% of EA:Hex. In order to confirm the structure, FT-IR, 1H NMR, 13C NMR and MS analysis have been carried out. Both 1H and 13C NMR spectra showed pure form of BHETA.
Figure 6b showed the effect of PET to EA ratio has been studied at various weight % of PET:EA ratios. In this study, the amount of PET was kept constant at 1g, with respect to the volume of ethanolamine that varied from 1 ml, 5 ml, 10 ml, 15 ml, 20 ml and 25 ml to achieve a ratio of 1:1, 1:5, 1:10,1:15, 1:20 and 1:25 of the PET: EA ratio. The study revealed that the the 1:1, 1: 5 and 1:10 ratio provided 60 to 70% of BHETA. Whereas, 1:15-1:25 ratio afforded more than 80% of BHETA in particular, 1:20 ratio of PET:EA delivered 94% yield, while is almost comparable with yield obtained for 1:25 ratio. The dissolution of PET in lower ratio of EA is a major issue for the progress of the reaction (Gopal Jeya et al 2020, APM). Whereas, the 1:20 ratio could be more optimum for the smooth running of the reaction.
Figure 6c summarises the effect of the catalyst-to-PET ratio, which is crucial for the effective aminolysis of PET wastes. In this study, the amount of catalyst (1 mol % Sn doped ZnO) has been fixed at 50 mg throughout the study with respect to catalyst weight, the amount of PET wastes has been varied from 100 mg to 500 mg to achieve 1:2, 1:5, 1:10, 1:15, and 1:20 ratio. The study clearly indicated that the increasing amount of catalyst, that is, the catalyst-to-PET ratio at 1:2, 1:5, 1:20, afforded the yield of BHETA above 90%. However, the ratio at 1:15 almost gives an 85% yield of BHETA. The study revealed that the ratio of catalyst: 1: 5 to 1: 5 to PET could be optimal to achieve more than 85% of the aminolysed product, BHETA in pure and single product.
Figure 6d displayed the recycling ability of 1 mol% Sn-doped ZnO NPs towards aminolysis of PET. About 1g of PET wastes dissolved in 20 ml and stirred at 155-160 0C in the presence of 100 mg of 1 mol% Sn doped ZnO. The study showed the catalyst could be reusable upto 7 cycles without losing its activity.
Spectral characterisaion of BHETA
The complete depolymerisation of PET wastes generate BHETA as a single product. However, there could be possibility of forming dimer and oligomeric products due to incomplete depolymerisation. Thus, spectral characterisation such as 1H and 13C NMR, and MS and FT-IR analysis have been carried out. The structural characterisation of depolymerised product, BHETA have been carried out to confirm the purity and structural confirmation. 1H and 13C NMR of BHETA is given Fig. 7a and 7b respectively (Full spectrum given in supplementrary information Figure S3 and S4), and chemical structure of Fig. 7e. The ESI-MS and FT-IR spectrum of BHETA given in Fig. 7c and 7d respectively. The 1H NMR spectrum of BHETA showed two NH protons attached with amide carbonyl (C7 and C8) (-C=O) and ethylene carbons (C9 and C10) (-CH2) appeared as triplet at 8.35 – 8.55 with J value of 5.5 Hz. The presence of NH protons confirms the depolymerisation and formation of BHETA. The number, position and multiplicity of aromatic protons give valid information on monomer, dimer and oligomeric nature of the depolymerised products. The skeleton of BHETA molecule is symmetrical, which confirmed from signal of aromatic protons attached to C1, C2, C4 and C5 appearing as singlet at 7.92 ppm that shows not only BHETA is the pure and single product but also indicates complete depolymerisation of PET wastes. In addition, two -OH protons attached to methylene carbons (C11 and C12) (-CH2) appeared as triplet at 4.74 – 4.76 ppm with 5.5Hz. The protons of methylene group (C11 and C12) attached to -OH appeared as a quartet between 3.51 and 3.54 ppm with J value of 6 Hz. Another, methylene protons (C9 and C10) attached to amide -NH group gives quartet at 3.33-3.37 ppm with J value of 6Hz. The presence of eight aliphatic protons attached to two ethylene group (-CH2-CH2-) confirms the attachment of two 2-hydroxy ethyl group to terephthaloylamido group (-NH-CO-C6H4-CO-NH-) of BHETA. Fig. 7b is 13CNMR spectrum of BHETA. The presence of two amide carbonyl (C7 and C8) (NH-C=O) appeared as single peak at 166.1 ppm indicates that BHETA is formed as a single product in pure form from the complete depolymerization of PET wastes. The two aromatic carbons (C3 and C6) attached to amide carbonyl appeared at 137.1 ppm and all other four carbons (C1, C2, C4 and C5) appeared as a triplet at 127.63 – 127. 53 ppm. The methylene carbon (C11 and C12) attached to the hydroxyl group appeared as a single peak at 60.19 ppm. Whereas methylene carbons (C9 and C10) attached to NH-group at amide appeared at 40. 7 ppm. Both 1H and 13C NMR confirmed the formation of BHETA as a single pure product. The product is isolated in pure form without the need for purification.
The mass spectrum of aminolysed product, bis (hydroxy ethyl) terephthalamide is given Fig. 7c (Full spectrum given in supplementary information, Figure S5). The molecular formula of BHETA is C12 H16N2O4 with molecular weight is 252.27 g/mol. The spectrum recorded using the electron spray ionisation method revealed the molecular ion peak at 253.15 (M + H) in the protonated form. Another peak at m/z 275.10 indicates the formation of Na+ form of BHETA due to electron spray ionisation.
Furthermore, the FT-IR spectrum (Fig. 7d) of BHETA has been carried out as a KBr disc, and vibrational frequencies have been recorded from 400 to 4000 cm−1 (Full spectrum given in supplementery information, Figure S6). In 3250 – 3400 cm−1 two sharp peaks observed due to the presence of -NH and -OH groups connected methylene carbon C9 and C10, and C11 and C12 in BHETA, respectively. The intermolecular H-bonding ascertained from the broadness of the peaks. The aromatic -CH- stretching vibration observed at 2830 – 2860 cm−1 and aliphatic CH2 stretching vibration frequencies observed at 2920 – 2960 cm−1. The amide carbonyl (C7 and C8) (-NH-C=O) stretching vibration is observed at 1635cm−1. The aromatic (C1-C6) -C=C- stretching vibration observed in 1550cm−1. In addition, -OH bending shown at 1180 cm−1 and aliphatic -CH skeletal vibration observed at 1090cm−1. The presence of an aromatic and aliphatic -OH and -NH stretching vibration as well as amide carbonyl vibration confirmed the formation of BHETA.