Major limitations in direct recovery of bioproducts from unclarified feedstock are predominantly associated with the presence of suspended whole and lysed biomass in processing systems. Most commonly, biomass interaction with adsorbent beads, synthetic membranes, and other processes surfaces causes fouling. This phenomenon is usually detrimental to bioprocess performance. This study focused on the development of a simple, easy to implement, economical and robust technique to evaluate biomass deposition and screening for chemical agents able to prevent such phenomenon. The results were confirmed by linking biomass deposition with surface energetics according to the extended Derjaguin, Landau, Verwey and Overbeek (xDLVO) theory. Assay development involved the modification of the inside surface of microwell polystyrene plates with diethyl-aminoethyl (DEAE) functional groups. The resulting microplate surface mimics commercial chromatographic anion-exchangers matrices that are prone to biomass fouling. Two biomass types, Saccharomyces cerevisiae and Chinese hamster ovary (S. cerevisiae and CHO, respectively) cells and twenty-five polyelectrolytes or amphiphilic compounds were employed. Results showed that DEAE-modified surface had the highest cell deposition while agent-coated wells showed varying degrees. Direct experimental observations and calculations performed based on xDLVO approach indicated that polyacrylic acid, polymethacrylic acid, and poly(vinyl sulfate) could prevent CHO cells and yeast deposition. On the other hand, polysulphonic acid and poly(sodium 4-styrenesulfonate) were only effective to prevent yeast deposition. Microscopic visualization of polymer-coated beads in the presence of biomass confirmed the mentioned results.
Research
Convenient Screening of Antifouling Agents for Direct Recovery of Bioproducts Employing a Fast Microplate Assay
https://doi.org/10.21203/rs.3.rs-127211/v1
This work is licensed under a CC BY 4.0 License
Version 1
posted
You are reading this latest preprint version
Downstream Bioprocessing (DSP) of biopharmaceuticals is generally cost demanding in comparison to other stages of manufacturing in biopharmaceutical industry, as it accounts for up to 80% of production costs. The recent significant advances in fermentation technologies have resulted in higher yields reaching up to 20 g/l, which was unimaginable a few decades ago [1, 2]. However, despite the advancements mentioned, developments in DSP have failed to match the upstream performance. New classes of biomolecules such as monoclonal antibodies (mAbs), plasmid DNA (pDNA), virus-like particles (VLPs) or nanoplexes, as well as whole cells (e.g., stem cells), demand customized modern downstream practices that are currently more challenging to perform. These challenges can be overcome by a direct product sequestration of the crude feedstock via integrated bioprocess, a technique currently applied on the purification of biomolecules directly from the fermentation broth with the purpose of reducing process time and cost. Expanded bed adsorption (EBA) is one of such technologies, and it is playing a key role in direct product recovery; it can simultaneously perform solid separation and product concentration and (partial) purification. Such integrated technologies offer a competitive edge in making a process economical by reducing the number of unit operations, process time and capital demand [3]. However, severe biomass-adsorbent interactions in EBA usually disturb the stable expansion of the bed, resulting in distorted bed hydrodynamics. Biomass deposition can also adversely impact on adsorbent quality and thereby reduce protein binding capacities, as well as, adsorbent shelf life. Numerous efforts have been put in place to reduce such interaction by modifying the mobile phase, feedstock conditioning and coating of antifouling polymer on adsorbents [4–6].
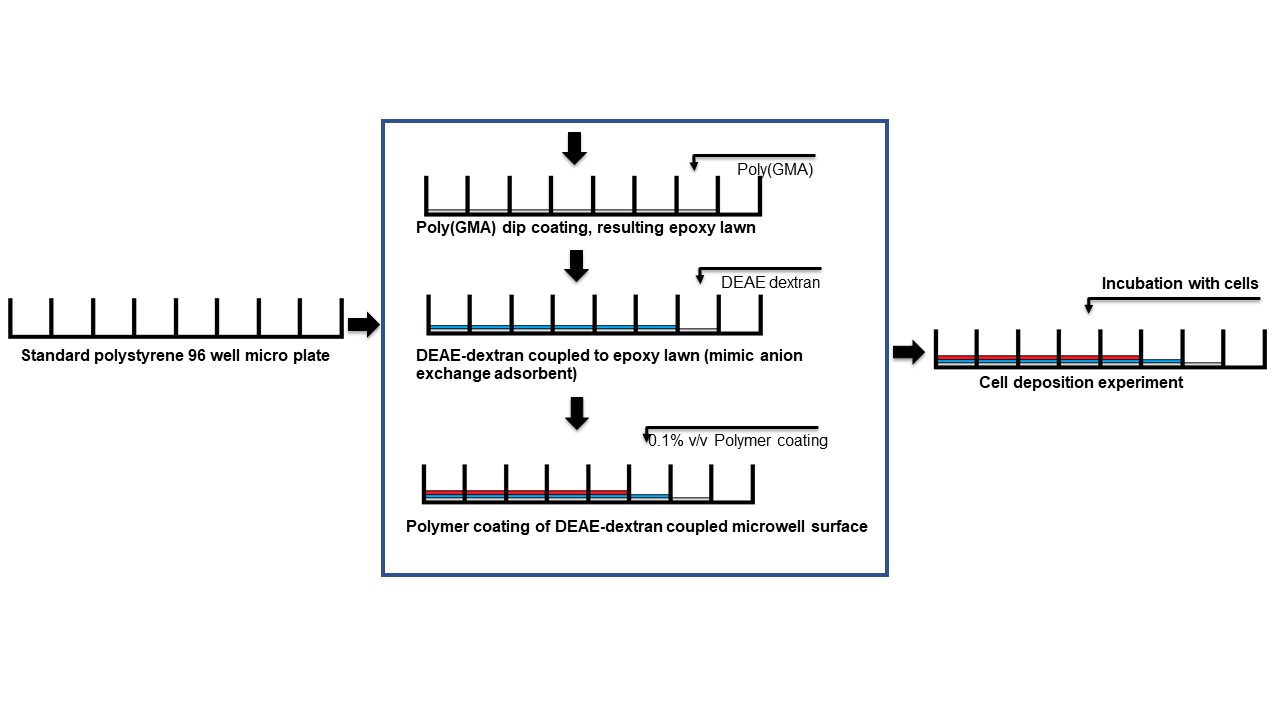
Biomass deposition experiments are normally performed in small beakers or small Petri dishes containing adsorbents or using small-scale membrane cells. This process is laborious, expensive and time-consuming. Therefore, such experiments can be substituted by a surface modified microtiter plate technique [7]. Monomers like glycidyl methacrylate (GMA), the ester of methacrylic acid and 2, 3-epoxy-propanol, bears a reactive epoxide group which reacts with either sulfhydryl-, amino-, carboxyl- or hydroxyl groups to form stable covalent bonds. Such epoxy-modified polymer-surfaces are stable over long storage periods and are relatively resistant to hydrolysis. Polymerized GMA, i.e., poly glycidyl methacrylate (PGMA) can easily be dip-coated onto polystyrene plates [8] and the epoxide groups of PGMA react most efficiently with primary hydroxyl groups mainly at the end of the dextran chains [9, 10]. Normally, PGMA surface can be functionalized by introducing DEAE-dextran to mimic an anionic exchange chromatography adsorbent structure.
Furthermore, colloidal chemistry principles can be applied to understand the biomass-adsorbent interaction at the particle level, which is, at the nanometer scale. Extended Derjaguin, Landau, Verwey, and Overbeek (xDLVO) approach has successfully been applied to assess the interfacial forces acting between biomass (and biomass-derived particles) and chromatography adsorbents or supports. Such interactions are mainly influenced by long range electrodynamic Lifshitz–van der Waals (LW) and electrostatic (EL) and short-range acid–base (AB) interfacial interactions. The electrostatic interactions caused by the presence of overlapping double layers of counter ions near charged surfaces in aqueous media can be used to determine the zeta potential. In addition, Lifshitz–van der Waals and acid–base forces can be calculated by determining contact angle values with three diagnostic liquids. Knowledge of these fundamental forces could help us understand the experimental data in a logical way and to assist in the designing of future bioprocess materials or processes [11–13].
One of the strategies to modify adsorbent surfaces is by coating with a thin layer of water-soluble polymers; this method does not make any permanent change of the adsorbent chemistry and but can impact on its surface properties. Under certain circumstances -and depending on the adsorption affinity of the polymer for the adsorbent- the polymer coating can be generated in a stable manner. This process is more cost-effective when compared to purchasing new adsorbents [14]. As of now, based on author’s knowledge such an application has not been sufficiently explored with a broad range of polymers.
In this work, we aimed at developing a microwell based cell deposition assay, which is simple, easy to handle, economical and robust. We measured the surface energies of the interacting pairs involved in the interaction, which enabled us to calculate and assess the underplaying interfacial forces. By combining analysis of the results from cell deposition and xDLVO calculation, we shortlisted polymers with cell “repellent” properties towards S. cerevisiae and CHO cells. To validate this property of the polymers process conditions, EBA adsorbents were coated with candidate polymers, made them interact with cells under microscopic examination.
2.1. Materials
Polystyrene (PS) flat-bottom 96 microwell plate were purchased from Greiner Bio-One GmbH, Germany. Glycidyl methacrylate (GMA), azo-iso-butyrodinitrile (AIBN), sodium borohydride, poly(methacrylic acid) sodium salt Mw ~ 9,500 (PMA), poly(vinyl sulfate) potassium salt Mw ~ 170000 (PVS), poly(vinyl sulfonic acid) sodium salt (PSS), poly(4-styrenesulfonic acid) Mw ~ 75,000 (PS4), polyvinylpyrrolidone Mw ~ 360,000 (PVP), poly(vinyl alcohol) Mw 89,000–98,000 (PV1), poly(propylene glycol) Mn ~ 4,000 (PPG), poly(ethylene glycol) Mn ~ 3,350 (PG3), poly(ethylene glycol) Mw ~ 8,000 (PG8), poly(ethylene glycol) Mw ~ 20,000 (PG2), poly(methyl vinyl ether) (PVM), TWEEN® 20 Mw ~ 1228 (T20), TWEEN® 80 Mw ~ 310 (T80), Pluronic® F-108 Mn ~ 14,600 (F18), Brij® 58 average Mn ~ 1124 (B58), Brij® 35 average Mn ~ 1,198 (B35), DEAE-Dextran hydrochloride (DED) from Sigma–Aldrich, Germany. Dimethylsulfoxide (DMSO), methanol were from Carl Roth GmbH, Germany. Polyacrylic Acid Mw ~ 345,000 (PAA) from Polysciences, Germany. Sulfonated PEEK (sPK) was synthesized as per [15] from PEEK 450PF gifted by Victrex Europa GmbH, Germany. Hyaluronic acid (HLA) purchased from Amazon, Germany. All other chemicals and salts were purchased from AppliChem, Germany. Milli-Q purified water was used in the preparation of solutions.
The infrared spectra of the modified surface were recorded on an FTIR spectrometer Bruker Vector 33 (Bruker, Germany), scanned (averaged over 32 scans) from 4000 cm− 1 to 500 cm− 1 and analyzed using Bruker OPUS software package. Yeast cells were grown in CERTOMAT® IS incubator (Sartorius, Germany), CHO cells where grown in Heraeus ET 6130 humidified incubator with CO2 control and an orbital shaker (Heraeus, Germany). Optical densities were measured on Tecan Infinite 200 Pro Plate Reader (Tecan, Germany), microscopic visualization of beads was done using an Axioplan 2 imaging (Zeiss) microscope and images were acquired with the AxioVision (V. 4.8) software (Carl Zeiss, Germany)
2.2. Microbial and cell cultures
Cultivation of yeast cells, Saccharomyces cerevisiae (S. cerevisiae) was performed using shake flasks, harvested at late exponential phase, as described elsewhere [16].
Suspension cultures of Chinese hamster ovary (CHO) cells were grown in Gibco® FreeStyle™ CHO expression medium with 8 mM L-Glutamine (Gibco®) and 5 ml/L of penicillin-streptomycin (Gibco®). Cells were incubated in flasks with loosened caps in a 37 °C incubator containing a humidified atmosphere of 8% CO2 in the air on an orbital shaker platform rotating at 110 rpm. Harvested cell cultures contained 4–5 × 10⁶ viable cells/ml, the viability of cells was 95–99%.
Both cells types were harvested by centrifugation and washed three times with phosphate buffer. In all experiments, fresh cells, with more than 95% viability were used.
2.3. Modification of microwells with DEAE-Dextran
The detailed methodology for the modification of microwell plate is described elsewhere [16]. Briefly, PGMA was synthesized by homo-polymerisation of glycidyl methacrylate in methanol with 2,2′-Azobis(2-methylpropionitrile) as an initiator. Then wells of the plate were dip coated with PGMA. After the residual solvent evaporation, plates were washed three times with Milli-Q water and dried at room temperature for further use. One hundred microliters of the reaction mixture consisting of DEAE-dextran (10 mg/mL) dissolved in reagent solution (1 mL of 1 M sodium hydroxide, 3.6 mg of sodium borohydride, and 0.4 mL of water) was added per well to couple DEAE-Dextran to the epoxide groups of the coated PGMA lawn. Once the reaction was completed after 18 hours, plates were washed with phosphate buffer until neutral pH was reached. Plates were stored in Phosphate buffer at 4 °C for further use.
2.4. Contact angle measurement
The contact angle for the polymers was measured using a polymer coated glass slide. Polymer films on the glass slides were prepared by spin-coating with a homemade spin coating instrument. Before coating glass slides were cleaned with ethanol and dried under a stream of nitrogen. All coatings were performed with the spinning velocity of 300 rpm and the spinning time of 30 seconds.
Contact angles experiments were performed as per the sessile drop method using an optical contact angle apparatus OCA 20 equipped with a video measuring system having a high-resolution CCD camera. SCA 20 software was used for data acquisition and analysis. Both OCA 20 and SCA 20 are from Data Physics Instruments GmbH, Filderstadt, Germany. The three diagnostic liquids, 1-bromonaphthalene, formamide, and water, were employed. All the measurements were performed in triplicate, and at least 20 contact angles per samples were measured.
2.5. Zeta potential measurement
Zeta potential measurements were made using ZetaSizer Nano-ZS (Malvern Instruments, Malvern, UK). Since most of the polymers utilized in the study are polyelectrolytes, they scatter light in much the same way as particles and based on their charge, they respond like particles to an applied electric field. Thus, it is possible to measure polyelectrolyte mobility and extract a zeta potential value to characterize these materials [17]. The OD600 nm of the polymer solutions is maintained in the range of 0.05–0.1 absorbance units in their corresponding buffers solutions. All the measurements were performed in triplicates. Zeta potential was calculated from the electrophoretic mobility data according to the Smoluchowski’s equation [18].
2.6. Polymer coating and modified finite bath experiments
All the polymers were dissolved in 20 mM Phosphate buffer pH 7.4 at 1% v/v concentration. Coating of the wells was performed by placing 300 µL per well of polymer solution on the respective well of the plate and incubated for 30 min at room temperature. After the incubations, plates were washed twice with the same buffer to remove the unbound polymer.
The cell partition index (CPI) was measured by static cell deposition experiments of biomass on microwell coated with and without polymers. A cell suspension of concentration samples (OD600 = 1.0) was taken in quantities of 300 µL per well and incubated for 30 min under gentle rocking agitation. The optical density of the load before and after the experiment cell suspension was measured at 600 nm. A standard curve for absorbance at 600 nm for the concentration of cells was established and used for extrapolation of unknown concentration of cells from OD600. CPI is the ratio of the initial concentration of the cell suspension to a concentration of cell suspension after incubation.
2.7. Extended DLVO calculations
The total xDLVO interaction energy (UXDLVO) between two colloidal surfaces, as presented in Eq. 1, was articulated as the sum of influences from three components, i.e. hydrophobic Lifshift-van der Waals (ULW), polar acid-base (UAB), and electrostatic (UEL) interaction energies [19].
 (1)
(1)
By determining the contact angle values (θL) formed on a surface (S) under examination with a well-established combination of three diagnostic liquids, 1-bromonaphthalene (apolar), formamide (polar), and water (polar) of known surface energy parameter, surface energy components of the surface (S) itself was determined by simultaneously solving the Young-Dupré equation for each liquid (L) as shown in Eq. 2 [19].
 (2)
(2)
The electrostatic interaction energy component depends on zeta potentials of the interacting surfaces and was calculated by the Debye-Hückel length (κ−1) of the solution. Debye-Hückel length depends on the ionic strength of the medium (µ), its dielectric constant (εr), as well as its temperature (T). (See Eq. 3)
 (3)
(3)
The surface energy parameters calculated from Eqs. 2 and 3 were subsequently used to calculate ULW, UAB, and UEL interaction energy components using the standard equations of the xDLVO theory that were adapted for biomass-adsorbent systems and which are mentioned in several previous reports [20–23].
The main rationale behind the development of a microwell plate based cell adhesion methodology is due to the effectiveness of the finite bath experiments in studying the degree of cell adsorption to stationary phases, in which Fernandez-Lahore et al. have extensively worked on [11, 24, 25]. Concisely, the methodology involved a cell suspension that was made to contact with an adsorbent (e.g. chromatography support) over a prolonged period under gentle mixing, and it was observed that as the degree of cell adsorption increases, cell concentration in the suspension decreases. This was quantified by calculating the ratio of final cell concentration at the end of the experiment to initial cell concentration.
One major limitation of the finite bath experiments described earlier is that they are time-consuming, laborious and expensive (based on a number of adsorbents involved). The method described here is a scaled-down version of the existing technique making it easier to use, faster and economical by adopting the classical method of a 96-microwell format, where adsorbent surfaces are coupled to the inner walls of the microwell plate.
3.1. Polymer synthesis and 96-microwell plate modification
Dip-coating is a simple method used to modify the surface with polymers, and the procedure is easy to perform, economical, and the surface modification can easily be controlled. To produce a microwell plate with a modified surface, a polymer was initially synthesized. The synthesis of a homopolymer of poly-glycidyl methacrylate was achieved by polymerizing glycidyl methacrylate and 2,3-epoxy-propanol thereby allowing them to react with amino [26] and hydroxyl groups [8] to form a stable covalent bond without any cross-linking agent. These polymers are chemically stable over long storage periods and are relatively resistant to hydrolysis [27]. Additionally, the advantage of end reaction mixture of polymerization reaction contains PGMA-DMSO a solution that is polystyrene-compatible [8]. The polymerization conditions and procedure are described in detail by Eckert et al. [8].
The synthesized polymer was further coupled with DEAE dextran, and the product was analyzed by FTIR. The IR spectra of GMA, PGMA, and DEAE-dextran coupled with PGMA coated on microwell plate are shown in Fig. 1. From the results it can be observed that among the characteristic vibrations, 2900–2800 cm− 1 and 1100–1000 cm− 1 are for the DEAE functionality and the vibration resulting from double bond in the GMA is at 1620 cm− 1, and 730 cm− 1 indicates the carbonyl groups of GMA [8, 28]. The IR spectra noticeably characterize the films of polymerized GMA and introduction of the DEAE functionality to the epoxide group.
3.2. Contact angle measurements
For the measurement of contact angles, diagnostic liquids like water, formamide, and 1-bromonaphtalene were employed on polymer-coated glass slides using the sessile drop technique. The surface free energy components Lifshitz–van der Waals (γLW) and acid–base (γAB) as well as, the electron-donating (γ−) and electron-accepting parameters (γ+) of the liquids used were obtained from the literature [29], while the surface free energy components of biomass were taken from previously published literature [11, 25].
Table 1 shows the contact angle values for S. cerevisiae and CHO cells, which are relevant to process situations and were employed as model biomass system for our studies. Cells were equilibrated in 20 mM phosphate buffer pH 7.4, which offers a chemical environment comparable to that found in ion-exchange sorption processing in industrial practice. When comparing the biomass type, contact angles values for water varied from 15 °C (yeast cells) to 26.1 °C (CHO cells). Similarly, formamide contact angle ranges from 14 °C (yeast cells) to 30.2 °C (CHO cells). This sequence can be interpreted regarding decreased hydrophilic/hydrophobic ratio in agreement with the earlier reports [20, 29]. Polymer contact angles were measured on thin layers of polymers coated on glass slides using spin coating; this enables us to measure the contact angles using the sessile drop method. Dried polymeric surfaces showed a relatively higher affinity for 1-Bromonaphthalene in comparison to hydrated samples. When comparing the polymer type, contact angles values for water varied from 9.2 °C (TWEEN® 20) to 55.5 °C (Poly(methyl vinyl ether) and for formamide, contact angles range from 7.2 °C (Poly(vinyl sulfonic acid)) to 52.6 °C (Pluronic® F-108), while contact angles for 1-Bromonaphthalene range from 7.9 °C (Poly(ethylene glycol) 3550) to 39.3 °C (Poly(methyl vinyl ether)) representing the diversity of the surface energy parameters present in the polymer library tested for antifouling property. Using the contact angle values listed in Table 1, surface free energy components were calculated using modified Young–Dupré equation [30], and all the surfaces analyzed showed hydrophilic in nature. The differences found in the surface energies can be attributed to the functional groups present on the surface.
|
Material |
Contact angle (θ) |
||
|---|---|---|---|
|
H20 |
FMD |
ABN |
|
|
Biomass |
|||
|
S. cerevisiae cells |
15 ± 2 |
14 ± 1 |
54 ± 1 |
|
CHO cells |
26.1 ± 0.7 |
30.2 ± 0.2 |
42.3 ± 0.5 |
|
Control |
|||
|
DEAE-Dextran |
18.3 ± 0.6 |
20.6 ± 1.2 |
14.2 ± 0.7 |
|
Polymeric material |
|||
|
Polyacrylic acid 345 (PAA) |
47.9 ± 2.3 |
20.5 ± 1.7 |
15.6 ± 4.6 |
|
Poly(methacrylic acid) (PMA) |
43.5 ± 2.7 |
34.6 ± 2.6 |
36.2 ± 0.4 |
|
Poly(vinyl sulfate) (PVS) |
14.2 ± 2.1 |
25.4 ± 6.5 |
14.8 ± 0.7 |
|
Poly(vinylsulfonic acid) (PSS) |
11.1 ± 1.3 |
7.2 ± 0.2 |
16.8 ± 0.5 |
|
Poly(4-styrenesulfonic acid) (PS4) |
39.6 ± 0.6 |
36.7 ± 1.1 |
24.5 ± 1.8 |
|
Sulfonated PEEK (sPK) |
24.9 ± 1.7 |
29.8 ± 2.5 |
13.3 ± 0.8 |
|
Hyaluronic acid (HLA) |
32.1 ± 2.4 |
18.6 ± 0.1 |
32.2 ± 0.7 |
|
Polyvinylpyrrolidone 360 (PVP) |
50.3 ± 6.7 |
44.5 ± 2.5 |
16.8 ± 1.7 |
|
Poly(vinyl alcohol) 89–98 (PV1) |
31.7 ± 1.1 |
31.2 ± 0.2 |
14.1 ± 0.6 |
|
Poly(propylene glycol) (PPG) |
41.3 ± 1.4 |
30.9 ± 0.8 |
33.8 ± 1.1 |
|
Poly(ethylene glycol) 3550 (PG3) |
16.8 ± 0.3 |
19.1 ± 0.5 |
7.9 ± 1.4 |
|
Poly(ethylene glycol) 8000 (PG8) |
14.5 ± 2.1 |
28.7 ± 0.7 |
8.1 ± 2.4 |
|
Poly(ethylene glycol) 20000 (PG2) |
30.2 ± 0.9 |
32.4 ± 1.7 |
8.0 ± 0.8 |
|
Poly(methyl vinyl ether) (PVM) |
55.5 ± 2.2 |
49.9 ± 0.6 |
39.3 ± 0.7 |
|
TWEEN® 20 (T20) |
9.2 ± 0.9 |
15.1 ± 2.0 |
24.3 ± 0.7 |
|
TWEEN® 80 (T80) |
17.0 ± 2.0 |
15.4 ± 1.6 |
25.0 ± 1.8 |
|
Pluronic® F-108 (F18) |
51.6 ± 0.3 |
52.6 ± 0.2 |
26.0 ± 0.1 |
|
Brij® 58 (B58) |
42.2 ± ± 2.6 |
38.9 ± 4.8 |
31.4 ± 1.0 |
|
Brij® 35 (B35) |
55.7 ± 2.5 |
29.1 ± 1.1 |
33.1 ± 1.5 |
| DData were taken from [11], B data taken from [25], C Own measurements | |||
Electrostatic interactions are forces applicable over a longer range as compared to Lifshitz–van der Waals (γLW) and acid–base (γAB) interactions and are one of the main factors influencing the colloidal interaction; it can be determined by measuring zeta potential. Zeta potential measurement is usually done using various salt concentration (0, 25, 50, 100 mM NaCl) in the binding buffer and it is then scaled up to any required condition using standard scaling condition [5, 31]. In our work both biomass types showed a similar surface charge of around ~ 20 mV, a negative zeta potential due to the nature of the outer membrane lipid and surface proteins of respective cell type. The control sample of the experiment was a positively charged DEAE-dextran surface having positive surface charge of 5.3 mV, which had the highest tendency for cell attachment. The polymer library zeta potential ranged from − 2.5 mV (PEG 8000) to -37.3 mV for sulfonated PEEK, indicating that polymer library consists of the various degree of magnitude of surface charge.
3.3. Calculation of interfacial free energy between biomass and polymer surface
Surface energies data obtained by contact angle measurement and the surface charge determination by zeta potential measurement can be employed for interaction energies calculation at specific buffer conditions. In our work we used, sphere-to-plate (cell to adsorbent) geometry to mimic the interaction between cells and chromatography adsorbents coated with polymers or polymeric beads of similar sizes and it enabled backward comparison with earlier published data [20]. For calculating intact yeast cells, the diameter was taken as 10 µm, for CHO cells 15 µm and for adsorbent 200 µm was considered.
Anion-exchanger surfaces, such as DEAE dextran are well-known to strongly interact with cells, mostly due to charge-mediated (electrostatic) effects [32]. As shown in Fig. 3, the interaction energy for DEAE surface and yeast cells was − 77 kT and DEAE surface with CHO cells was − 204 kT in 20 mM phosphate buffer, pH 7.4. The interaction between CHO cells and DEAE surface was comparatively much higher than that of with yeast cells. Polymer coating has the capability to alter the interactions between microbial cells and adsorbents in aqueous media [6, 33, 34], by stimulating changes in the free interfacial forces (or free energy) between bodies [4]. However, there has been insufficient research conducted till now. In this work, we successfully performed the xDLVO calculations for twenty-three polymers interacting with yeast and CHO cells. The degree of interaction varied and mainly due to the difference in surface energies, surface charge, and size of the cells. Based on xDLVO calculations for yeast polymer interaction, Poly(methyl vinyl ether) showed lowest interaction with − 25 kT, followed by poly(methacrylic acid) with − 28 kT and PEG 8000 showed highest with − 58 kT. For polymer interaction with CHO cells, poly(methyl vinyl ether) showed lowest interaction with − 76 kT, followed by poly(methacrylic acid) with − 84 kT and PEG 8000 showed highest with − 170kT. Comparing the interaction data, the highest and the lowest interacting polymer for both cell type remained the same. However, we can clearly see the degree of interaction is greater with CHO cells. As mentioned before, surface energy values for polymers are measured in a dry condition, which showed higher affinity to 1-bromonaphthalene, because of this, xDLVO calculation results are more qualitative in nature indicating the trend than absolute interaction. All the polymers showed some degree of cell repellence in comparison to the interaction energies of the naked DEAE dextran surface. A complete list of the interaction energy for polymers and cell types are listed in Table 3.
|
Material |
Surface energy parameters (mJ m-2) |
Zeta potential (mV) at 20 mM PB pH7.4 |
||||
|---|---|---|---|---|---|---|
|
γLW |
γ+ |
γ− |
γAB |
γSTotal |
||
|
Biomass |
||||||
|
S. cerevisiae cells |
27.9 |
4.4 |
51.5 |
30.1 |
58.0 |
-20.0 |
|
CHO cells |
33.6 |
1.2 |
52.1 |
15.8 |
49.4 |
-21.0 |
|
Control |
||||||
|
DEAE-Dextran |
43.1 |
0.4 |
53.8 |
9.5 |
52.6 |
5.3 |
|
Polymeric material |
||||||
|
Polyacrylic acid 345 (PAA) |
42.8 |
1.7 |
22.0 |
12.3 |
55.0 |
-8.6 |
|
Poly(methacrylic acid) (PMA) |
36.2 |
1.1 |
34.1 |
12.0 |
48.3 |
-18.1 |
|
Poly(vinyl sulfate) (PVS) |
42.9 |
0.2 |
59.6 |
6.4 |
49.4 |
-8.6 |
|
Poly(vinylsulfonic acid) (PSS) |
42.5 |
0.9 |
53.2 |
14.0 |
56.5 |
-5.5 |
|
Poly(4-styrenesulfonic acid) (PS4) |
40.5 |
0.2 |
41.4 |
5.7 |
46.2 |
-6.6 |
|
Sulfonated PEEK (sPK) |
43.2 |
0.1 |
54.0 |
4.7 |
47.9 |
-37.3 |
|
Hyaluronic acid (HLA) |
37.8 |
1.9 |
39.1 |
17.1 |
55.0 |
-7.1 |
|
Polyvinylpyrrolidone 360 (PVP) |
42.5 |
0.0 |
32.9 |
0.5 |
43.1 |
-4.3 |
|
Poly(vinyl alcohol) 89–98 (PV1) |
43.1 |
0.1 |
47.4 |
5.3 |
48.4 |
-5.3 |
|
Poly(propylene glycol) (PPG) |
37.2 |
1.2 |
34.7 |
12.9 |
50.1 |
-6.3 |
|
Poly(ethylene glycol) 3550 (PG3) |
44.0 |
0.4 |
54.2 |
9.1 |
53.0 |
-3.1 |
|
Poly(ethylene glycol) 8000 (PG8) |
44.0 |
0.0 |
62.0 |
2.9 |
46.8 |
-2.5 |
|
Poly(ethylene glycol) 20000 (PG2) |
44.0 |
0.0 |
50.2 |
3.1 |
47.1 |
-4.7 |
|
Poly(methyl vinyl ether) (PVM) |
32.5 |
0.4 |
29.1 |
6.7 |
39.2 |
-5.9 |
|
TWEEN® 20 (T20) |
41.1 |
0.8 |
56.2 |
13.5 |
54.6 |
-8.4 |
|
TWEEN® 80 (T80) |
41.2 |
0.8 |
56.2 |
13.5 |
54.7 |
-8.2 |
|
Pluronic® F-108 (F18) |
36.1 |
0.0 |
37.5 |
0.0 |
36.1 |
-9.7 |
|
Brij® 58 (B58) |
37.4 |
0.4 |
39.4 |
7.8 |
45.2 |
-4.1 |
|
Brij® 35 (B35) |
38.2 |
2.4 |
16.2 |
12.4 |
50.6 |
-9.6 |
|
Material |
|U| (kT) |
|
|---|---|---|
|
S. cerevisiae |
CHO |
|
|
Control |
||
|
DEAE-Dextran |
-78 |
-204 |
|
Polymeric material |
||
|
Polyacrylic acid 345 (PAA) |
-48 |
-148 |
|
Poly(methacrylic acid) (PMA) |
-28 |
-84 |
|
Poly(vinyl sulfate) (PVS) |
-47 |
-143 |
|
Poly(vinylsulfonic acid) (PSS) |
-50 |
-151 |
|
Poly(4-styrenesulfonic acid) (PS4) |
-44 |
-133 |
|
Sulfonated PEEK (sPK) |
-37 |
-110 |
|
Hyaluronic acid (HLA) |
-37 |
-113 |
|
Polyvinylpyrrolidone 360 (PVP) |
-52 |
-158 |
|
Poly(vinyl alcohol) 89–98 (PV1) |
-52 |
-155 |
|
Poly(propylene glycol) (PPG) |
-36 |
-111 |
|
Poly(ethylene glycol) 3550 (PG3) |
-58 |
-169 |
|
Poly(ethylene glycol) 8000 (PG8) |
-58 |
-170 |
|
Poly(ethylene glycol) 20000 (PG2) |
-55 |
-164 |
|
Poly(methyl vinyl ether) (PVM) |
-25 |
-76 |
|
TWEEN® 20 (T20) |
-43 |
-131 |
|
TWEEN® 80 (T80) |
-44 |
-132 |
|
Pluronic® F-108 (F18) |
-31 |
-94 |
|
Brij® 58 (B58) |
-39 |
-118 |
|
Brij® 35 (B35) |
-36 |
-112 |
3.4. Modified finite bath experiments
Screening of putative antifouling agents based on the effect of different coating on biomass deposition onto custom created dextran DEAE surface can be performed using modified simple partition tests, which were reported earlier and well suited for such applications [4, 13, 24]. DEAE-ligands are known to strongly interact with microbial cells and this property has lead us to generate a DEAE-modified surface to screen antifouling polymer. Partitioning tests are cautiously designed to include a broad range of biomass and polymer interaction pairs. In such experiments, cell deposition to polystyrene surface was less than 10%, based on cell partition index values. Experiments were implemented in 20 mM phosphate buffer with pH 7.4. Contact time was fixed to 30 minutes so as to mimic the process condition to the maximum residence time of the biomass in standard chromatographic runs. If a polymer can show the antifouling property with DEAE, then it poses a higher probability of working on other ligands having lesser cell interaction challenges in expanded bed chromatography. Microbial surfaces are mostly anionic in nature, mainly due to the presence of negatively charged chemical groups like phosphate, carboxylate, and sulfate moieties. Due to the presence of S-layer proteins, amphipathic polymers, and lipids cell envelope can also exert hydrophobic interaction [4]. These properties are unique to each cell type [11, 25] and sometimes the age of the culture also influences such surface properties[35]. Indeed, the naked DEAE surface showed high cell deposition; CPI values were 0.41 for yeast cells and 0.48 for CHO cells. At the control level, CHO cell clearly showed strong interaction with DEAE surface in comparison to yeast cells. Coating of DEAE surface with polymers modified the cell deposition values depending on the polymeric property. Partition test results for yeast indicated that CPI values increased in the presence of all the polymer listed. However, poly(vinyl sulfonic acid), poly(methacrylic acid), poly(4-styrenesulfonic acid) showed the highest CPI increase to 0.54, 0.53, 0.52 respectively and the lowest being TWEEN® 20, Brij® 35, hyaluronic acid with CPI values of 0.43, 0.41and 0.41. Poly(methacrylic acid), polyacrylic acid and poly(vinyl sulfate) showed the highest cell repellence with CPI values of ~ 0.58 and poly(ethylene glycol) 8000, poly(4-styrenesulfonic acid) and poly(ethylene glycol) 20,000 showed the least CPI values of 0.48, which is comparable to naked CPI values. Lowest CPI valued polymers for both CHO and yeast cells mostly failed to avoid cell attachment.
From the previously published literature, it has been well established that xDLVO calculations serve as a valuable tool in understanding biomass adhesion studies. By correlating xDLVO interaction energy with experimentally determined partition values and by using the previously published results as benchmarking to shortlist the potential polymer with cell repellence property enabled us to spot the right candidate using different indicators. In this study, we used polyvinylpyrrolidone 360 as a benchmarking polymer to divide the polymer. The region with green shadow is categorized as safe polymers for further testing. The rationale behind such categorization is that PVP coated anion exchangers could successfully repel yeast cells [4]. However, PVP failed to repel CHO cells in process condition (Unpublished work). The polymer is having interaction energy less than PVP and CPI value higher than PVP in respective biomass types, have a better chance to screen for the best polymer for further studies. Based on this assumption we have observed that PMA, PAA, and PVS are the top three polymers having CPI values higher than PVP and interaction energy less than PVP for CHO cells. PSS, PMA, and PS4 listed as top polymers having better values than PVP for yeast cells. By observing the spread created by CPI and kT values of CHO and yeast cells in Fig. 2, CHO cells showed more interaction with polymers regarding both CPI values and kT values, and they are spread across the plot and have a better correlation with kT and CPI. In the case of yeast cells, the spread is comparably narrow, and CPI and kT correlation are not linear.
The interaction energy as a function of biomass type and adsorbent surface in the feedstock can be observed in Fig. 3. The interaction energy calculation performed for yeast and CHO cell suggest that both cell types interact strongly with DEAE-dextran and top three antifouling polymer surface. This figure helps us to understand the impact of particle size on overall energy vs. distance profile. Lin et al. have recognized the significance of biological particle size, besides the evident electrostatic effects between two opposite charged spheres, during biomass interactions in EBA [36]. Interaction energy vs. distance profile for polymers clearly corroborate the CPI results and present reduction in interaction energy with the cell.
The polymer coating of the support or adsorbents were already performed previously and showed positive results in reducing the impact of fouling. Shortlisted polymers for both yeast and CHO cells are PSA, PMA, PS4, PAA, PMA and PVS. All these polymers have a negative charge on the surface. The thin layered polymer coating on to DEAE surface may be formed due to the electrostatic interaction, this, in turn, modifies the outer surface charge. Some of the polymers we shortlisted have found their application as antifouling agents in other fields including membrane application. PAA has been coated on anion exchanger to reduce fouling in EBA process [6], PAA brushes have resisted the attachment of RBL mast cells [37]. Coating of PAA and PVS reduced fouling in micro and nanofiltration application [14]
Ultimately, shortlisted polymers have to be tested for its cell repellence property by coating on commercial EBA adsorbent. For this purpose, we chose Fastline DEAE adsorbent and yeast cells, and random polymer from the polymer library tested as it houses similar ligand on an agarose gel. Experimental conditions were similar to that of the microplate method. In the end, the effect of polymer coated was visually observed under a microscope, and naked adsorbent showed a strong interaction and aggregation of yeast cells on the adsorbent surface. For Brij® 35 (B35) coated adsorbents, the degree of cell adhesion was lesser than the naked ones but not significant. On PVP coated adsorbents there was very low interaction observed between the yeast cell and adsorbent. PVS, PMA, and PAA showed a significant reduction in cell interaction, in turn, this allows the free ligands to interact with target proteins.
This work presents a robust, simple and efficient method to study cell deposition. Microplate surfaces were modified by coating the wells with PGMA, and subsequently, the epoxy group was coupled with DEAE-dextran to mimic chromatographic adsorbent in microplate arrangement. Several chemical additives were evaluated for their capacity to reduce cell deposition. Surface properties of the polymers were characterized, and xDLVO calculation performed to assess the interaction between polymer surface and cell (yeast and CHO). Polymer coating substantially reduces the interaction with suspended cells, and this hypothesis is supported by cell deposition experiment, microscopic observation, and xDLVO calculation. The surface energies data for various polymers generated in this work can be used to perform a xDLVO calculation to understand the fouling caused due to direct contact with different types of biomass and different process condition. From our previous experience, some polymers having antifouling properties work very well in membrane system but fail to perform in EBA system, and this might be due to aggregation of the coated adsorbents. For this reason, current results need to be investigated further to evaluate its effects on protein binding capacity and bed hydrodynamics for application EBA.
AIBN: azo-iso-butyrodinitrile
CHO: Chinese hamster ovary
CPI: Cell partition index
DEAE: Diethylaminoethyl
DED: DEAE-Dextran hydrochloride
DLVO: Derjaguin, Landau, Verwey, and Overbeek theory
DMSO: Dimethylsulfoxide
DSP: Downstream processing
EBA: Expanded bed adsorption
EL: Electrostatic
FTIR: Fourier transforms infrared
GMA: Glycidyl methacrylate
HLA: Hyaluronic acid
LW: Lifshitz-Van der Waals
mABs: monoclonal antibodies
PAA: Polyacrylic Acid
pDNA: plasmid DNA
PG2: poly (ethylene glycol)
PMA: poly (methacrylic acid)
PPG: poly (propylene glycol)
PS: Polystyrene
PS4: poly (4-styrenesulfonic acid)
PSS: poly (vinyl sulfonic acid)
PV1: poly (vinyl alcohol)
PVP: Polyvinylpyrrolidone
PVS: poly (vinyl sulfate)
PVM: poly (methyl vinyl ether)
sPK: Sulfonated PEEK
Saccharomyces cerevisiae: S. cerevisiae
VLPs: virus-like particles
xDLVO: Extended Derjaguin, Landau, Verwey, Overbeek
Ethics approval and consent to participate
No animal or human subjects were used in this work.
Consent for publication
This manuscript does not contain any individual person’s data.
Availability of data and materials
All data are fully available without restriction.
Competing interests
Authors declare that they have no competing interests.
Funding
Partial support for this study was provided from INTENSO PROJECT, European Union Seventh Framework Programme (FP7/2013–2017) under Grant agreement no. 312004 and Project NANOZYME, BMBF – EuroTransBio-9 (ETB-9) no. 031B0017C, Project NANOFACIL, BMBF under grant no. ZF4337203AJ8, and Jacobs University Bremen.
Authors’ contributions
VY, MK, RND designed the work. MK, VY carried out the experiment. VY, MK, RND, and MFL analyzed the data and contributed to the statistical analysis. VY, MK, RND and MFL wrote the manuscript and reviewed the manuscript critically. All the authors have read the article and approved the final manuscript.
Acknowledgment
Support for this study was provided from Intenso project by European Union Seventh Framework Programme Project NANOFACIL, NANOFACIL, BMBF and Jacobs University Bremen.
- Lonza, Microbial Biopharmaceutical Services Your Destination Is Our Goal, 2012, Lonza Inc. p. 8.
- Douwenga, R., A. D'Avino, and G. Zijlstra, Improving Productivity in Bioreactors. Genetic Engineering & Biotechnology News, 2010. 30(7): p. 36-38.
- DSouza, R.N., et al., Emerging technologies for the integration and intensification of downstream bioprocesses. Pharmaceutical Bioprocessing, 2013. 1(5): p. 423-440.
- Vennapusa, R.R. and M. Fernandez-Lahore, Effect of chemical additives on biomass deposition onto beaded adsorbents. Journal of Bioscience and Bioengineering, 2010. 110(5): p. 564-571.
- Kakarla, P.B., et al., Interactions of Chinese Hamster Ovary (CHO) cell cultures with second generation expanded bed adsorbents. Separation and Purification Technology, 2015. 144: p. 23-30.
- Dainiak, M.B., I.Y. Galaev, and B. Mattiasson, Polyelectrolyte-coated ion exchangers for cell-resistant expanded bed adsorption. Biotechnol Prog, 2002. 18(4): p. 815-20.
- Stepanović, S., et al., A modified microtiter-plate test for quantification of staphylococcal biofilm formation. Journal of Microbiological Methods, 2000. 40(2): p. 175-179.
- Eckert, A.W., D. Grobe, and U. Rothe, Surface-modification of polystyrene-microtitre plates via grafting of glycidylmethacrylate and coating of poly-glycidylmethacrylate. Biomaterials, 2000. 21(5): p. 441-7.
- Winstein, S. and R.B. Henderson, The role of neighboring groups in replacement reactions. VII. The methoxyl group. Journal of the American Chemical Society, 1943. 65(11): p. 2196-2200.
- Stone, M.C. and G. Carta, Protein adsorption and transport in agarose and dextran-grafted agarose media for ion exchange chromatography. Journal of Chromatography A, 2007. 1146(2): p. 202-215.
- Vennapusa, R.R., Surface energetics of adsorbent-biomass interactions during expanded bed chromatography : implications for process performance, 2008.
- Fernández Lahore, M., et al., Expanded Bed Chromatography, Surface Energetics of Biomass Deposition, in Encyclopedia of Industrial Biotechnology2009, John Wiley & Sons, Inc.
- Lin, D.Q., et al., Minimising biomass/adsorbent interactions in expanded bed adsorption processes: a methodological design approach. Bioseparation, 2001. 10(1-3): p. 7-19.
- Ba, C., D.A. Ladner, and J. Economy, Using polyelectrolyte coatings to improve fouling resistance of a positively charged nanofiltration membrane. Journal of Membrane Science, 2010. 347(1–2): p. 250-259.
- Wang, J.W., et al., Preparation of polyelectrolyte multilayer films consisting of sulfonated poly (ether ether ketone) alternating with selected anionic layers. Journal of Membrane Science, 2009. 337(1-2): p. 200-207.
- Yelemane, V., M. Kangwa, and M. Fernández-Lahore, High-Throughput Screening of Cell Repellent Substrate Chemistry for Application in Expanded Bed Adsorption Chromatography, in Biotechnology and Biochemical Engineering: Select Proceedings of ICACE 2015, P. B. D, N.S. Gummadi, and V.P. Vadlani, Editors. 2016, Springer Singapore: Singapore. p. 145-152.
- scientific, H. Zeta Potential of Polyelectrolytes.
- Ottewill, R.H. and J.N. Shaw, Electrophoretic studies on polystyrene latices. Journal of Electroanalytical Chemistry and Interfacial Electrochemistry, 1972. 37(1): p. 133-142.
- van Oss, C.J., Interfacial Forces in Aqueous Media. 2nd ed2006, Boca Raton: Taylor & Francis.
- Vennapusa, R., et al., Assessing adsorbent-biomass interactions during expanded bed adsorption onto ion exchangers utilizing surface energetics. Journal of Chromatography A, 2008. 1181(1-2): p. 9-20.
- Vennapusa, R.R., et al., Surface Energetics to Assess Biomass Attachment onto Immobilized Metal-ion Chromatography Adsorbents in Expanded Beds. Biotechnology and Bioprocess Engineering, 2009. 14(4): p. 419-428.
- Vennapusa, R.R., et al., Surface energetics to assess biomass attachment onto hydrophobic interaction adsorbents in expanded beds. Biochemical Engineering Journal, 2009. 43(1): p. 16-26.
- Vennapusa, R.R., et al., Biomass-Adsorbent Adhesion Forces as an Useful Indicator of Performance in Expanded Beds. Separation Science and Technology, 2010. 45(15): p. 2235-2244.
- Fernandez-Lahore, H.M., et al., The influence of cell adsorbent interactions on protein adsorption in expanded beds. Journal of Chromatography A, 2000. 873(2): p. 195-208.
- Kakarla, P.B., Radical Optimization of Expanded Bed Chromatography by the Implementation of an Interaction Energy Predictive Framework, 2016.
- Švec, F. and A. Jehličková, Reactive polymers, XXXIX. Synthesis of copolymers of glycidyl methacrylate-ethylene dimethacrylate with aminopyridines and their sorption properties. Die Angewandte Makromolekulare Chemie, 1981. 99(1): p. 11-22.
- Murugan, R. and S. Ramakrishna, Modification of demineralized bone matrix by a chemical route. Journal of Materials Chemistry, 2004. 14(13): p. 2041-2045.
- Singh, N.K., et al., Preparation and characterization of grafted cellulosic fibers and their applications in protein purification. Separation and Purification Technology, 2015. 143: p. 177-183.
- Bos, R., H.C. van der Mei, and H.J. Busscher, Physico-chemistry of initial microbial adhesive interactions – its mechanisms and methods for study. FEMS Microbiology Reviews, 1999. 23(2): p. 179-230.
- van Oss, C.J., Interfacial Forces in Aqueous Media, Second Edition2006: CRC Press.
- Kirby, B.J. and E.F. Hasselbrink, Jr., Zeta potential of microfluidic substrates: 1. Theory, experimental techniques, and effects on separations. Electrophoresis, 2004. 25(2): p. 187-202.
- Lin, D.-Q., L.-N. Zhong, and S.-J. Yao, Zeta potential as a diagnostic tool to evaluate the biomass electrostatic adhesion during ion-exchange expanded bed application. Biotechnology and Bioengineering, 2006. 95(1): p. 185-191.
- Dainiak, M.B., I.Y. Galaev, and B. Mattiasson, Direct capture of product from fermentation broth using a cell-repelling ion exchanger. Journal of Chromatography A, 2002. 942(1-2): p. 123-31.
- Arpanaei, A., et al., Surface modification of chromatography adsorbents by low temperature low pressure plasma. Journal of Chromatography A, 2010. 1217(44): p. 6905-6916.
- Naz, N., et al., Growth-dependent surface characteristics of Hansenula Polymorpha: implications for expanded bed adsorption chromatography. Biotechnology and Bioprocess Engineering, 2015. 20(3): p. 576-584.
- Lin, D.Q., et al., Biomass/Adsorbent electrostatic interactions in expanded bed adsorption: A zeta potential study. Biotechnology and Bioengineering, 2003. 83(2): p. 149-157.
- Chiang, E.N., et al., Cellular Responses to Patterned Poly(acrylic acid) Brushes. Langmuir, 2011. 27(11): p. 7016-7023.