Wnt1-cre mediated DOT1L deficiency decreases transcription of dorsal progenitor marker genes during neurogenesis in the spinal cord
A previous report proposed that H3K79me2 deposition impacts on spinal cord development and associates with pathologies including spina bifida (43). To current knowledge, DOT1L is the main methyltransferase targeting H3K79 (45). As the expression of Dot1l was previously not described over the course of mouse spinal cord development, we studied the expression of Dot1l throughout spinal cord neurogenesis, which occurs during E9.5 to E13.5. Using ISH, we observed transcription of Dot1l at all stages (Figure S1A). Signal intensity appeared stronger in the progenitor zone compared to the mantle zone. qRTPCR corroborated Dot1l expression at all stages examined. Compared to E9.5, which we set as baseline, Dot1l transcription increased significantly at E11.5 and E12.5 in the developing mouse spinal cord (Figure 1A). Both time points are characterized by progenitor proliferation and generation of interneurons (6,9). This expression dynamic suggested that Dot1l might regulate neurogenesis during spinal cord development, as we observed also in other brain regions (55,57). Likewise, we studied DOT1L transcription in the developing chicken spinal cord. In chicken embryos, DOT1L expression was tested at three developmental stages (Hamilton Hamburger (HH) stages 11, 13+ and 16 comparable to murine E9.0, E9.5 and E10.0). Comparing DOT1L expression at HH13+ and HH16 to HH11, we observed increased transcript levels over time (Figure S1B).
To investigate the function of DOT1L during spinal cord development, we generated a transgenic mouse line by crossing floxed Dot1l with a Wnt1-Cre driver line, which is active in the developing spinal cord (59). To assess the extent of Cre expression and its suggested activity towards inactivation of DOT1L in the conditional mouse mutant (Dot1l-cKO), we analyzed alteration of H3K79me2 patterns using immunostainings as a read-out for loss of DOT1L function. We focused our analyses on E12.5, where we observed highest levels of DOT1L expression, and on the lumbar spinal cord, where NTD like spina bifida are observable. In accordance with wide-spread transcription of Dot1l during spinal cord development (Figure S1A), H3K79me2 staining was uniformly observed in the entire lumbar area of control animals (Figure 1B). In contrast, Dot1l-cKO littermates presented reduction of the H3K79me2 immunostaining mostly in dorsal areas, spanning the ventricular to the mantle zone (Figure 1B). H3K79me2 was less homogenous in ventral regions in Dot1l-cKO than in control animals, suggesting either cell-specific cre-activity in ventral cells as well and/or dorsally derived Dot1l-cKO cell that intermingled with ventral cells not expressing cre. We visualized cre-activity by using a GFP-reporter allele (Figure S2A). Apparently, the GFP signal was detected in many cells along the dorsoventral and mediolateral axis of the spinal cord. The pattern suggested slightly stronger staining in dorsal regions compared to a scattered appearance of GFP-positive nuclei in the ventral domain. Stronger GFP staining in dorsal regions correlated with less intense H3K79me2 staining. We concluded that Wnt1-cre mediated DOT1L-deficiency might mostly affect dorsal but also ventral cell populations in lumbar areas of the spinal cord. We did not observe NTD in Wnt1-cre mediated Dot1l-cKO embryos at any time point during neurogenesis (Figure S1C), notwithstanding the indications that altered levels of H3K79me2 associate with closure defects of the neural tube in humans (43) and pharmacological inhibition of DOT1L increased occurrence of NTD in chicken (Figure S1D, E).
DOT1L-mediated histone methylation correlates with regulation of gene expression (52,68). In continuation of our initial expression analysis of Dot1L-cKO in lumbar spinal cords, we isolated tissue from this region from E12.5 control and Dot1l-cKO littermates and performed RNA-seq. In total, we detected 864 transcripts with increased and 647 with decreased expression, applying a cutoff for adjusted p-value below 0.05 (Figure 1C). A GO enrichment analysis of genes that increased upon loss of Dot1l indicated that neuronal differentiation was a process significantly affected in mutant spinal cords. In contrast, genes that decreased upon Dot1l-cKO associated amongst others with cell division (Figure 1D). We analyzed whether altered gene expression correlated with specific progenitor domains or stem cell classes by intersecting this RNA-seq data characterizing Dot1l-cKO with genes that were differentially expressed in spinal cord progenitor domains as revealed by single cell RNA-seq (69). Clustering of differentially expressed genes (DEG) after Dot1l-cKO confirmed decreased expression of genes active in progenitors (e.g. Pax3, Bmpr1b, Gli3, Jag1, Zic1), whereas expression of genes involved in differentiation (e.g. Npy, Mafb, Lmx1b, Slc6a11) increased upon loss of Dot1l (Figure 1E). Further, this intersection of the DEG after Dot1l-cKO with the single cell RNA-seq data allowed assessing whether specific expression domains, i.e. dorsal or ventral progenitor populations, were affected through Dot1l deficiency. This analysis of the intersected DEG revealed that upon Dot1l-cKO expression of genes characteristic for dorsal progenitor populations decreased (Figure 1E, e.g. Pax3, Bmpr1b). We also observed a fraction of genes with increased expression that are characteristic for ventral genes (Figure 1E, e.g. Mafb, Lmo1, Grrp1). We also analyzed the RNA-seq data set of Dot1l-cKO for specific marker genes and found significantly decreased expression of Lhx2 and Isl1, marking a dI1 and dI3 subpopulation, respectively. The dI5 interneuron marker Lmx1b significantly increased in expression upon Dot1l-cKO (Figure 1F).
Altogether, our observations from the Dot1l-cKO spinal cord indicated that 1) neuronal differentiation of spinal cord progenitors might be increased compared to wild type littermates, and 2) that mainly the generation of dorsal postmitotic interneurons of different subclasses might be altered.
DOT1L deficiency reduces expression of interneuron markers in the dorsal spinal cord
To describe DOT1L function with regard to postmitotic interneurons in the spinal cord, we characterized the Dot1l-cKO phenotype at later developmental stages. The Dot1l-cKO was lethal in early postnatal stages (Figure S2B), therefore we analyzed the phenotype at E18.5 as the most mature stage. Nissl staining of E18.5 lumbar areas revealed decreased histological staining intensity of the spinal cords for the Dot1l-cKO compared to controls (Figure 2A). Pyknotic nuclei were identified in seemingly higher frequency in mutants compared to controls, mostly concentrated in Rexed lamina VII (Figure 2A’, A’’), supporting the interpretation that less intense staining might be a consequence of increased cell death. Increased numbers of apoptotic cells at E18.5, but not at earlier developmental stages, were confirmed by immunostaining for cleaved CASP3 and through quantification of pyknotic nuclei (Figure S3A-I).
As inhibitory interneurons are the most represented cell type in the spinal cord, we used in situ hybridization (ISH) for Gad65 to assess generally the patterning and organization of the spinal cord (Figure 2B). We observed altered expression patterns of Gad65 within the same area presenting evident cell depletion (Figures 2A, S3A) in Dot1l-cKO compared to controls (Figure 2B’, B’’). Gad65-expressing inhibitory interneurons lost their salt-and-pepper patterning within the lumbar area upon Dot1l-cKO, but rather appeared in cell clusters with more or less intense staining. This altered expression pattern at E18.5 in Dot1l-cKO supported our hypothesis, based on transcriptional changes, that DOT1L might be necessary for proper interneuron differentiation of various subtypes. Further, these results suggested that derailed interneuron differentiation and positioning might cause increased rates of dying cells in later, i.e. E18.5, compared to earlier, i.e. E11.5-E13.5, developmental stages.
To characterize subpopulations of interneurons at earlier stages, we analyzed Gad65, Lhx5 and Reln expression at E13.5, at the end of neurogenesis. At E13.5 Gad65 expression defines functionally the emerging classes of dI4, dI6, V1 and V2b inhibitory interneurons (69). Dot1l-cKO produced a reduction of Gad65-transcripts in the dorsal mantle area compared to control littermates (Figure 2C, C’ and C’’ respectively control and Dot1l-cKO). Lhx5 molecularly defines dI2, dI4, dILA, dI6, V0 and V1 (17). Lhx5-expressing cells distributed similarly as Gad65-expressing cells, with decreased signal intensity in the dorsal mantle zone of mutant compared to control embryos (Figure 2D, D’, D’’). Reln transcription marks V1 and V2 interneurons (70,71). Dot1l-cKO spinal cords showed ectopic expression of Reln in dorsal areas (Figure 2E, E’, E’’). Altogether, expression analysis of broadly expressed interneuron markers suggested either that interneuron populations from dorsally located progenitors decreased in Dot1l-cKO or that they migrated ventrally. In contrast to this observation, the results suggested that Reln-expressing ventral interneurons might have invaded from ventral into the dorsal area or that Reln was ectopically expressed.
DOT1L is necessary for proper localization of dorsal and ventral interneuron populations
To investigate the development of different interneuron classes upon Dot1l-cKO in greater detail, we first assessed cell proliferation at E11.5 using immunofluorescence of the general cell cycle marker KI67 together with BRN3A, which demarcated multiple dorsal differentiating neuronal populations (dI1-3, dI5 and dILB) (Figure 3A). Both markers did not reveal obvious differences between Dot1l-cKO and control animals. Similarly, a comparable fraction of progenitor cells in the ventricular zone was observed using immunostainings against SOX2 (Figure S2C). We labeled cycling progenitors with a 30 minutes EdU pulse and quantified cells that incorporated EdU. We observed a significant dorsoventral shift of EdU-positive cells in the lower dorsal area of mutant compared to control littermates, despite unchanged total numbers of EdU-positive cells (Figure 3B, D, G). EdU-positive cells populated a large dorsal domain that extended into the mantle zone suggesting accelerated exit from the cell cycle and differentiation of dorsal interneurons. OLIG3-expressing dorsal progenitors dp1-2-3 and early postmitotic interneurons dI1-2-3 (8) also displaced from the ventricular zone at E11.5, and the OLIG3-expression domain extended towards the mantle zone (Figure 3C). This dorsal OLIG3-expressing progenitor and early postmitotic cell population did not change in total number between genotypes (Figure 3H). We therefore concluded that Dot1l-cKO affected migration and differentiation of specific dorsal interneuron populations rather than proliferation of progenitors residing in the dorsal ventricular zone.
Ventral postmitotic interneurons express Olig3 as well (72). Analysis of OLIG3-expressing cells in the ventral domain (Figure 3C, F) indicated a slight shift along the dorsoventral axis and increased ventral density upon loss of DOT1L. Similar to the dorsal, we did not observe a significant change in cell numbers in the ventral OLIG3 population (Figure 3H-I). We concluded that loss of DOT1L affected distribution and hence early migration mainly but not exclusively of dorsal OLIG3 interneuron subpopulations. This observation was also in accordance to stable transcriptional levels of Olig3 upon Dot1l-cKO (Figure 1F). OLIG3 expression is an early hallmark of dI1-2-3 populations. Therefore, we further characterized systematically these dorsal interneuron populations with regard to marker gene expressions and their quantitative or qualitative changes.
DOT1L deficiency reduces numbers of LHX2- and shifts LHX9-expressing dI1 interneurons to a lateroventral position
The dorsal-most interneuron class, dI1, is characterized by expression of Lhx2 and Lhx9. Expression of both markers changes dynamically throughout neurogenesis. From a shared pool of progenitors, two subpopulations emerge based on the proportion of Lhx2 and Lhx9 transcripts: ventromedially located interneurons express highly LHX2 and to a lesser extend LHX9, whereas a ventrolateral counterpart expresses highly LHX9 but not LHX2 (73). Intersection of DEG upon Dot1l-cKO with the genes having characteristic expression in specific domains of the spinal cord (69) revealed that Lhx2 was present in the intersected genes and decreased in transcription upon loss of DOT1L as revealed by RNA-seq (Figures 1F, S5A). Lhx9 transcript was not differentially expressed in Dot1l-cKO embryos. Based on this observation, we analyzed separately the subsets of the dI1 population using immunostainings. At E11.5, the LHX2-positive subpopulation was significantly reduced upon loss of DOT1L, particularly in its ventral-most subset, whereas control littermates consistently displayed cells in a continuous migratory stream towards the intermediate ventral area (Figure 4A, C, E). The quantification of the LHX9-expressing subpopulation revealed that the decreased number of LHX2-expressing dI1 precursors was not accompanied by a significant concurrent decrease or a compensatory increase in cells expressing LHX9 (Figure 4B, D, F). Although Dot1l-cKO did not change the LHX9-expressing subpopulation quantitatively compared to controls, the distribution of these interneurons was more restricted on the mediolateral axis. Furthermore, LHX9-positive dI1 interneurons distributed with a significantly increased density in the mediolateral spinal cord (Figure 4D). This area is the target region of ipsilaterally projecting dI1 interneurons highly expressing LHX9 (73).
Further on in development at E12.5, the total cell number of LHX2-expressing dI1 cells was still reduced in Dot1l-cKO (Figure 5A, E). Mostly the cell population in ventral positions contributed to the quantitative differences (Figure 5C). We did not observe an evident increase in cell death that could account for the quantitative differences (Figure S3C-H). In further accordance to our observation at E11.5, the LHX9 dI1 cells did not change significantly in cell numbers in mutant compared to controls at E12.5 (Figure 5B, F). However, the LHX9 dI1 subpopulation accumulated significantly denser at mediolateral positions, similar to the earlier developmental stage (Figure 5D). In summary, the two dI1 subpopulations behaved differently upon Dot1l-cKO, as the LHX2-positive subset decreased upon cKO while LHX9 cells were unaffected in numbers but occupied majorly and more densely their target area. These results were in line with the transcriptomic observations of a selective decrease of Lhx2 expression without differential expression of Lhx9, suggesting that the LHX2-expressing subset depends on DOT1L presence for its identifier marker expression and molecular identity. On the other hand, DOT1L affects proper localization of the LHX9-expressing subset.
DOT1L affects localization of dI2 interneurons
Similarly to dI1, the dI2 subclass initially expresses OLIG3 and migrates to ventral positions (74). We performed a staining for FOXD3, marking both dI2 and V1 domains at E11.5 (Figure 6A) and E12.5 (Figure 6B). We did not observe significant alterations in cell numbers or variation in distribution for FOXD3-expressing dI2 interneurons at E11.5 (Figure 6C, E). At E12.5, we co-stained for FOXD3 and BRN3A to detect the entire dI2 population (Figure 6B), since migrating dI2 interneurons temporarily lose BRN3A and maintain FOXD3 expression, but they re-express BRN3A when reaching their target medial area. At this later stage, FOXD3 cells presented a dorsoventral position shift upon Dot1l-cKO (Figure 6D), despite cell numbers that were similar compared to control littermates (Figure 6F). Indeed, the ventral area, which is the final destination of this neuronal subpopulation, was populated by fewer dI2 interneurons in mutants compared to controls (Figure 6D), suggesting a migratory delay for the overall dI2 pool in the Dot1l-cKO in comparison to control littermates. Together these experiments showed a role of DOT1L in the development and differentiation of dI2 interneurons, upon which DOT1L influenced most likely their migration.
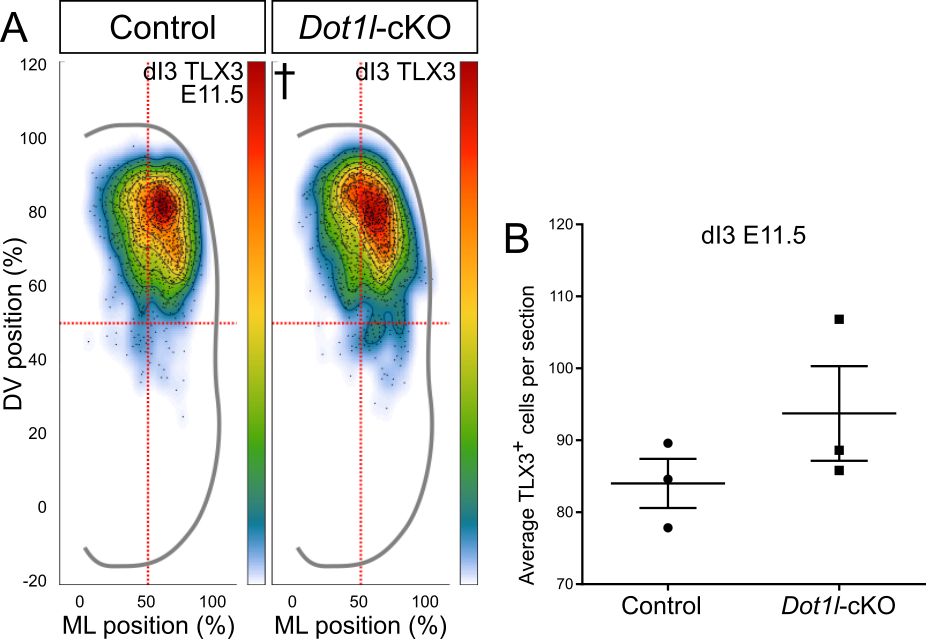
DOT1L deficiency shifts dI3 interneurons to ventral positions during the course of development
The third dorsal class marked by OLIG3 is dI3, a subpopulation that shares excitatory fate with the more ventrally localized dI5 interneurons (75,76). Both dI3 and dI5 excitatory interneurons express TLX3 as fate determinant. dI3 and dI5 interneurons use different migratory paths, where dI3 migrates ventrally, while dI5 settles in the dorsal horn (2). To track the two populations we co-stained lumbar sections at E11.5 for TLX3 and LMX1B (Figure 7A) and quantified on the basis of TLX3-single (dI3) or TLX3/LMX1B-co-expressing (dI5) cells. The dI3 cell population showed neither statistically significant positional nor quantitative changes in mutant littermates compared to control animals at E11.5 (Figure S4A, B). At E12.5, we studied the development of dI3 through immunostaining of ISL1/2 cells, labeling dI3 and MN (Figure 7B). Whereas the total cell numbers were unchanged (Figure 7F), the dI3 populations differed among conditions in their distribution (Figure 7D). In control littermates, dI3 interneurons appeared as one uniform and intermediate population in the dorsal mantle zone. Conversely, the region populated by dI3 interneurons in Dot1l-cKO split into two hotspot regions. These results supported the conclusion that early dI3 interneurons do not contribute to the shift in the OLIG3 pool upon Dot1l-cKO, but that at later stages dI3 interneuron migration is altered by loss of DOT1L.
DOT1L deficiency shifts dI5 interneurons to dorsal positions
At E11.5, distributional analysis of cells co-expressing TLX3 and LMX1B highlighted increased density of dI5 cells in the dorsal area, towards the developing dorsal horn upon Dot1l-cKO (Figure 7C). This observation suggested that dI5 excitatory interneurons would reach their respective target region earlier upon DOT1L deletion compared to control animals. In addition, we observed that the quantitative changes upon DOT1L deletion were close to significance which might point towards increased numbers of cells expressing LMX1B (Figure 7E). To get further evidence corroborating a putative quantitative change in dI5 cells, we inspected intersected DEG upon Dot1l-cKO from the RNA-seq analysis with domain-specific differentiation genes, two datasets that were generated at the slightly later stage E12.5 (Figures 1F, S5A). We observed that Lmx1b transcription increased upon loss of DOT1L (adjusted p-value below 0.005, log2FC of 0.315). Similarly, the transcript for Phox2a, which is a known marker for a subset of dI5 interneurons (77), increased significantly in Dot1l-cKO samples (adjusted p-value below 0.05, log2FC of 0.377). Together, increased levels of Lmx1b and Phox2a supported the view that dI5 subpopulations might be expanded in mutant compared to control littermates. To describe the dI5 subpopulation at E12.5, we performed immunostainings for LMX1B excitatory interneurons (Figure 7G). In contrast to the increased transcription of Lmx1b within the E12.5 transcriptome, no evident phenotype upon DOT1L depletion was detected using immunostainings at E12.5. We concluded that the dI5 subpopulation of interneurons might not be disturbed in generation and localization upon Dot1l-cKO.
DOT1L does not affect development of dI4 interneurons
The expression of the general inhibitory interneuron marker Gad65 at E13.5 suggested a reduction of inhibitory interneurons, which derive from the dI4 subclass (6,69) in the dorsal horn (Figure 2C). We therefore performed immunostainings at E12.5 for LBX1 to further characterize dI4 and dI6 interneuron domains (LBX1 single-labeled) flanking dI5 (co-labeled for LMX1B and LBX1 in Figure 7G). In addition, we also assessed PAX2 expression to study the development of dI4 and dI6 towards their inhibitory fate (Figure 7H). Although we observed at E13.5 a less intense staining pattern for Gad65 and Lhx5 inhibitory interneurons (Figure 2C, D) we could not identify a marked phenotype on E12.5 of the inhibitory dI4 subpopulation in the developing dorsal horn upon DOT1L deletion.
DOT1L deficiency shifts EVX1-expressing V0 interneurons to a mediolateral position
As our analysis of the OLIG3-expressing progenitors at E11.5 suggested that V0 interneurons could also be affected by loss of DOT1L, we used EVX1 expression as further marker for a subset (V0V and V0CG) of V0 interneurons (Figure 8A) (78,79). We did not detect changes in cell number at E12.5 (Figure 8C), but a slight mediolateral shift in the position of the expression domain coupled with a more homogeneous cell density distribution in Dot1l-deficient compared to control littermates (Figure 8B). We therefore concluded that the V0 subpopulation did not contribute to the denser distribution of OLIG3-expressing progenitors in the ventral spinal cord at E11.5 (Figure 3F). However Dot1l-cKO affected the localization of the V0 population, which presented an altered migration towards the ventral positions, where the mutant cells occupied lateral domains within the migratory path compared to control interneurons. This distribution of the V0 cells suggested to us that loss of DOT1L delays generally V0 interneuron migration.
DOT1L deficiency mildly redistributes V1 interneurons in ventral areas
Due to the observed abnormal localization of Reln transcripts at E13.5 (Figure 2E), we also investigated V1 interneuron development and positioning. At E11.5, cells expressing FOXD3 in the ventral spinal cord did not show changes in the cell numbers (Figure 8F), but again we observed a significant shift in cell density in mutant compared to control littermates (Figures 6A, 8D), showing a less expanded domain populated by V1 interneurons in mutant littermates. The population size of single FOXD3-expressing ventral cells did not change as well at E12.5 (Figures 6B, 8E). Coherently with E11.5, V1 interneurons distributed in a less extended area in mutants compared to controls (Figure 8G). At the time points studied, V1 cells occupied a smaller area in mutant littermates, displaying migration delay based on cell position. We did not observe evidence of a derailed migration and population of V1 interneurons towards the developing dorsal horn, suggesting that the dorsally located cells ectopically expressed Reln in Dot1l-cKO animals .