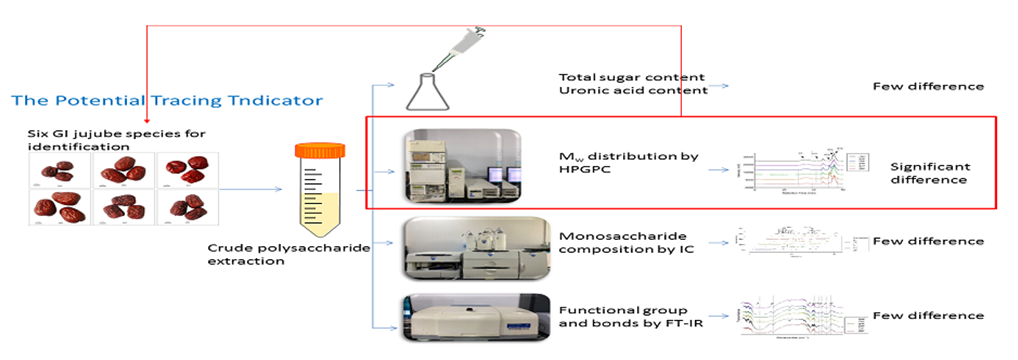
Total sugar and uronic acid contents analysis
The samples were processed according to 2.2, and glucose and galacturonic acide were used as standards for determination of total sugar and uronic acid content. As the result, total sugar content of the crude polysaccharides (ZBP, ZJP, ZTP, ZHP, ZYP, ZMP) were at range of 96%-99%, and 10%-23% uronic acid were found in each sample (Table 2).
Table 2 The purity and uronic acid content of crude polysaccharides in each sample
|
Codes
|
Total sugar content (Purity) %
|
Uronic acid content %
|
|
ZBP
|
97.5
|
11.9
|
|
ZJP
|
96.9
|
22.1
|
|
ZTP
|
96.1
|
15.0
|
|
ZHP
|
98.0
|
16.4
|
|
ZYP
|
98.0
|
19.5
|
|
ZMP
|
99.0
|
22.1
|
The states above showed that the purity varied within a very narrow band and presented no negative or positive correlation with uronic acid content. So the purity and uronic acid contents might not be the suitable tracing indicator at all.
Molecular weight (Mw) distribution analysis
Generally speaking, the molecular weight (Mw) distribution is an important bio-chemical parameter to characterize the homogeneity of species[19]. For the detection means, HPLC is generally used in Mw measurement. But in our study, the samples were treated as the description in 2.2 and Mw distribution were measured by HPGPC-RID method which is more sensitive than HPLC method for profiling Mw distribution.
Table 3 Mw distribution by HPGPC method and the RSD analysis
|
RT(min)
|
Peak area ratio/contents %
|
|
ZBP
|
ZJP
|
ZTP
|
ZHP
|
ZYP
|
ZMP
|
RSD
|
|
RT1 (34.7-35.6)
|
11.488
|
33.453
|
16.458
|
23.235
|
36.930
|
26.647
|
0.39
|
|
RT2 (41.0-44.0)
|
2.743
|
2.161
|
2.079
|
3.378
|
2.824
|
2.183
|
0.20
|
|
RT3 (50.6-50.7)
|
4.913
|
35.709
|
3.772
|
25.393
|
0
|
0.809
|
1.28
|
|
RT4 (52.6-52.8)
|
28.244
|
9.225
|
26.672
|
15.411
|
19.389
|
23.617
|
0.35
|
|
RT5 (53.9-54.0)
|
52.613
|
19.453
|
51.019
|
32.583
|
40.857
|
46.744
|
0.31
|
Note: For example, RT1 (34.7-35.6): retention time 1 (the peak time ranged from 34.7 to 35.6 min); RSD: relative standard deviation.
Table 4 The correlation analysis on polysaccharide contents of different Mw
|
|
RT1
|
RT2
|
RT3
|
RT4
|
RT5
|
|
RT1
|
Pearson correlation
|
1
|
-0.026
|
0.247
|
-0.714
|
-0.653
|
|
Significance
|
|
0.961
|
0.637
|
0.111
|
0.160
|
|
RT2
|
Pearson correlation
|
|
1
|
0.136
|
-0.145
|
-0.098
|
|
Significance
|
|
|
0.798
|
0.784
|
0.853
|
|
RT3
|
Pearson correlation
|
|
|
1
|
-0.851*
|
-0.895*
|
|
Significance
|
|
|
|
0.032
|
0.016
|
|
RT4
|
Pearson correlation
|
|
|
|
1
|
0.993**
|
|
Significance
|
|
|
|
|
0.000
|
|
RT5
|
Pearson correlation
|
|
|
|
|
1
|
|
Significance
|
|
|
|
|
|
Note: *P<0.05 significant,** P<0.01 highly significant.
As shown in Fig. 2 and details in table 3, five peaks represented different Mw at the range of 186646-285262 Da (RT1), 4634-17296 Da (RT2), 240-250 Da (RT3), 98-103 Da (RT4) and 57-64 Da (RT5). Obviously, the Mw of RT3, RT4 and RT5 belonged to the Mw of oligosaccharides or monosaccharides, but they still could be used as the tracing indicator if their distributions showed significant differences.
In HPGPC profiles, five peaks (RT1, RT2, RT3, RT4, RT5) were almost observed in 6 jujube species (only the peak of RT3 was absent in ZYP) and this might be due to the close relationship of 6 jujube species.
According to the RSD and correlation analysis (table 3 and 4), RT3 contents exhibited significant differences among 6 jujube species (RSD=1.28>1.00) and showed significant correlation with RT4 and RT5. RT3 contents was negatively correlated with RT4 and RT5 contents, while RT4 and RT5 showed a highly significant positive correlation.
Taken together, Mw distribution of 6 jujube species not only presented the homogeneity each other but also exhibited significant differences among 6 jujube species. Therefore, Mw might prove to be a potential tracing indicator among the 6 jujube species.
Monosaccharide composition analysis
Monosaccharide composition can be measured by the methods of HPLC-RID (high performance liquid chromatography), GC-MS (gas chromatography mass spectrometry) and IC (ion chromatography). Previous study showed that the uronic acid may not be detected with normal alkaline mobile phase by HPLC-RID method[20], and to our knowledge, up to 7 monosaccharides can be detected by GC-MS method[21].
At present, ion chromatography is an essential method for the determination of monosaccharides with the most types, without reducing uronic acid, simple sample treatment and high resolution. Normally more than 13 monosaccharide can be detected[18], and the uronic acid content can be determined without special derivatization reaction. Therefore, the ion chromatography was used to determine monosaccharide composition in this article.
Table 5 The contents of different monosaccharides in ZBP, ZJP, ZTP, ZHP, ZYP and ZMP
|
Monosaccharide content %
|
ZBP
|
ZJP
|
ZTP
|
ZHP
|
ZYP
|
ZMP
|
RSD
|
|
Fuc
|
|
|
|
|
|
|
|
|
GalN
|
|
|
|
|
|
|
|
|
Rha
|
2.5
|
2.5
|
1.8
|
1.9
|
2.5
|
1.9
|
16.0
|
|
Ara
|
7.1
|
12.6
|
9.5
|
9.9
|
14.9
|
12.5
|
25.0
|
|
GlcN
|
0.1
|
0.4
|
0.3
|
0.4
|
0.4
|
0.3
|
37.0
|
|
Gal
|
3.0
|
3.9
|
2.3
|
3.5
|
4.4
|
3.2
|
22.0
|
|
Glc
|
75.7
|
56.1
|
70.4
|
64.8
|
60.1
|
62.4
|
11.0
|
|
GlcNAc
|
|
|
|
|
|
|
|
|
Xyl
|
0.8
|
1.5
|
1.0
|
1.1
|
0.6
|
0.5
|
40.0
|
|
Man
|
0.7
|
1.0
|
0.8
|
1.0
|
1.1
|
0.8
|
17.0
|
|
Fru
|
|
|
|
|
|
|
|
|
Rib
|
|
|
|
|
|
|
|
|
GalA
|
10.1
|
20.1
|
14.0
|
17.4
|
16.0
|
18.4
|
22.0
|
|
GulA
|
|
|
|
|
|
|
|
|
GlcA
|
|
|
|
|
|
|
|
|
ManA
|
|
|
|
|
|
|
|
As shown in Fig. 3 and table 5, the same monosaccharide composition (Rha, Ara, GlcN, Gal, Glc, Xyl, Man, GalA) were detected in all polysaccharides by ion chromatography method. The polysaccharides from 6 jujube species were rich in glucose between 55%-75%, arabinose and galactose acid contents were almost at range of 10%-20%, while the other 5 monosaccharides were less than 5%.
Generally speaking, a relative standard deviation (RSD) greater than 1.0 indicates that most of the values in a set of data are significantly different from their mean. Therefore, the RSD of each monosaccharide content all less than 0.5 (table 4) indicating that the monosaccharide composition could not distinguish the 6 jujube species.
FT-IR spectrum analysis
The functional groups of jujube polysaccharide can be characterised by FT-IR spectrum[22, 23]. As shown in Fig. 4 and table 6, the functional groups and chemical bonds of crude polysaccharides from 6 jujube species seemed roughly similar. All the samples showed stretching viberations of -OH at around (3600-3200 cm-1), which located in typical absorption band of polysaccharides.
Table 6 Functional groups and chemical bonds of polysaccharides from 6 jujube species
|
Functional groups or chemical bonds by IR
|
ZBP
|
ZJP
|
ZTP
|
ZHP
|
ZYP
|
ZMP
|
|
typical absorption peaks of polysaccharides (3200- 3600 cm-1)
|
√
|
√
|
√
|
√
|
√
|
√
|
|
Existence of sugar ring (2920- 2935 cm-1)
|
√
|
√
|
√
|
√
|
√
|
√
|
|
existence of uronic acid (C=O stretching viberation and O-H bending vibration) (1500- 1740 cm-1 and 1050- 1260 cm-1)
|
√
|
√
|
√
|
√
|
√
|
√
|
|
bound water (1635- 1640 cm-1)
|
√
|
√
|
√
|
√
|
√
|
√
|
|
C-H bending vibration (1455- 1460 cm-1)
|
√
|
√
|
√
|
×
|
×
|
√
|
|
C=O summetric stretching vibration (1335- 1340 cm-1)
|
√
|
√
|
√
|
√
|
√
|
√
|
|
C-O stretching vibration (1070- 1450 cm-1)
|
√
|
√
|
√
|
√
|
√
|
√
|
|
existence of pyranose sugar (910- 920 cm-1)
|
√
|
√
|
√
|
√
|
√
|
√
|
|
β-configuration of pyranose sugar units (864- 900 cm-1)
|
√
|
√
|
√
|
√
|
√
|
√
|
The absorption peak at 2920-2935 cm-1 indicated the C-H stretching viberation in the sugar ring[24-26]. The absorption peak at approximately 1500-1740 cm-1 and 1050-1260 cm-1 were artributed to C=O stretching viberation and O-H bending vibration, demonstrated the existence of uronic acid[27, 28], corresponded to the assay of uronic acid according to 3.1. The absorption peak of 1635-1640 cm-1 was due to the bound water[29]. The band at 1335-1340 cm-1, 1070-1450 cm-1 might be respectively artributed to C=O summetric stretching vibration and C-O stretching vibration. Peaks at 910-920 cm-1 and 864-900 cm-1 indicated the existence of pyranose sugar[29] and β-type glycosidic bond[20, 30, 31].
However, C-H bending vibration (1455-1460 cm-1) could be observed clearly in ZBP, ZJP, ZTP and ZMP but none in ZHP and ZYP by IR spectrum. This distinct showed no significant diffference which was not enough to trace the 6 jujube species.