Bioinformatics
A total of five glioma datasets were obtained from GlioVis portal (http://gliovis.bioinfo.cnio.es)(13), including TCGA-GBM, TCGA-GBMLGG, CGGA, Rembrandt and Gravendeel datasets. The disease-free survival of TMBIM1 in glioma patients was acquired from GEPIA online website(14).
Human tissue samples
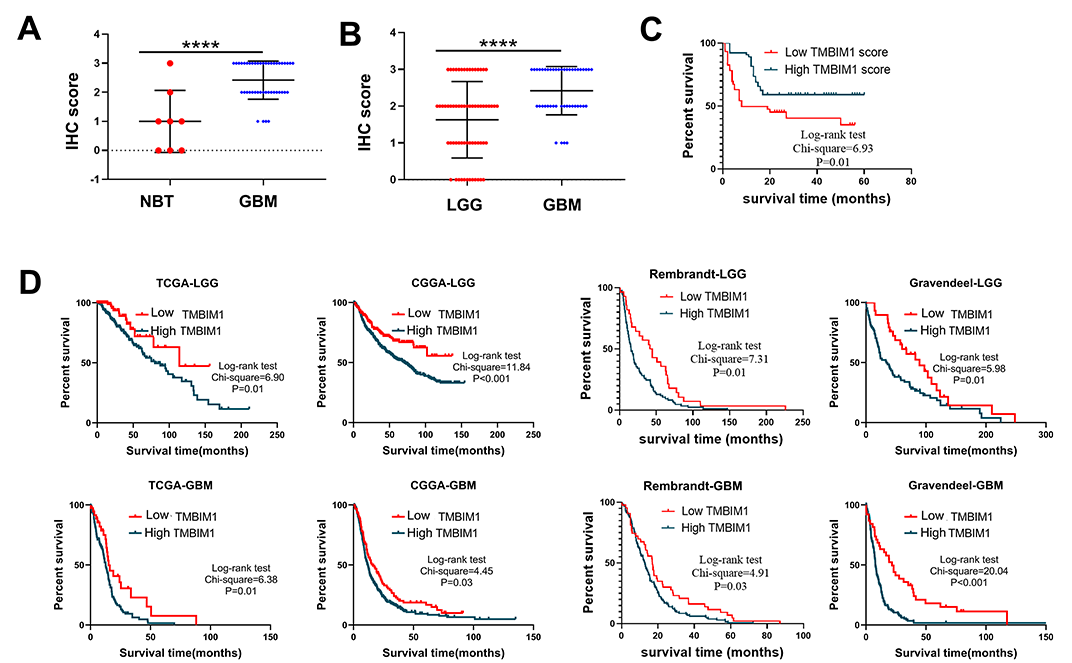
Paraffin-embedded glioma tissue microarray contained 111 glioma tissues and 8 normal brain tissues. All tissue samples were obtained in the Department of Neurosurgery, Renmin Hospital of Wuhan University from March 2016 to June 2019. Details of clinical information for all patients was presented in Table S1. The other 5 non-tumor brain tissues (NBT) and 18 GBM tissues were collected from March 2019 to March 2021 for Western blot (WB) analysis. All NBT were obtained from patients with severe brain injury who need surgery. None of the patients received radiotherapy or chemotherapy before surgery, and all tissues were stored at liquid nitrogen. This study was approved by the Ethics Committee of the Renmin Hospital of Wuhan University [approval number: 2012LKSZ (010) H], and all the patients signed the informed consent.
Antibodies and reagents
CHX (S7418), MG132 (S2619), Compound C (S7306), CQ (S6999) and 3-MA (HY-19312) were purchased from Selleck. Anti-E-cadherin (20874-1-AP), N-cadherin (22018-1-AP), Vimentin (10366-1-AP), SNAIL (13099-1-AP), P62 (18420-1-AP), Beclin1 (11306-1-AP), AMPK (66536-1-Ig) and ULK1 (20986-1-AP) antibodies were obtained from Proteintech (Wuhan, China). Anti-Flag (ANT301) and β-actin (ANT321) were purchased from AntGene (Wuhan, China). Anti-phospho-AMPKα (Thr172) (#2535), anti-phospho-ULK1 (Ser317) (#12753) and Anti-phospho-mTOR (Ser2448) (#5536) were obtained from Cell Signaling Technology (USA). Anti-LC3 (GB11124) was purchased from Servicebio (Wuhan, China).
Cell culture and transfection
U87 and U251 cell lines were purchased from Cell Bank of Chinese Academy of Sciences (Shanghai, China). Cells were cultured in Dulbecco’s modified Eagle’s medium (DMEM) supplemented with 10% fetal bovine serum (FBS) (Gibco, USA). All cells were cultured at 37 °C in a humidified atmosphere of 5% CO2. Flag-TMBIM1 was obtained from Miaolingbio (Wuhan, China). Cells were transfected with 2.0 ug plasmid per well in 6-well plates using Hieff Trans™ liposomal transfection reagent (Yeasen Biotechnology, China) according to the manufacturer’s instruction.
Stable cell lines establishment
The knockdown lentivirus vector of TMBIM1 (rLV-shRNA-TMBIM1) was obtained from Huamengbio (Wuhan, China) and all lentiviral vectors are verified by DNA sequencing. Cells were cultured in 6-well plates and infected by lentivirus according to the manufacturer’s instruction for 24 hours. Subsequently, cells were treated using puromycin (2 μg/ml) for 72 hours and fresh medium was added after washed with PBS buffer. The knockdown efficiency of TMBIM1 was verified by real-time qPCR and WB. The TMBIM1 shRNA sequence was as follows (shTMBIM1-1-F:5‘GATCCGGAGAGAGCGGTGAGTGATAGCTCGAGCTATCACTCACCGCTCTCTCCTTTTTTG-3’, shTMBIM1-1-R:5‘-AATTCAAAAAAGGAGAGAGCGGTGAGTGATAGCTCGAGCTATCACTCACCGCTCTCTCCG-3’, shTMBIM1-2-F: 5‘-GATCCGCCGTTTCCCATGGAACATCACTCGAGTGATGTTCCATGGGAAACGGCTTTTTTG-3’, shTMBIM1-2-R: 5‘-AATTCAAAAAAGCCGTTTCCCATGGAACATCACTCGAGTGATGTTCCATGGGAAACGGCG-3’)
Transwell assay
Cell invasion and migration were detected using the Matrigel (R&D, USA)-coated transwells and no Matrigel -coated tarnswells, respectively. 3 × 10⁵ cells in serum-free medium were added to upper chamber, and 600 ul DMEM supplemented with 10% FBS was added to lower chamber. The cells were fixed with 4% paraformaldehyde for 30 minutes after incubated in an incubator (37 °C, 5% CO2) for 24 hours. Then cells were stained with 0.5% crystal violet for 15 minutes and observed under a microscope (Olympus, BX51, Japan). In each experimental group, we randomly selected 6 fields to calculate the average cell count, and we repeated all the experiments three times.
Western blot
Cells were lysed in RIPA lysis buffer (Beyotime, China) on ice for about 30 minutes after washed 3 times with PBS buffer. After centrifugation, protein was added SDS-PAGE sample loading buffer and heated at 100 °C for 10 minutes. Equal amount protein was added to SDS-PAGE gels and then transferred to PVDF membrane. After blocking in 5% skim milk powder for 60 minutes, the membranes were incubated with primary antibody at 4 °C overnight. The next day, the bands were incubated with incubated secondary antibody after washing with PBST, and then visualized using ChemiDoc™ Touch Imaging System (BIO RAD, China)
RNA isolation and RT-PCR
Total RNA was extracted from cells by using TRIzol reagent (Invitrogen, USA). PrimeScript RT Reagent Kit with gDNA Eraser (RR047A, Japan) was used to synthesize cDNA. Quantitative RT-PCR was performed using SYBR® Premix Ex Taq™ II (RR820A, Takara). The specific primer pairs were as follows: GAPDH Forward:5′-TGCCAAATATGATGACATCAAGAA-3′, GAPDH Reverse: 5′-GGAGTGGGTGTCGCTGTTG-3′. TMBIM1 Forward: 5′-CACCCGATGCCCATGAACTA-3′, GAPDH Reverse: 5′-CACTTTCCGGTCATCCCACT-3′, E-cadherin Forward: 5′-GCGAACTGTTTGCAGAGG-3′, E-cadherin Reverse:5′-CAGTGCGTGTCGTGGAGT-3′
Immunohistochemistry
The normal brain and glioma tissues were embedded in paraffin and sectioned. The sections were deparaffinized with xylene for 15 minutes, and then dehydrated with 100%, 95% and 75% ethanol. After washing with PBS buffer for three times, Tris-EDTA antigen repair solution (Servicebio, China) was used for antigen retrieval, and the endogenous peroxidase was removed with 3% H2O2. Subsequently, the sections were incubated with primary antibody overnight and HRP-labelled secondary antibody (Service bio, China) for 1 hour the next day. DAB staining solution (Service bio, China) was added to the slices, and the sections were also stained with hematoxylin. The intensity of IHC was divided into: 0, 1, 2, 3 points which represented background staining, faint staining, moderate staining and strong staining respectively. Two independent pathologists examined and scored. If they have different opinions, a third pathologist will be added for scoring. IHC score of 0-1 was defined as low expression group, and score of 2-3 was divided into high expression group.
Autophagosome and autophagic flux detection
For electron microscopic analysis, cells were collected in a 1.5ml EP tube. The cells were fixed with cold fixative solution (Servicebio, China) overnight at 4°C, then embedded, sectioned and observed with transmission electron microscope (TEM) (Hitachi, Japan). Lentivirus lenti-mCherry-EGFP-LC3B (Beyotime, China) was used to monitor the autophagic flux in U251 cells transferred vector or Flag-TMBIM1 plasmid for 24 hours. After infected for 24 hours, cells were fixed with 4% paraformaldehyde, observed and photographed with a confocal fluorescence microscope (FV1200, Olympus).
Intracranial Xenograft model
U87 cell line transfected with sh-TMBIM1 or the control shRNA were digested with trypsin and washed with PBS to a concentration of 1 × 10⁵ cells/μl, and then 4× 10⁵ cells were injected into the right striatum of 6-week-old Balb/c nude mice. The sh-TMBIM1 mice were randomly divided into two groups (n=10), and CQ (50 mg/kg) or DMSO was injected every 2 days for 10 consecutive times after cell inoculation for 10 days. Tumor volume was monitored by bioluminescence using IVIS 200 Spectrum Imaging System (Caliper Life Sciences, USA) after retroorbital injection of luciferin (150 mg/kg). For survival analysis, we observed the nude mice on a regular basis, and sacrificed the mice when there are severe neurological symptoms and/or significant weight loss (over 20% of body weight). Then the brain tissue of nude mouse was taken out, fixed with polyoxymethylene, and embedded in paraffin. The animal experiment was reviewed and approved by the Animal Ethics Committee of Renmin Hospital of Wuhan University
Statistical analysis
The results were presented as the mean ± standard. Student’s t-test was used to test differences between two groups. For three or more groups, one-way analysis of variance (ANOVA) was used, and Tukey’s multiple comparisons test was performed to test the differences between groups when analysis of variance was significant. Patients were divided into high and low groups according to upper quartile cutoff ,and Kaplan–Meier survival analysis was used to interstate significance between groups. This analysis was performed through GraphPad prism 8.0 software. SP33.23 software was used to perform univariate and multivariate Cox regression analysis. A p value < 0.05 was considered significant.