Study animals
Candidate animals for this study were recently weaned, crossbred beef-breed feedlot steer calves that were raised without the use of antimicrobials since birth (i.e. “natural” program). Calves arrived at the feedlot directly from calf-ranches in January 2019. A total of 18 steers were enrolled to the study over 3 days in February 2019. As no prior data were available on the relative contributions of the nasopharyngeal and oropharyngeal microbiotas as source communities to the lung microbiota in cattle, it was not possible to calculate an a-priori sample size. The sample size was therefore based on availability of cattle at the feedlot and costs, with a minimum of 15 cattle.
On arrival at the feedlot, steers were processed according to standard feedlot protocols; they received a topical avermectin (Bimectin™, Bimeda-MTC Animal Health Inc., Cambridge, ON, Canada), a clostridial vaccine (Ultrabac® 7/Somubac®, Zoetis Canada Inc., Kirkland, QC, Canada), and a multivalent modified live viral vaccine with a M. haemolytica toxoid (Pyramid® FP 5 + Presponse® SQ, Boehringer Ingelheim (Canada) Ltd., Burlington, ON, Canada).
Subsequent animal husbandry followed standard feedlot protocol, as previously described [40]. After arrival processing, study steers were commingled with other steers and housed in large, outdoor dirt-floor pens with capacities between ~250-300 cattle/pen. Twice daily steers were fed a corn-based diet formulated to meet or exceed nutrient requirements. This diet did not contain any in-feed antimicrobials. Feed bunks were visually inspected and evaluated every day prior to feeding and feed deliveries were adjusted accordingly to ensure that steers had access to sufficient feed to allow for ad libitum consumption.
Study design
Apparently healthy steers were conveniently selected by feedlot staff and presented to the feedlot hospital facility on the day of study enrollment for clinical evaluation. Once it was determined that there had been no prior treatment for clinical BP or other disease during the feeding period, an experienced study veterinarian (ET) examined each steer for inclusion to the study. This included a visual assessment of the steer for clinical signs associated with BP, specifically depression, cough, nasal discharge, and ocular discharge. A complete thoracic auscultation was also performed to detect abnormal lung sounds, as described [56]. Furthermore, a thoracic ultrasonography of the cranio-ventral portion of both sides of the thorax was performed to detect lung consolidation (> 1 cm deep) or pleural effusion, as described [57]. Rectal temperature was also measured. Finally, whole blood was collected using plain tubes (BD Vacutainer® Rapid Serum Tube, BD Canada, Mississauga, ON, Canada) for haptoglobin analysis, as described [58].
Steers that did not exhibit any visual signs associated with BP and that had normal lung sounds, no lung consolidation (> 1 cm deep) or pleural effusion detected at thoracic ultrasonography, and a rectal temperature < 40°C were sampled as described below. Only samples coming from steers that had a serum haptoglobin concentration ≤ 0.25 g/L were further analyzed [58].
Sampling procedures and sample processing
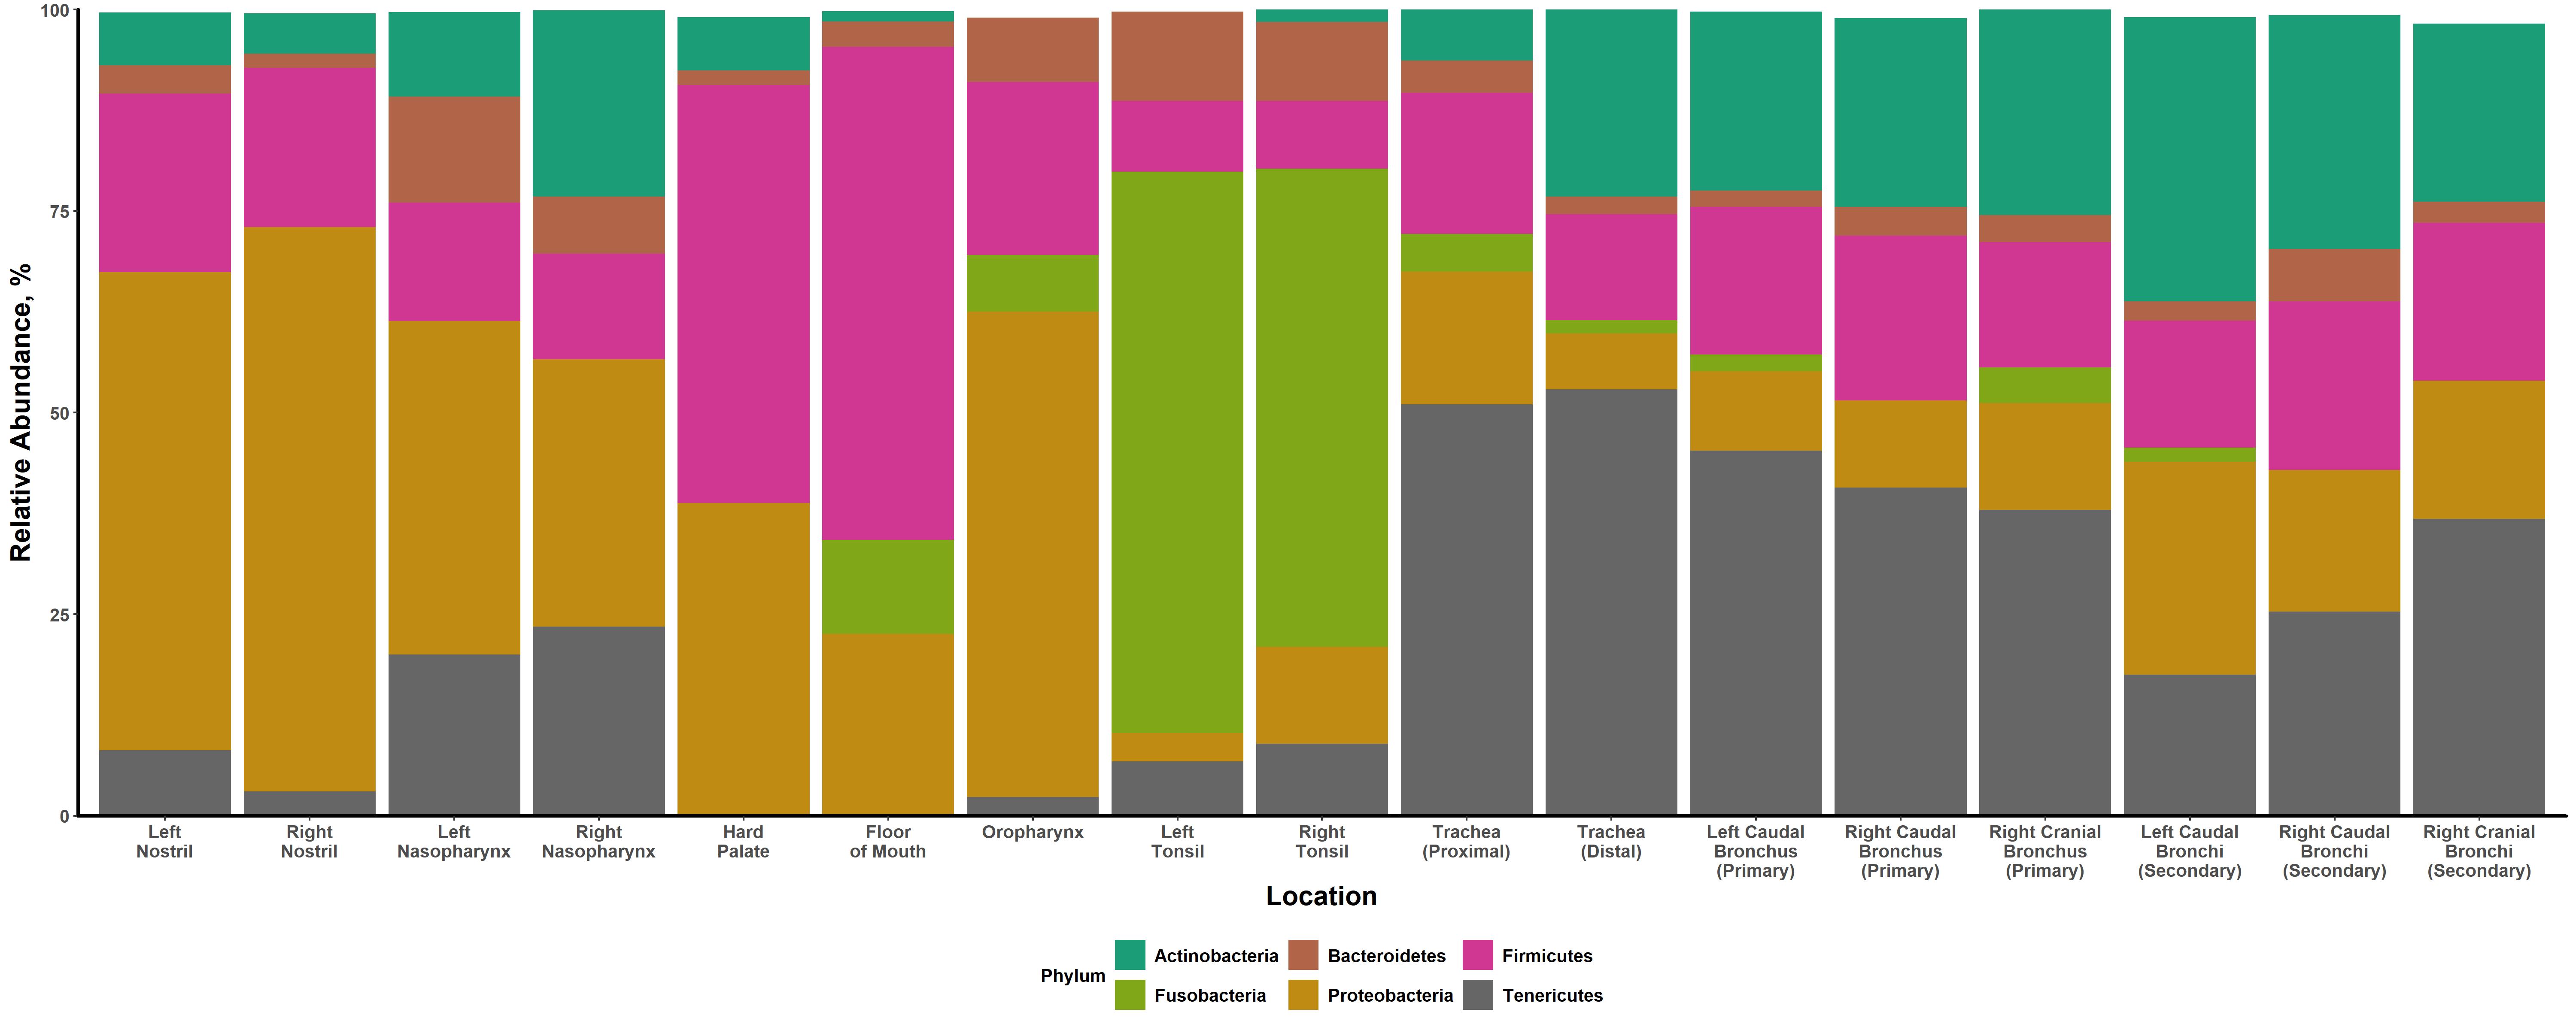
A total of 17 respiratory tract locations were sampled for each steer. This included the: left and right nostrils, left and right nasopharynx, hard palate, floor of the mouth (area under the tongue), oropharynx (soft palate), left and right palatine tonsils, trachea (proximal and distal), left caudal bronchus (primary), left caudal bronchi (secondary), right caudal bronchus (primary), right caudal bronchi (secondary), right cranial bronchus (primary), and right cranial bronchi (secondary). The proximal trachea sample was collected from the tracheal mucosae immediately distal to the larynx. The distal trachea sample was collected from the tracheal mucosae immediately proximal to the carina.
The first locations sampled from each steer were the nostrils followed by the nasopharynx. Briefly, paper towel was used to thoroughly wipe out both nostrils from each steer in order to remove potential debris. A short, flocked nylon fiber tip swab (9 cm long; BD ESwab™ Collection Kit Regular Flocked Swab, BD Canada) was inserted into the left nostril and vigorously moved back and forth against the mucosal surface. The swab was then removed from the steer’s nostril and inserted into a transport tube containing liquid Amies transport media (all swab samples were stored in the same type of transport tube). This process was repeated for the right nostril. Next, a long, guarded swab with a rayon tip (27 cm long; MW 124, Medical Wire & Equipment, Corsham, United Kingdom) was inserted into the left nostril, down into the nasopharynx, as described [40]. The nasopharynx was sampled by extending the swab beyond the guard and vigorously moving it back and forth against the mucosal surface. After retracting the swab behind the guard, the entire swab was removed from the steer’s nasal passageway. The swab was then extended beyond the guard and the tip inserted into a transport tube, where it was removed from the rest of the swab using scissors. This process was repeated for the right nasopharynx.
The next locations sampled were the hard palate and floor of the mouth using short, flocked nylon fiber tip swabs. Briefly, the steer’s mouth was held open and its tongue held to the side by hand. A short, nylon fiber tip swab was moved back and forth against the hard palate. The swab was then removed from the steer’s mouth and inserted into a transport tube. This process was repeated for the floor of the mouth, with the swab moved back and forth against the mucosal surface under the tongue.
Next, to collect samples from the tonsils and oropharynx a long, hollow metal tube was inserted into the mouth of the steer. A 105 cm long video-endoscope was passed through the tube along with a double-guarded swab with a polystyrene cotton tip (84 cm; J0273, Jorgensen Laboratories, Inc., Loveland, CO, USA), with the swab retracted behind the guards. After the left tonsil was located using the camera in the endoscope, the swab was extended beyond the guards directly into the tonsil, where it was moved back and forth against the tonsillar lymphatic tissue (Additional file 12). After retracting the swab behind the guard, the entire swab was removed from the steer’s oral passageway. The swab was then extended beyond the guard and the tip inserted into a transport tube, where it was removed from the rest of the swab using scissors. This process was repeated for the right tonsil. The oropharynx was then sampled using a similar method, with the swab being moved vigorously back and forth against the mucosal surface of the soft palate.
Using a 140 cm long video-endoscope, the trachea and primary bronchi of the lung were sampled next. The video-endoscope was inserted into the left nostril and down through the nasal passageway to just beyond the larynx. A double-guarded PSB (custom-made, gas sterilized; brush diameter 3.0 mm, length 200 cm [00109, ConMed Canada, Mississauga, ON, Canada] protected by an additional outer Teflon sheath with a cellulose plug at the distal end [custom-made by Mila International Inc., Florence, KY, USA]) was passed through the channel of the video-endoscope until it protruded into the trachea. The cellulose plug was pushed out of the catheter using the specimen brush (Additional file 13), which was extended into the respiratory tract and moved back and forth against the mucosal surface of the proximal trachea (Additional file 14). After retracting the brush behind the protective catheter, the entire apparatus was removed from the endoscope. The endoscope was then pushed deeper into the respiratory tract, with the same process repeated for the right cranial bronchus, distal trachea, left caudal bronchus, and right caudal bronchus, in that order. After collection, each PSB was extended beyond the protective catheter and the tip inserted into a transport tube containing liquid Amies transport media, where it was removed from the rest of the apparatus using wire cutters.
Without removing the video-endoscope used for the PSB samples, a triple-sheathed catheter was passed through the endoscope (EMAC800, Mila International Inc.) and down into the primary left caudal bronchus. Using a sterile 30-mL syringe, ~10 mL of sterile saline was pushed into the secondary bronchi of the right caudal lobe. The saline was recovered by aspirating the syringe repeatedly until ~2 mL of fluid was obtained. This process was repeated for the left caudal and then right cranial secondary bronchi. Saline was transferred via needle to individual sterile 4 mL plain tubes (BD Vacutainer Rapid Serum Tubes).
At the time of study sample collection, negative control samples (n = 13) were collected for the different swabs and brushes outside the animals. As well, negative control samples (n = 6) were collected from five different study animals to assess the risk for potential contamination when passing the endoscope down through the nasal passageway into the lower respiratory tract (one animal was sampled twice due to possible contamination of the first sample collected; the contaminated sample was removed from the study after sequencing data were processed and the sample was assessed). These samples were collected using a PSB by extending the brush into the distal trachea without touching the brush to any surface and retracting the brush behind the protective catheter.
All samples were immediately stored in a polystyrene cooler on ice packs and transported within 6 hr to the University of Calgary, Calgary, AB. After arrival at the university, swabs and brushes were removed from their transport tubes and placed into individual 1 mL aliquots of 20% glycerol/80% brain heart infusion (BHI) broth in microcentrifuge tubes. The transport tubes were centrifuged at 2,000 x g for 5 min. The supernatant was removed, and the pellets were resuspended in 0.2 mL of 20% glycerol/80% BHI broth and added to the tube with their respective swab/brush. The saline wash samples were also centrifuged at 2,000 x g for 5 min. The supernatant was removed, the pellets were resuspended in 1.2 mL aliquots of 20% glycerol/80% BHI broth, and the resuspended pellets were placed in individual microcentrifuge tubes. Each microcentrifuge tube was vortexed for 30 s. Samples were then frozen at -80°C until laboratory diagnostic work was performed.
DNA extraction
A commercially available extraction kit (DNeasy® Blood & Tissue Kit, QIAGEN Inc., Mississauga, ON, Canada) was used to extract total DNA from all samples, as previously described [40]. Briefly, the swabs and brushes were removed from each sample tube and placed in individual sterile tubes on ice. The sample tubes containing glycerol/BHI broth, including those from which the swabs/brushes were removed and those containing a resuspended pellet from the saline wash samples, were centrifuged at 5,000 x g for 5 min. Supernatant was pulled out of each sample tube and discarded. The swabs/brushes were then returned to their original respective tubes. The swabs/brushes and pellets were then suspended in 180 µl of an enzymatic lysis buffer containing lysozyme (100 mg ml-1) and mutanolysin (25,000 U ml-1). Each sample mixture was vortexed at 300 rpm and incubated at 37°C for 1 hr. Next, an ethanol-free lysis buffer (200 µl) and proteinase K (25 µl) were combined with each mixture. Each sample mixture was individually vortexed, and then incubated for 30 min at 56°C. Approximately 300 mg of sterile 0.1 mm zircon/silica beads were poured into each sample mixture and beaten using a TissueLyser LT (QIAGEN Inc.) for 5 min at 30 Hz. Each mixture was then centrifuged at 13,000 x g for 5 min and the resulting supernatant was transferred to new individual sterile microcentrifuge tubes. The supernatant was combined with ethanol (200 µl) and each tube was vortexed. The DNeasy Blood & Tissue Kit protocol, in accordance with the instructions provided by the manufacturers, was used from this point forward to finish the extraction process. DNA extractions performed within the same day used the same reagents, and all reagents came from one kit. A negative control sample was included for each day of extractions, which involved the DNA extraction steps outlined above minus the presence of sample material (n = 11 negative controls). Positive control samples were included to assess both the DNA extraction process and subsequent targeted amplicon sequencing (n = 2 positive controls). Each positive control consisted of a bacterial mock community comprised of a 10-strain mix of whole cell material (ATCC® MSA-2003™, Manassas, VA, USA).
Amplification and sequencing
Targeted amplicon sequencing (16S rRNA gene) for all DNA samples was performed at Génome Québec, located in Montréal, QC, Canada, as previously described [40]. The V3-V4 hypervariable regions of the 16S rRNA gene were amplified using primers 341F (ACACTGACGACATGGTTCTACA) and 805R (TACGGTAGCAGAGACTTGGTCT). Each primer was modified to include adapters designed to bind DNA to a flow cell for sequencing, as well as index barcodes to allow for library multiplexing. DNA was amplified using 25 µL reaction mixtures that contained each primer at a concentration of 0.6 µM, deoxynucleoside triphosphate at a concentration of 0.2 mM, dimethyl sulfoxide at a concentration of 5%, TAQ 5U-µl polymerase at a concentration of 0.02 U/µL, 2.5 µL of 10X polymerase chain reaction (PCR) buffer with 18 mM of MgCl2, 19.35 µL of distilled water, and 1 µL of DNA. Amplification via PCR entailed an initial denaturation step at 94°C for 2 min. Initial denaturation was followed by 33 cycles of 94°C for 30 s, 60°C for 30 s, and 72°C for 30 s, finishing with an extension step at 72°C for 7 min. Verification of DNA barcoding and amplification were performed separately on 2% agarose gels. A Quant-iT™ PicoGreen® dsDNA Assay Kit (Thermo Fisher Scientific, Waltham, Massachusetts) was used to quantify total DNA amplified.
DNA libraries were set up by pooling 25 ng of individual samples together. All libraries were cleaned with sparQ PureMag Beads (Quantabio, Beverly, MA, USA). A Quant-iT™ PicoGreen® dsDNA Assay Kit (Life Technologies, Burlington, ON, Canada) was used to quantify each amplicon. A universal KAPA Library Quantification Kit for Illumina® Platforms with Revised Primers and Kapa SYBR® Fast (Kapa Biosystems, Wilmington, MA, USA) was used to quantify the libraries. Average fragment size was established using a LabChip GX instrument (PerkinElmer, Waltham, MA, USA). In order to ameliorate unbalanced base composition, 10% of the PhiX control library was added to the amplicon pool (final loading concentration of 10 pM) prior to DNA sequencing. A MiSeq Reagent Kit v3 (600 cycles) (Illumina, Inc., San Diego, CA, USA) was used according to the instructions provided by the manufacturer to perform 16S rRNA gene amplicon sequencing. Additionally, LNA™ modified custom primers (Exiqon, Copenhagen, Kingdom of Denmark) were included in the amplicon sequencing process (Primer read 1 – ACACTGACGACATGGTTCTACA; primer read 2 – TACGGTAGCAGAGACTTGGTCT; Primer index read – AGACCAAGTCTCTGCTACCGTA). Following sequencing, Génome Québec demultiplexed the libraries and removed all adapters and index barcodes from the sequence data.
Sequence processing
Sequencing data were processed as previously described [40] using cutadapt v2.3 [59] and DADA2 v1.10 [60] as implemented in R v3.5.1 [61]. Forward and reverse 5’ 16S primers, as well as low-quality ends, were trimmed from the raw sequencing data using cutadapt in paired-end mode with a maximum allowed error rate of 0.1 and a quality cutoff of 20. Reverse compliment primers were not trimmed as the targeted read length was 2 x 300 base pairs; as the approximate length of the V3-V4 regions is 460 base pairs, reverse compliments of the forward and reverse 5’ primers were never sequenced and therefore were not present in the data. Sequencing data quality was then assessed using FastQC v0.11.8 [62]. Individual sample quality reports were compiled into one comprehensive report using MultiQC v1.7 [63]. Once the quality of the data was deemed acceptable, DADA2 was utilized to filter and trim reads, infer exact SVs, and assign taxonomy to SVs. Default parameters were used for all DADA2 functions unless expressly mentioned. Reads were filtered using a maximum expected error of one. A parametric error model was then estimated through a form of unsupervised machine-learning. This estimation was performed using 100 million sequences each for the forward and reverse reads separately. Sequencing reads were then dereplicated. Exact amplicon SVs were inferred for each sample using the DADA2 sample inference algorithm and the estimated error model. Samples were pooled together for sample inference to increase sensitivity to SVs present at extremely low frequencies. Full, denoised sequences were obtained by merging the inferred forward and reverse reads. An SV table, which is functionally similar to an operational taxonomic unit table, was assembled from the denoised sequences. Chimeric sequences were then removed from the table. A taxonomy table was assembled by assigning taxonomy to each SV in the SV table using the RDP [64] taxonomic database for DADA2 [65]. All species level assignment was accomplished using the DADA2::addSpecies function, with exact matching used to assign species when possible.
Statistical analyses
Downstream analyses were performed in R using multiple functions from phyloseq v1.26.1 [66], ggpubr v0.2.4 [67], RVAideMemoire v0.9-74 [68], vegan v2.5-6 [69], and DirichletMultinomial v1.28.20 [70]. An object was constructed from the SV and taxonomy tables in R using phyloseq for subsequent analysis. A prevalence filter was applied to the phyloseq object such that only SVs present in ≥ 1% of the samples remained. Mean relative abundance and beta-diversity measures were calculated using prevalence filtered data; alpha-diversity measures were calculated using unfiltered data.
To facilitate downstream analyses, samples were classified into location metagroups based on preliminary analyses and anatomical/functional similarity among sampling locations. These metagroups included the: nostrils (left and right nostrils), nasopharynx (left and right nasopharynges), hard palate, floor of the mouth, oropharynx, tonsils (left and right tonsils), trachea (proximal trachea), and lung (everything from the distal trachea down into the lung). All preliminary analyses incorporated pairwise comparisons of the different sampling locations and included comparisons of select alpha-diversity metrics, a permutational multivariate analysis of variance (PERMANOVA), and an ANOSIM, as detailed below. Preliminary results are included as supplementary files (Additional files 15 & 16).
Species richness (Chao1 index) and diversity (Shannon diversity index) were calculated for all samples as implemented in phyloseq. Pairwise comparisons of alpha-diversity measures were made using Wilcoxon rank-sum tests to compare alpha-diversity group means between sampling locations and location metagroups as implemented in ggpubr. Adjustments for multiple comparisons were made using the Holm method.
A pairwise ANOSIM using a Bray-Curtis dissimilarity index as implemented in the vegan package was used to evaluate compositional similarities between different sampling locations and location metagroups. An individual ANOSIM was performed for each pairwise sampling location comparison and all p-values were adjusted for multiple comparisons using the Benjamini & Hochberg method as implemented in vegan. A similar procedure was used to compare location metagroups, with all p-values adjusted for multiple comparisons using the Holm method as implemented in vegan.
A pairwise PERMANOVA using a Bray-Curtis dissimilarity index as implemented in the RVAideMemoire package was used to evaluate compositional differences between different sampling locations. The RVAideMemoire package corrected for multiple comparisons using the Benjamini & Hochberg method. To visualize these compositional differences, data were ordinated using non-metric multidimensional scaling (NMDS) and a Bray-Curtis dissimilarity index as implemented in phyloseq.
Finally, samples were clustered using Dirichlet multinomial mixtures [71] as implemented in the DirichletMultinomial package, as previously described [13]. Using a Laplace approximation, the number of Dirichlet components (i.e. metacommunities) that fit the data best was determined. Contributions of different taxa to each metacommunity were determined by comparing the best fit model to one with a single metacommunity as described [70]. Individual taxa were assigned to the metacommunity where it had the highest contribution. Clustering was performed separately at both the genus and individual SV level.