A total of 64 children (27 boys, 37 girls) were included in the study (20 COVID-19 cases [10 boys, 10 girls], 25 MIS-C cases [16 boys, 9 girls], and 19 healthy children [11 boys, 8 girls]). There was no statistical difference between the study groups in terms of gender (p > 0.05). The median age was 7 years in the MIS-C group, 9.5 years in the COVID-19 group, and 8 years in the control group. The age distribution of the MIS-C, COVID-19, and control groups was statistically similar (p < 0.05). In the MIS-C group, five children were obese (> 95th percentile), and nine children were overweight (85–95th percentile). It was observed that in the COVID-19 group, five subjects were obese (> 95th percentile) and seven subjects were overweight (85–95th percentile).
Diagnoses were based on SARS CoV-2 rt-PCR positivity in 95% of the COVID-19 cases and antigen positivity in one case. In the MIS-C cases, 24% (n = 6) were SARS CoV-2 rt-PCR positive, 52% (n = 13) were SARS CoV-2 IgG positive, 28% (n = 7) were both SARS CoV-2 IgG and SARS CoV-2 IgM positive, and antigen positivity was detected in one case. There was a history of contact in 10 cases (40%) in the MIS-C group.
In the COVID-19 cases, fever was the most common symptom (75%, n = 15), followed by cough (50%, n = 10). Other symptoms were diarrhea (40%, n = 5), tachypnea (40%, n = 5), runny nose (40%, n = 5), myalgia (35%, n = 7), headache (35%, n = 7), and abdominal pain (30%, n = 6). In the COVID-19 group, positive results were found in 13 cases (65%) of chest radiography and in 7 cases (35%) of computerized thorax tomography.
Fever was present in all MIS-C cases. The most common symptoms in the MIS-C patients were abdominal pain (72%, n = 18), diarrhea (56%, n = 14), and myalgia (48%, n = 12), followed by headache (36%, n = 9), tachypnea (20%, n = 5), cough (16%, n = 4), and runny nose (8%, n = 2). Most cases had more than one symptom. The most common sign was rash (44%). Other pathological findings were symptoms of conjunctivitis (24%), respiratory (20%), and neurological (8%) symptoms. Most patients in the study population had multisystem involvement. The most common system involvements were hematologic (72%) and gastrointestinal (64%). Other system involvements were cardiovascular (40%), dermatological (32%), respiratory (20%), and neurological (8%). The most common laboratory parameters in the MIS-C cases were elevated serum C-reactive protein levels in 16 cases (64%), elevated serum fibrinogen levels in 13 cases (52%), and elevated D-dimer levels in 12 cases (48%). Other markers were lymphopenia in 9 cases (36%), high ferritin in 8 cases (32%), high BNP in 8 cases (32%), high erythrocyte sedimentation rate in 4 cases (16%), high INR in 4 cases (16%), elevated serum IL-6 levels in 4 cases (16%), high levels of procalcitonin in 3 cases (12%), high levels of LDH in 1 case (4%), high levels of neutrophils in 2 cases (8%), and elevated liver function in two cases (8%).
Intestinal microbiota analysis
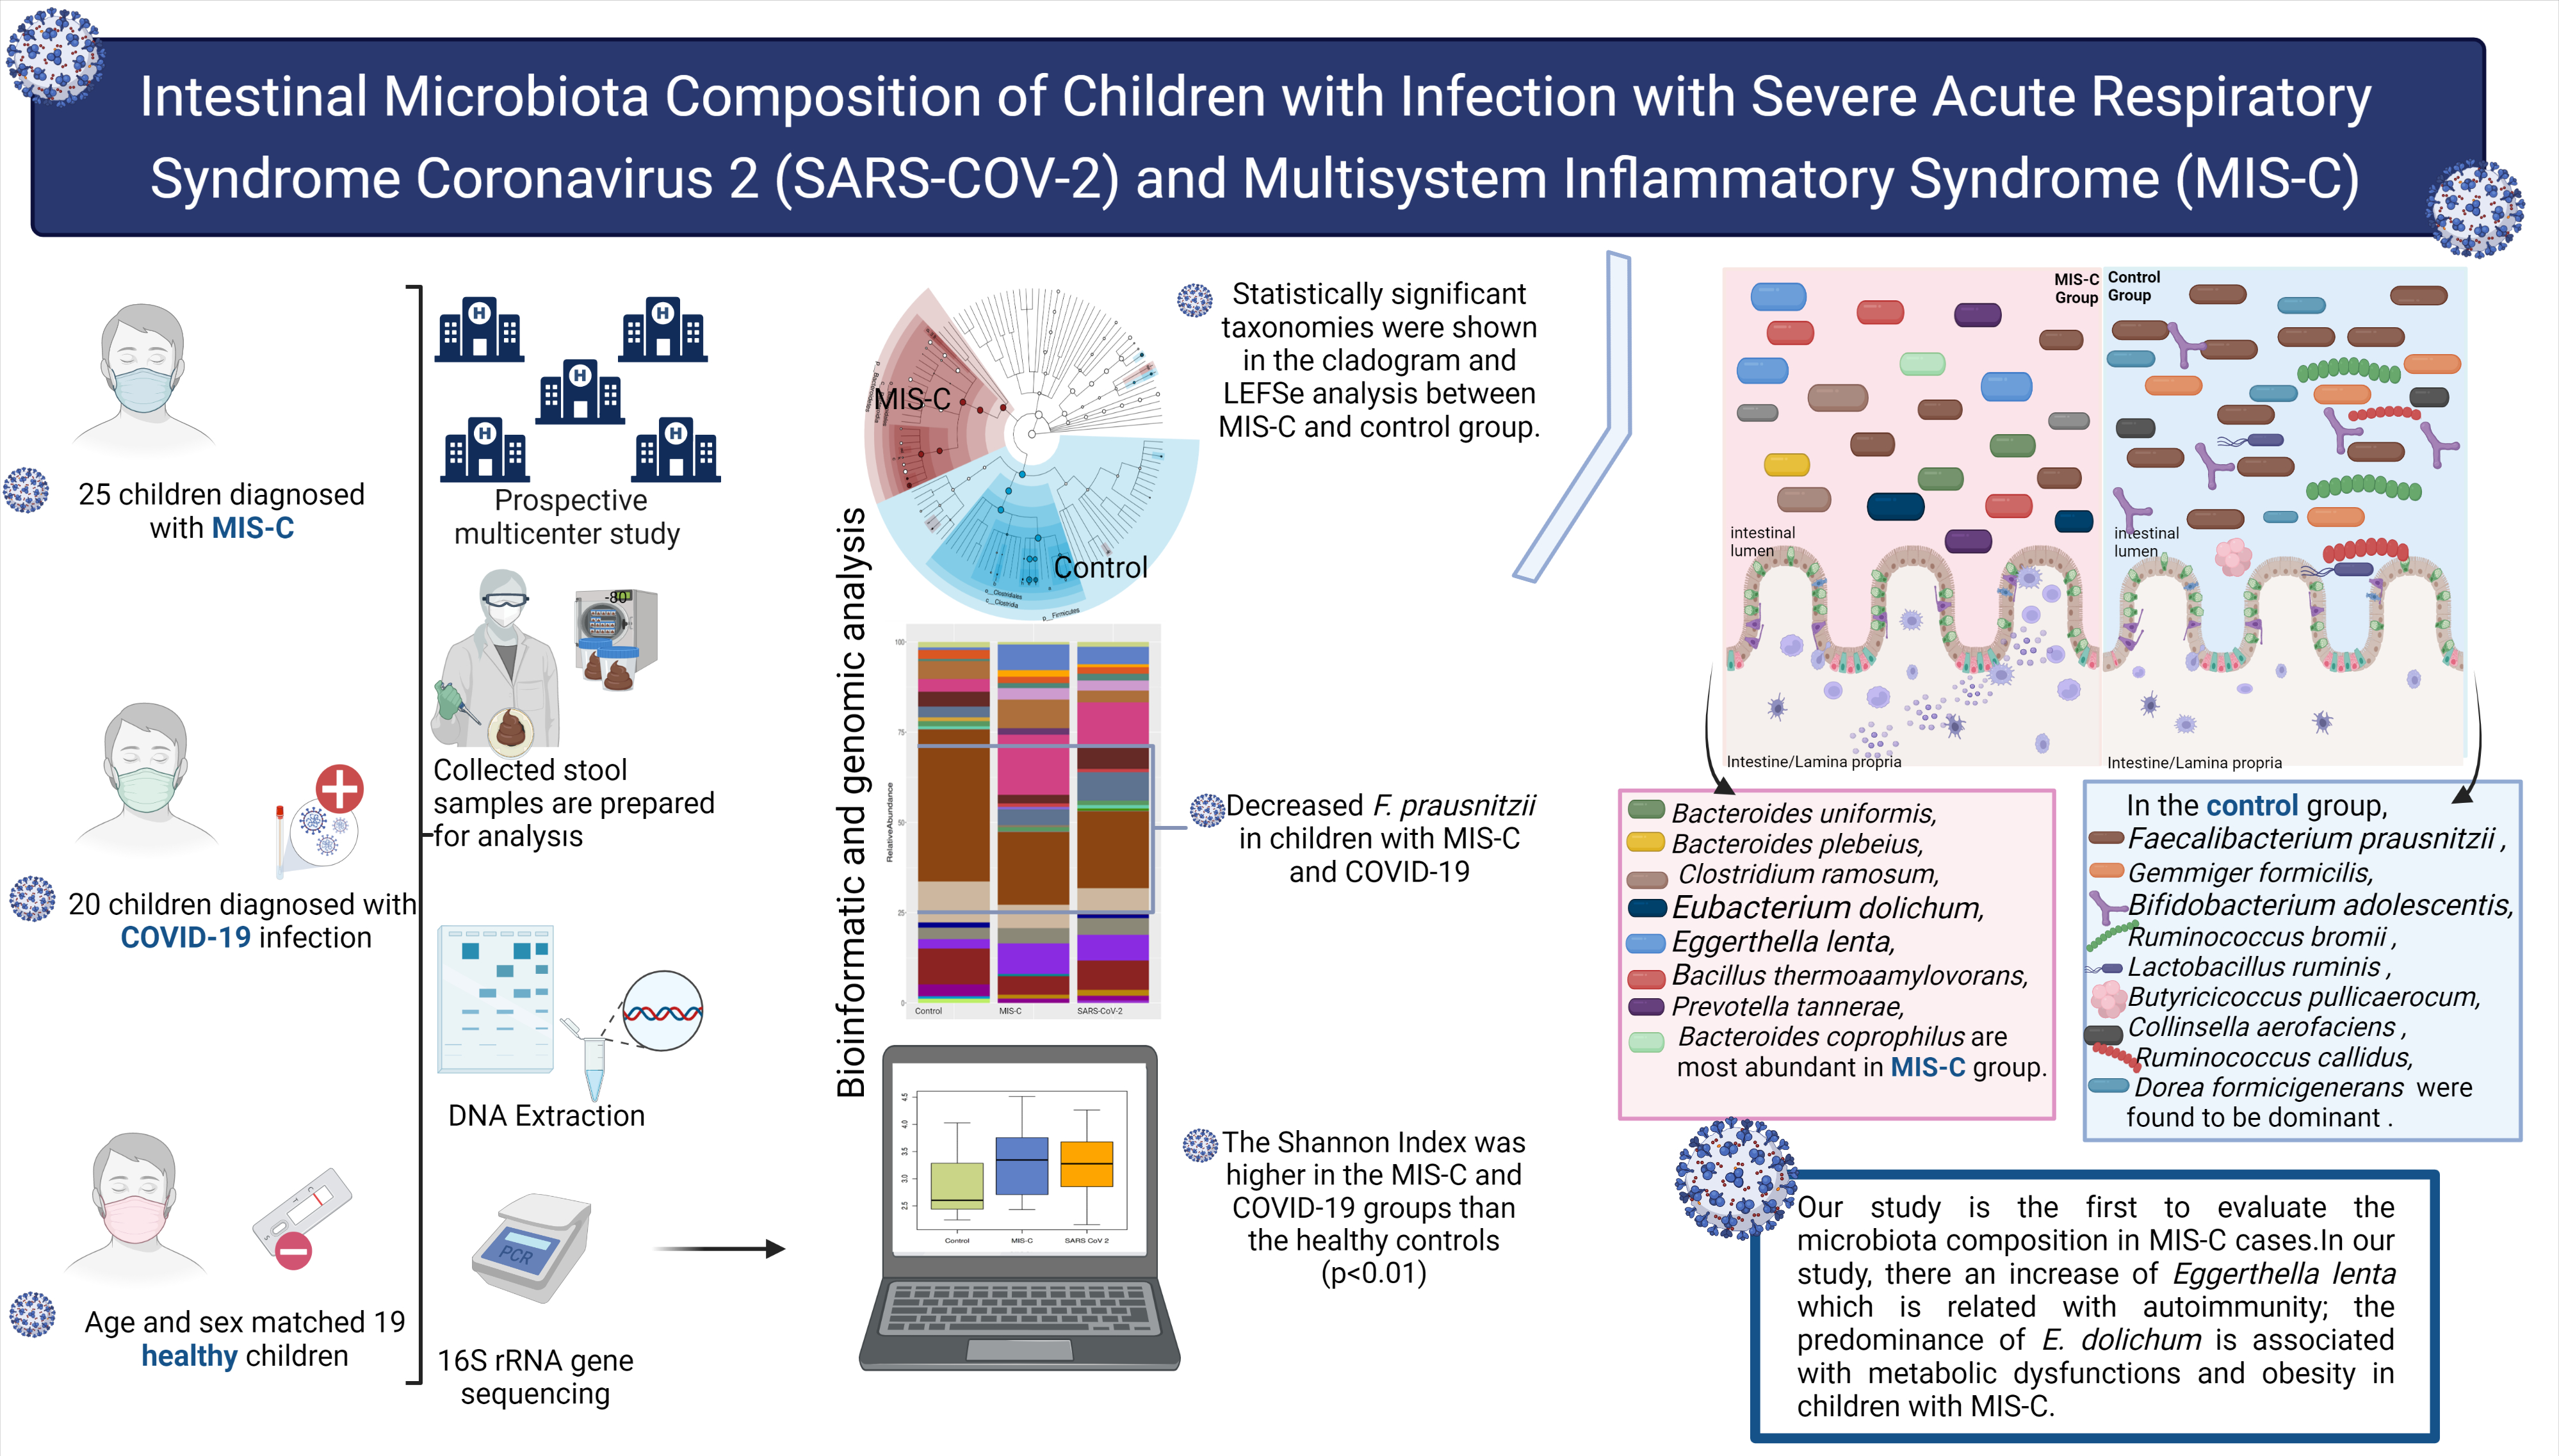
Alpha and beta diversity. Although the median observed taxonomic units (OTU) value observed in the stool samples taken from the MIS-C group was lower than those in the control and SARS CoV-2 groups, no statistical difference was found in OTU levels and the Chao-1 index (p > 0.05). Simpson index comparison between the study groups. There was no significant difference in stool sample data between the groups in the study (p > 0.05). Species dominance distribution between the 25th and 75th percentile range in both stool sample data was found to be greater in MIS-C cases compared to other groups. (Fig. 2a) The Shannon Index is a measure of richness and uniformity that considers the entropy used in the study. It was higher in the MIS-C cases compared with the control group and the SARS CoV-2 group (p < 0.05) (Fig. 2b). A statistical difference in the stool samples was found between the groups in the results of the Bray-Curtis (Fig. 2c), Jaccard (Fig. 2d), weighted UniFrac (Fig. 2e), and unweighted UniFrac (Fig. 2f) baseline coordinate analysis (PCoA) (p = 0.001)
The MIS-C group showed the following phylum levels: Firmicutes (46%), Bacteroidetes (32%), Proteobacteria (11%), Actinobacteria (7%), and Verrucomicrobia (3%). In the control group, they were as follows: Firmicutes (64%), Bacteroidetes (23%), Actinobacteria (6%), and Proteobacteria (5%). In the SARS CoV-2 group, the levels were as follows: Firmicutes (51%), Bacteroidetes (25%), Proteobacteria (12%), Actinobacteria (9%), and Verrucomicrobia (2%). Regarding the presence of Bacteroides, no difference was observed between the SARS CoV-2 group and the control group; however, Bacteroides were higher in the MIS-C group compared with the other two groups.
Microbiota composition is shown according to genera and species levels in Fig. 3. At genera levels, the dominant genus in the healthy controls was Faecalibacterium (16%), which was decreased in the MIS-C (9%) group and the SARS CoV-2 (8%) group. Bacteroides, Eggerthella, and Clostridium genera were significantly higher in the MIS-C group (21%, 10%, and 21%, respectively) than in the SARS CoV-2 group (16%, 6%, and 2%, respectively) and the control group (15%, 2%, and 15%, respectively) (Fig. 3a).
At the species level, we observed abundances of Faecalibacterium prausnitzii, Gemmiger formicilis, Ruminococcus bromii, Bifidobacterium adolescentis, Lactobacillus ruminis, Butyricicoccus pullicaerocum, Collinsella aerofaciens, Ruminococcus callidledikans, and Dorea formicians in the healthy controls compared with the MIS-C group. The most abundant species in the MIS-C group were Bacteroides uniformis, Bacteroides plebeius, Clostridium ramosum, Eubacterium dolichum, Eggerthella lenta, Bacillus thermoamylovorans, Prevotella tannerae, and Bacteroides coprophilus. The SARS CoV-2 group showed an increase in the relative abundance of Bacteroides coprophilus, Bifidobacterium adolescentis, Dorea formicigenerans, Ruminococcus albus, and Clostridium piliforme. (Fig. 3b)
In this study, a linear discriminant analysis effect size (LEfSe) analysis (LDA threshold value > 2, p < 0.05) was used to determine significant bacterial compositions between groups. The results of the LEfSe analysis in the MIS-C group and the control group are shown in Fig. 4a. At the genus level, in the MIS-C group, Bacteroides, Eggerthella), Prevotella were dominant, whereas Faecalibacterium, Gemmiger, Ruminococcus, Butyricicoccus, Collinsella, Dorea were found to be dominant in the control group. At the species level, Bacteroides uniformis, Bacteroides plebeius, Clostridium ramosum, Eubacterium dolichum, Eggerthella lenta, Bacillus thermoaamylovorans, Prevotella tannerae, Bacteroides coprophilus were most abundant in the MIS-C group. In the control group, Faecalibacterium prausnitzii, Gemmiger formicilis, Bifidobacterium adolescentis, Ruminococcus bromii, Lactobacillus ruminis, Butyricicoccus pullicaerocum, Collinsella aerofaciens, Ruminococcus callidus, and Dorea formicigenerans were found to be dominant (Fig. 4a).
The results of the LEfSe analysis conducted to compare the SARS CoV-2 group and the control group are shown in Fig. 4b. At the genus level, Lachnospiraceae_Clostridium was dominant in the SARS CoV-2 group. Faecalibacterium and Ruminococcus were dominant in the control group. At the species level, in the SARS CoV-2 group, Bacteroides coprophilus, Eubacterium dolichum, Bacteroides uniformis, and Clostridium piliforme were dominant. Faecalibacterium prausnitzii, Ruminococcus callidus, and Lactobacillus ruminis (were dominant in the control group (Fig .4b).
The results of the LEfSe analysis of three groups (MIS-C, SARS CoV-2, and the controls) were alspcompared Bacteroides uniformis, Bacillus thermoaamylovorans, and Eubacterium dolichum were the most abundant species in the MIS-C group at the species level. Bacteroides coprophilus, Bifidobacterium adolescentis, Dorea formicigenerans, Ruminococcus albus, and Clostridium piliforme were the most abundant species in the SARS COV-2 group. In the control group, Faecalibacterium prausnitzii, Gemmiger formicilis, Ruminococcus bromii, Lactobacillus ruminis, Butyricicoccus pullicaerocum, and Ruminococcus callidus were dominant. (Fig. 4c).