Prevalence and Correlates of Vision Impairment and Its Association With Cognitive Impairment Among Older Adults in India: An Epidemiological Study

DOI: https://doi.org/10.21203/rs.3.rs-148852/v1

Abstract

Background

Like other major chronic diseases, vision impairment is an independently associated risk factor of cognitive decline among older individuals. We in this study, aim to investigate what are the predictors of vision impairment in old age and how impaired vision is associated with cognitive impairment among the aging population.

Methods

The present research used data from Building a Knowledge Base on Population Aging in India. The effective sample size for the present study was 9541 older adults. Descriptive statistics and bivariate analysis was used to find the preliminary results. Further, binary logistic regression analysis was been done to fulfil the objective of the study.

Results

About 6 in every 10 older adults had a problem of vision impairment. Further, nearly 60% of older adults had cognitive impairment in India. Diabetes [OR: 1.55, CI: 1.32-1.81], hypertension [OR: 1.60, CI: 1.42-1.80], heart disease [OR: 1.43, CI: 1.16-1.76] and cataract [OR: 5.97, CI: 4.83-7.38] were the risk factors for vision impairment among older adults. It was revealed that the older adults who had vision impairment were 11% significantly more likely to have cognitive impairment when compared with the older adults who do not suffer from vision impairment [OR: 1.11, CI: 1.01-1.23]. Low psychological health [OR: 1.55; CI: 1.36, 1.77], low ADL [OR: 1.80; CI: 1.43, 2.27], low IADL [OR: 1.26; CI: 1.14, 1.40], poor self-rated health [OR: 1.28; CI: 1.15-1.41] and chronic morbidity [OR: 1.27; CI: 1.14, 1.41] were the significant factors for cognitive impairment among older adults in India

Conclusions

Additional efforts in terms of advocacy, availability, affordability, and accessibility especially in a country with a greater illiteracy rate are mandatory to increase the reach of eye-care services and reduce the prevalence of avoidable visual impairment and vision losses that lead to cognitive deficits among the older population.

Background

Cognitive deficit in an aging population is becoming a global concern for health and social policy (H. L. Park, O’Connell, & Thomson, 2003). With advancing age, the incidence of sensory and intellectual loss increases affecting the cognitive functioning among older individuals (Fischer et al., 2016). Globally, the prevalence of moderate to severe vision impairment in older adults has been reported as highest in South Asia (Stevens et al., 2013).

It is shown that the public health burden due to vision impairment is substantial and comparable to that of other major diseases in assessing the health-related quality of life (S. J. Park, Ahn, & Park, 2016). A recent study found that there has been no significant reduction in the amount of preventable visual impairment cases over the last decade (Adelson et al., 2020). A review of clinical and epidemiological studies on causes of vision loss found a strong independent association of hypertension with several eye conditions that ultimately result in visual impairment (Bhargava, Ikram, & Wong, 2012). Further, evidence from population-based studies suggests that a large proportion of vision impairments are attributable to diabetic retinopathy during the first 2 decades of developing diabetes (Chou et al., 2010; Fong et al., 2004). A study based on Global Burden of Disease and available population-based studies worldwide indicate that in 2010, more than 40 percent of blindness and 20 percent of visual impairments in South Asia are caused by cataracts (Khairallah et al., 2015). Other chronic health conditions such as heart disease, stroke, and depression were more likely to be reported by people with vision impairment than those without and were associated with self-rating of poor health status (Crews, Chou, Sekar, & Saaddine, 2017).

A growing body of literature based on cross-sectional and longitudinal datasets have shown that vision impairment is associated with cognitive decline among the older population (Anstey, Luszcz, & Sanchez, 2001; Davidson & Guthrie, 2019; Spierer, Fischer, Barak, & Belkin, 2016; Woo et al., 2012). Changes in multiple measures of vision such as visual acuity, sensitivity, and visual processing speed have been observed among the aging population, and these changes have been associated with cognitive impairments (Munoz, Stawski, Sliwinski, Smyth, & Macdonald, 2018; Whitson et al., 2018). On the other hand, some studies found no significant association between vision loss and cognitive impairment among older adults (Duron & Hanon, 2008). Thus, whether a visual impairment is accompanied by a decline in cognitive ability remains uncertain. However, a significant association has been found and well-documented between visual impairment and dementia (Davies-Kershaw et al., 2018; Dawes, Wolski, Himmelsbach, Regan, & Leroi, 2019; Lawrence, Murray, Ffytche, & Banerjee, 2009; Luo et al., 2018). Additionally, a wealth of epidemiological studies have indicated that people with age-related eye diseases have a reduced cognitive score compared to those with healthy eyes (Baker et al., 2009; Harrabi et al., 2015; Ong et al., 2012; Woo et al., 2012).

Due to its increased prevalence and greater effect on physical and mental health, cognitive impairment deserves special attention among all chronic conditions. However, unlike other major chronic diseases, vision impairment as an independently associated risk factor of cognitive decline among older individuals is often overlooked by investigators and policymakers. Thus, we aim to investigate what are the predictors of vision impairment in old age and how impaired vision is associated with cognitive impairment among Indian older adults.

Data And Methods

Data

The present study used data from Building a Knowledge Base on Population Aging in India (BKPAI) which was a national-level survey and was conducted in 2011, across seven states of India (UNFPA, 2012). The survey was sponsored by Tata Institute for social sciences (TISS), Mumbai, Institute for social and economic change (ISEC), Bangalore, United Nations Population Fund (UNFPA), New Delhi and Institute for economic growth (IEG), Delhi. The survey gathered information on various socio-economic and health aspects of aging among households of those aged 60 years and above. Seven regionally representative states were selected for the survey with the highest 60 + year’s population than the national average. This survey was carried out on a representative sample in the northern, western, eastern, and southern parts of India following a random sampling process. The urban and rural samples within each state were drawn separately. The primary sampling units (PSUs) in the rural areas were villages, whereas the urban wards were the PSUs in the urban areas. First, villages were classified into different strata based on population size, and the number of PSUs to be selected was determined in proportion to the population size of each stratum. Using probability proportional to population size (PPS) technique, the PSUs were selected and within each selected PSU, elderly households were selected using systematic sampling. A similar procedure was applied for drawing samples from urban areas. Being a survey of the older, the sample size was equally split between urban and rural areas, irrespective of the proportion of the urban and rural population. The respondents to the Household Schedule included any usual resident member above the age of 15 years, while in the case of the Individual Schedule all those aged 60 and above in the sampled households were the respondents and were interviewed. However, a total of 8,329 households were interviewed and among them, 9,852 older adults’ interviews were conducted. Further details on the sampling procedure, the sample size is available in national and state reports of BKPAI, 2011 (UNFPA, 2012). For the current study, the effective sample size was 9541 older adults residing in seven states aged 60 + years were selected.

Variable description

Outcome variable

There were two outcome variables in the study. The first outcome variable was visual impairment which was derived from the question of whether older adults were having any difficulty in vision which was recoded as 0 “no” and 1 “yes”.

The second outcome variable was cognitive impairment. Cognitive impairment was measured by the number of words recalled. To measure cognitive impairment a scale of 0 to 10 was prepared representing higher the score lower the cognitive impairment. The words used were Bus, House, Chair, Banana, Sun, Bird, Cat, Saree, Rice, and Monkey. Five or more words were recoded as 0 “low” representing lower cognitive impairment and a score of four or less was recoded as 1 “high” representing higher cognitive impairment (Joe, Perkins, & Subramanian, 2019; Skirbekk, Loichinger, & Weber, 2012; Srivastava & Muhammad, 2020). High cognitive impairment represents cognitive disability among older adults in the present study. Place of Residence was categorized as rural and urban. The study was stratified into rural and urban. However, during multivariate analysis place of residence was used as a control variable to see the adjusted effects.

Explanatory variables

The explanatory variables were derived from the literature. Diabetes, Hypertension Stroke, Heart disease, and Cataract was recoded as recoded as no and yes.

The 12-item version of the General Health Questionnaire (GHQ-12) was used as a measure of low psychological health. Psychological health was having a scale of 0 to 12 based on experiencing stressful symptoms and was recoded as 0 “high” (representing 6 + scores) and 1 “low” (representing score 5 and less) (Jacob, Bhugra, & Mann, 1997; Shidhaye & Patel, 2010; Srivastava & Muhammad, 2020). The low psychological health represents lower levels of psychological health or psychological distress among older adults (Cronbach alpha: 0.90). Ability to do activities of daily living was having a scale of 0 to 6 wherein it represents higher the score higher the independence. A score of was categorized as 0 “high” which represents full independence and 5 and less was categorized as 1 “low” which represents not fully independent to do activities of daily living (Cronbach Alpha: 0.93). The ability to do instrumental activities of daily living was having a scale of 0 to 8 representing higher the score higher the independence. A score of 6 + was categorized as 0 “high” representing high IADL and a score of 5 and less was recoded as 1 “low” representing low IADL (Arokiasamy, Uttamacharya, Kowal, & Chatterji, 2016; Joe et al., 2019; Muhammad & Srivastava, 2020). The International Classification of Functioning, Disability, and Health (ICF) proposed the framework on which ADL and IADL were calculated. The Activities of Daily Living (ADL) is an umbrella term relating to self-care, comprising those activities that people undertake routinely in their everyday life. The activities can be subdivided into personal care or ADL and domestic and community activities or Instrumental ADL (IADL). The ADL and IADL have emerged as the most common approaches in empirical assessments of functionality among the elderly and are considered to be befitting to the ICF framework (Saleeby, 2016). Self-rated health was having a scale of 1 to 5 “poor to excellent” and was categorized as 0 “good” (representing good, very good, and excellent) and 1 “poor” (representing poor or fair) (Srivastava, Chauhan, & Patel, 2020). Chronic morbidity was categorized as 0 “no” and 1 “yes” (Srivastava & Gill, 2020).

Age was recoded as 60–69 years, 70–79 years and 80 + years, gender was recoded as men and women, marital status was recoded as not in a marital union and currently in the union, educational status was recoded as no education, below five years, 6–10 years and 11 + years, working status (last one year) was recoded as no, yes and retired. Living arrangement was recoded as living alone and co-residing (with spouse or children or others). Community involvement was generated using the following questions: a. attended a public meeting in the last 11 months with a discussion on the local, community, or political affairs; b. Have attended any group, club, society, union, or organizational meetings in the last 11 months; c. Have worked with other people in the neighbourhood to fix or improve something in the last 11 months; d. Have attended or participated in any religious programs/services etc. (not including weddings and funerals) in last 11 months; and e. Have gone out of the house for visiting friends or relatives in the last 11 months. The responses were never, rarely, occasionally, and frequently. They were coded as 0 “never” and 1 “rarely/occasionally/frequently” A scale of 0–5 was generated and was coded as 0 “no community involvement” and 1–4 were coded as 1 “community involvement”. Trust over someone was assessed using the question “do you have someone you can trust and confide in?” was recoded as 0 “yes” and 1 “no”.

Wealth status was based on three quintiles i.e. poor, middle, and rich. The wealth index drawn based on the BKPAI survey is based on the following 30 assets and housing characteristics: household electrification; drinking water source; type of toilet facility; type of house; cooking fuel; house ownership; ownership of a bank or post-office account; and ownership of a mattress, a pressure cooker, a chair, a cot/bed, a table, an electric fan, a radio/transistor, a black and white television, a colour television, a sewing machine, a mobile telephone, any landline phone, a computer, internet facility; a refrigerator, a watch or clock, a bicycle, a motorcycle or scooter, an animal-drawn cart, a car, a water pump, a thresher and a tractor (UNFPA, 2012). The range of index was from poorest to the richest i.e. ranging from lowest to the highest. Religion was recoded as Hindu, Muslim, Sikhs, and others, caste was recoded as Scheduled Caste/Scheduled Tribe (SC/ST) and non-SC/ST which includes OBC and others. The Scheduled Caste include “untouchables”; a group of the population that is socially segregated and financially/economically by their low status as per Hindu caste hierarchy. The Scheduled Castes (SCs) and Scheduled Tribes (STs) are among the most disadvantaged socio-economic groups in India. The OBC is the group of people who were identified as “educationally, economically and socially backward”. The OBC’s are considered low in the traditional caste hierarchy but are not considered untouchables. The “other” caste category is identified as having a higher social status (Subramanian, Nandy, Irving, Gordon, & Smith, 2005). The residence was recoded as rural and urban. Data was collected in seven states of India to make it representable i.e., Himachal Pradesh, Punjab, West Bengal, Odisha, Maharashtra, Kerala, and Tamil Nadu.

Statistical analysis

Descriptive statistics and bivariate analysis was used to find the preliminary results. Further, binary logistic regression analysis (Osborne & King, 2011) was been done to fulfil the objective of the study. The outcome variables were vision impairment (no and yes) and cognitive impairment (low and high). The results were presented in the form of odds ratio (OR) with a 95% confidence interval (CI).

The model is usually put into a more compact form as follows:

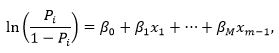
Where β0,... . .,βM are regression coefficients indicating the relative effect of a particular explanatory variable on the outcome variable. These coefficients change as per the context in the analysis in the study. STATA 14 was used for the analysis purpose (StataCorp, 2015).

Results

Table 1 represents the socio-demographic profile of older adults. It was revealed that about 10% of older adults suffered from diabetes while the older adults who suffered from hypertension were about 21%. Almost 1% of older adults suffered from a stroke while only 6% of older adults suffered from heart diseases. About 13% of the older adults had cataracts. Nearly 23% of older adults had low psychological health. Older adults with low Activities of Daily Living (ADL) and Instrumental Activities of Daily Living (IADL) were nearly 7% and 57% respectively. Nearly 55% of older adults had poor self-rated health (SRH). About 65% of older adults suffered from one or more chronic diseases. Nearly 39% of older adults were not in a union as per marital status. About 51% of older adults had no education while 67% of older adults were currently not working. Almost 6% of older adults were living alone and about 21% of older adults had no community involvement. Nearly 17% of older adults had no trust over someone.

Table 2 gives an insight into the distribution and logistic regression estimates of older adults having vision disability by their background characteristics. It was found that the odds of vision impairment were significantly high among older adults with diabetes in comparison to older adults who do not have diabetes [OR: 1.55, CI: 1.32–1.81]. Older adults with hypertension were 60% significantly more like to have vision impairment in comparison to the older adults who do not suffer from hypertension [OR: 1.60, CI: 1.42–1.80]. Older adults who suffered from stroke were 6% less likely to have visual impairments in comparison to the older adults who have not suffered from stroke [OR: 0.94, CI: 0.57–1.57]. The odds of vision impairment were significantly high among older adults with heart disease in comparison to older adults who do not have heart disease[OR: 1.43, CI: 1.16–1.76]. Older adults with cataracts were almost six times significantly more like to have vision impairment in comparison to those who do not have cataract [OR: 5.97, CI: 4.83–7.38]. Older adults in the age group 80 + were almost 2.4 times significantly more likely to have vision impairment [OR: 2.41, CI: 2.02–2.88] while older adults among the age group 70–79 were 66% significantly more likely to have vision impairment compared to the 60–69 years age group [OR: 1.66, CI: 1.49–1.85]. The odds of vision impairment was significantly low among the older adults who were currently in the marital union as per marital status [OR: 0.88, CI: 0.79–0.99]. Older adults who had living arrangements as co resided were 13% significantly less likely to suffer from vision impairment compared to those who lived alone [OR: 0.77, CI: 0.63–0.95]. The odds of vision impairment was significantly high among older adults from the rich wealth quintile as compared to older adults from the poor wealth quintile [OR: 1.18, CI: 1.03–1.36].

Table 3 is a representation of the distribution and logistic regression of older adults having cognitive impairment. It revealed that the older adults who had vision impairment were 11% significantly more likely to have cognitive impairment when compared with the older adults who do not suffer from vision impairment [OR: 1.11, CI: 1.01–1.23]. The odds of cognitive impairment were significantly high among older adults with low psychological health issues [OR: 1.55, CI: 1.36–1.77]. The older adults with low ADL and IADL were 80% and 26% significantly more likely to have cognitive impairment respectively in comparison to older adults with high ADL and IADL [OR: 1.80, CI: 1.43–2.27], [OR: 1.26, CI: 1.14–1.40]. The odds of cognitive impairment among older adults with poor self-rated health (SRH) was significantly high [OR: 1.28, CI: 1.15–1.41]. The older adults with chronic morbidity were 27% significantly more likely to have cognitive impairment compared to older adults who do not have chronic morbidity [OR: 1.27, CI: 1.14–1.41]. The older adults who were currently in a union as per marital status were 9% less likely to have cognitive impairment. The odds of cognitive impairment among older adults who had living arrangements as co resided was high [OR: 1.01, CI: 0.81–1.25] while among older adults who had community involvement was significantly low [OR: 0.79, CI: 0.69–0.9]. The older adults who had trust over someone were 22% significantly less likely to have cognitive impairment in comparison to the older adults who do not have trust over someone [OR: 0.78, CI: 0.68–0.89].

Discussion

A higher prevalence of chronic conditions such as diabetes, hypertension, and heart disease consistent with past studies, is strongly associated with vision impairment among older people (Crews et al., 2017). Consistently, the present study found that vision impairment is significant associated with reporting diabetes among older individuals. Again, studies have found patients with diabetes militias to be at an increased risk of developing vascular dementia and Alzheimer’s disease (Arvanitakis, Wilson, Bienias, Evans, & Bennett, 2004; Exalto, Whitmer, Kappele, & Biessels, 2012; Peila, Rodriguez, & Launer, 2002). Hence, establishing a link that relates diabetes and vision impairment with cognitive functioning is required that may allow more effective screening for and prevention of vision impairment and/or cognitive decline to be developed in the future.

Vision impairment as a post-stroke disability has been well-acknowledged in the literature (Sand et al., 2013, 2016). Concordant with past studies that have shown that people who experienced a stroke were at higher risk of visual defects than people without experiencing stroke (Suchoff et al., 2008), results of the present study showed that stroke is significantly associated with visual impairment among older adults. Further, clinical studies found that high blood pressure increases the risk of developing diabetic retinopathy and other retinal vascular diseases (Duke-Elder, 2007; Wong et al., 2001). In line with this, we found a significant association of hypertension with vision impairment among the study participants. Moreover, multiple studies have found that compared with older adults who have normal vision, visually impaired persons had higher chances to have heart diseases and cardiovascular mortality (Dianed Zheng et al., 2012; Evans et al., 2002; Hsueh et al., 2019; Liew, Wong, Mitchell, Cheung, & Wang, 2009). Similarly, the present study found a significant positive association of heart disease with reporting visual impairment in the older participants.

Cataracts are found to be the leading cause of blindness and visual impairment worldwide, especially in developing countries (Bourne et al., 2013). A meta-analysis of all available population-based studies found that the highest percentages of visual impairment caused by cataracts were recorded in the South Asian region (Khairallah et al., 2015). The present analysis also shows that after controlling for socio-demographic variables, the chances of reporting vision impairment among older adults who had cataracts were almost six times higher than their counterparts. Although cataracts and resultant impairment cases can be avoided with early detection and timely intervention, the delivery of surgical interventions continues to be a challenge in developing countries (Khanna, Pujari, & Sangwan, 2011).

On the other hand, vision impairment among aging populations is closely associated with their cognitive and behavioral manifestations (Clemons, Rankin, & McBee, 2006). Consistently, our results suggested a significant relationship between visual and cognitive impairment, an association not previously demonstrated in any population-based studies in India. Findings from several cross-sectional and longitudinal studies in other countries, however, support such an association (Anstey et al., 2001; Davies-Kershaw et al., 2018; Luo et al., 2018; Mandas et al., 2014). Another Japanese study found that older adults with both impaired vision and hearing had higher odds of cognitive impairment (Mitoku, Masaki, Ogata, & Okamoto, 2016). Further, such studies suggested that better visual acuity by means of cataract surgery or refractive correction and wearing glasses seem to correlate with better cognitive functioning (Albers et al., 2015; Rogers & Langa, 2010; Spierer et al., 2016; Tamura et al., 2004). Contrarily, some of them found that vision-enhancing interventions did not lead to short-term improvements in functioning or cognitive status (Elliott, McGwin, & Owsley, 2009).

While the strength of this study is that it uses data from a large, nationally representative, population-based survey to examine a comprehensive list of chronic conditions in conjunction with vision impairment and its association with a cognitive deficit, it is subject to several limitations. First, the data is cross-sectional in nature; we, therefore, cannot confirm whether a cognitive decline preceded vision impairment or vision impairment preceded a cognitive deficit, and we cannot infer causality between chronic illnesses and vision impairment. Second, the data excludes people living in nursing homes and other institutional settings, who may report higher rates of vision impairment. Third, the vision question in BKPAI is a self-reported measure of function and does not capture the severity of vision problems or different eye diseases.

Conclusion

The results underscore the risk of vision impairment in older ages as a public health burden compared with other major chronic diseases and the importance of normal vision for healthy brain aging. Additional efforts in terms of advocacy, availability, affordability, and accessibility especially in a country with a greater illiteracy rate are mandatory to increase the reach of eye-care services and reduce the prevalence of avoidable visual impairment and vision losses that lead to cognitive deficits among the older population.

Research and programs must consider the strategies to include people with both vision and cognitive impairment along with chronic illnesses in efforts to reduce the burden of aging and chronic conditions. Further, other causes of visual impairments should be explored using longitudinal studies and the clinical investigation is warranted to understand the underlying pathophysiology linking visual impairment and cognitive decline in aging populations.

Abbreviations

OR

Odds Ratio

CI

Confidence Interval

SC

Scheduled Caste

ST

Scheduled Tribe

ADL

Activities of daily living

IADL

Instrumental activities of daily living

GHQ

General Health Questionnaire

BKPAI

Building a Knowledge Base on Population Aging in India

PSU

Primary Sampling Units

PPS

Probability Proportional to Size

Declarations

Ethics approval and consent to participate: The data is freely available in the public domain and survey agencies that conducted the field survey for the data collection have collected prior consent from the respondent. No ethical approval was required as the data was freely available through a request from http://www.isec.ac.in/.

Consent for publication: Not applicable

Availability of data and materials: The study utilizes a secondary source of data that is freely available in public domain through request from http://www.isec.ac.in/.

Competing Interests: The authors declare that they have no competing interests.

Funding: Authors did not received any funding to carry out this research.

Author’s Contribution: The concept was drafted by MT; SS contributed to the analysis design, SS and MT advised on the paper and assisted in paper conceptualization. DD and MT contributed to the comprehensive writing of the article. All authors read and approved the final manuscript.

Acknowledgements: Not applicable

Author’s Information:

Muhammad T completed his M.Phil. in Population Studies and currently pursuing his Ph.D. in Population Studies at International Institute for Population Sciences, Mumbai, India.

Drishti Drishti completed her MPS in Population Studies from International Institute for Population Sciences, Mumbai, India.

Shobhit Srivastava completed his M.Phil. in Population Studies and currently pursuing his Ph.D. in Population Studies at International Institute for Population Sciences, Mumbai. His area of interest is ageing and Mental Health issues among older adults, India.

References

  1. Adelson, J. D., Bourne, R. R. A., Briant, P. S., Flaxman, S. R., Taylor, H. R. B., Jonas, J. B., … Vos, T. (2020). Causes of blindness and vision impairment in 2020 and trends over 30 years, and prevalence of avoidable blindness in relation to VISION 2020: the Right to Sight: an analysis for the Global Burden of Disease Study. The Lancet Global Health, (20). https://doi.org/10.1016/s2214-109x(20)30489-7
  2. Albers, M. W., Gilmore, G. C., Kaye, J., Murphy, C., Wingfield, A., Bennett, D. A., … Zhang, L. I. (2015). At the interface of sensory and motor dysfunctions and Alzheimer’s disease. Alzheimer’s and Dementia, 11(1), 70–98. https://doi.org/10.1016/j.jalz.2014.04.514
  3. Anstey, K. J., Luszcz, M. A., & Sanchez, L. (2001). Two-year decline in vision but not hearing is associated with memory decline in very old adults in a population-based sample. Gerontology, 47(5), 289–293. https://doi.org/10.1159/000052814
  4. Arokiasamy, P., Uttamacharya, Kowal, P., & Chatterji, S. (2016). Age and Socioeconomic Gradients of Health of Indian Adults: An Assessment of Self-Reported and Biological Measures of Health. Journal of Cross-Cultural Gerontology, 31(2), 193–211. https://doi.org/10.1007/s10823-016-9283-3
  5. Arvanitakis, Z., Wilson, R. S., Bienias, J. L., Evans, D. A., & Bennett, D. A. (2004). Diabetes Mellitus and Risk of Alzheimer Disease and Decline in Cognitive Function. Archives of Neurology, 61(5), 661–666. https://doi.org/10.1001/archneur.61.5.661
  6. Baker, M. L., Wang, J. J., Rogers, S., Klein, R., Kuller, L. H., Larsen, E. K., & Wong, T. Y. (2009). Early Age-Related Macular Degeneration, Cognitive Function, and Dementia. JAMA - Journal of the American Medical Association, 127(5), 667–673.
  7. Bhargava, M., Ikram, M. K., & Wong, T. Y. (2012). How does hypertension affect your eyes. Journal of Human Hypertension, 26(2), 71–83. https://doi.org/10.1038/jhh.2011.37
  8. Bourne, R. R. A., Stevens, G. A., White, R. A., Smith, J. L., Flaxman, S. R., Price, H., … Taylor, H. R. (2013). Causes of vision loss worldwide, 1990-2010: A systematic analysis. The Lancet Global Health, 1(6), 339–349. https://doi.org/10.1016/S2214-109X(13)70113-X
  9. Chou, C., Cotch, M. F., Geiss, L. S., Gregg, E. W., Albright, A. L., Klein, B. E. K., & Klein, R. (2010). Prevalence of Diabetic Retinopathy in the United States , 2005-2008. 304(6), 2005–2008.
  10. Clemons, T. E., Rankin, M. W., & McBee, W. L. (2006). Cognitive impairment in the age-related eye disease study: AREDS report no. 16. Archives of Ophthalmology, 124(4), 537–543. https://doi.org/10.1001/archopht.124.4.537
  11. Crews, J. E., Chou, C. F., Sekar, S., & Saaddine, J. B. (2017). The Prevalence of Chronic Conditions and Poor Health Among People With and Without Vision Impairment, Aged ≥65 Years, 2010–2014. American Journal of Ophthalmology, 182, 18–30. https://doi.org/10.1016/j.ajo.2017.06.038
  12. Davidson, J. G. S., & Guthrie, D. M. (2019). Older Adults With a Combination of Vision and Hearing Impairment Experience Higher Rates of Cognitive Impairment, Functional Dependence, and Worse Outcomes Across a Set of Quality Indicators. Journal of Aging and Health, 31(1), 85–108. https://doi.org/10.1177/0898264317723407
  13. Davies-Kershaw, H. R., Hackett, R. A., Cadar, D., Herbert, A., Orrell, M., & Steptoe, A. (2018). Vision Impairment and Risk of Dementia: Findings from the English Longitudinal Study of Ageing. Journal of the American Geriatrics Society, 66(9), 1823–1829. https://doi.org/10.1111/jgs.15456
  14. Dawes, P., Wolski, L., Himmelsbach, I., Regan, J., & Leroi, I. (2019). Interventions for hearing and vision impairment to improve outcomes for people with dementia: A scoping review. International Psychogeriatrics, 31(2), 203–221. https://doi.org/10.1017/S1041610218000728
  15. Dianed Zheng, D., Christ, S. L., Lam, B. L., Arheart, K. L., Galor, A., & Lee, D. J. (2012). Increased mortality risk among the visually impaired: The roles of mental well-being and preventive care practices. Investigative Ophthalmology and Visual Science, 53(6), 2685–2692. https://doi.org/10.1167/iovs.11-8794
  16. Duke-Elder, S. (2007). The eye in Hypertension. Lancet, 369(1), 425–435. https://doi.org/10.1136/bmj.2.5459.468
  17. Duron, E., & Hanon, O. (2008). Vascular risk factors, cognitve decline, and dementia. Vascular Health and Risk Management, 4(2), 363–381. https://doi.org/10.2147/vhrm.s1839
  18. Elliott, A. F., McGwin, G., & Owsley, C. (2009). Vision-enhancing interventions in nursing home residents and their short-term effect on physical and cognitive function. Journal of the American Geriatrics Society, 57(2), 202–208. https://doi.org/10.1111/j.1532-5415.2008.02099.x
  19. Evans, J. R., Fletcher, A. E., Wormald, R. P. L., Ng, E. S. W., Stirling, S., Smeeth, L., … Tulloch, A. (2002). Prevalence of visual impairment in people aged 75 years and older in Britain: Results from the MRC trial of assessment and management of older people in the community. British Journal of Ophthalmology, 86(7), 795–800. https://doi.org/10.1136/bjo.86.7.795
  20. Exalto, L. G., Whitmer, R. A., Kappele, L. J., & Biessels, G. J. (2012). An update on type 2 diabetes, vascular dementia and Alzheimer’s disease. Experimental Gerontology, 47(11), 858–864. https://doi.org/10.1016/j.exger.2012.07.014
  21. Fischer, M. E., Cruickshanks, K. J., Schubert, C. R., Pinto, A. A., Carlsson, C. M., Klein, B. E. K., … Tweed, T. S. (2016). Age-Related Sensory Impairments and Risk of Cognitive Impairment. Journal of the American Geriatrics Society, 64(10), 1981–1987. https://doi.org/10.1111/jgs.14308
  22. Fong, D. S., Aiello, L., Gardner, T. W., King, G. L., Blankenship, G., Cavallerano, J. D., … Klein, R. (2004). Retinopathy in Diabetes. Diabetes Care, 27(SUPPL. 1). https://doi.org/10.2337/diacare.27.2007.s84
  23. Harrabi, H., Kergoat, M. J., Rousseau, J., Boisjoly, H., Schmaltz, H., Moghadaszadeh, S., … Freeman, E. E. (2015). Age-related eye disease and cognitive function. Investigative Ophthalmology and Visual Science, 56(2), 1217–1221. https://doi.org/10.1167/iovs.14-15370
  24. Hsueh, C. M., Wey, J. H., Yeh, J. S., Wu, C. H., Liou, T. H., & Chang, K. H. (2019). Incidence and risk of major heart diseases in middle-Aged adults with moderate to severe vision impairment: A population-based cohort study. British Journal of Ophthalmology, 103(8), 1054–1059. https://doi.org/10.1136/bjophthalmol-2018-312471
  25. Jacob, K. S., Bhugra, D., & Mann, A. H. (1997). General health questionnaire -12 : Psychometric properties and factor structure among Indian women living in the United Kingdom. Indian Journal of Psychiatry, 39(3), 196–199.
  26. Joe, W., Perkins, J. M., & Subramanian, S. V. (2019). Community involvement, trust, and health-related outcomes among older adults in India: A population-based, multilevel, cross-sectional study. Age and Ageing, 48(1), 87–93. https://doi.org/10.1093/ageing/afy154
  27. Khairallah, M., Kahloun, R., Bourne, R., Limburg, H., Flaxman, S. R., Jonas, J. B., … Taylor, H. R. (2015). Number of people blind or visually impaired by cataract worldwide and in world regions, 1990 to 2010. Investigative Ophthalmology and Visual Science, 56(11), 6762–6769. https://doi.org/10.1167/iovs.15-17201
  28. Khanna, R., Pujari, S., & Sangwan, V. (2011). Cataract surgery in developing countries. Current Opinion in Ophthalmology, 22(1), 10–14. https://doi.org/10.1097/ICU.0b013e3283414f50
  29. Lawrence, V., Murray, J., Ffytche, D., & Banerjee, S. (2009). “Out of sight, out of mind”: A qualitative study of visual impairment and dementia from three perspectives. International Psychogeriatrics, 21(3), 511–518. https://doi.org/10.1017/S1041610209008424
  30. Liew, G., Wong, T. Y., Mitchell, P., Cheung, N., & Wang, J. J. (2009). Retinopathy predicts coronary heart disease mortality. Heart, 95(5), 391–394. https://doi.org/10.1136/hrt.2008.146670
  31. Luo, Y., He, P., Guo, C., Chen, G., Li, N., & Zheng, X. (2018). Association Between Sensory Impairment and Dementia in Older Adults: Evidence from China. Journal of the American Geriatrics Society, 66(3), 480–486. https://doi.org/10.1111/jgs.15202
  32. Mandas, A., Mereu, R. M., Catte, O., Saba, A., Serchisu, L., Costaggiu, D., … Dessì, S. (2014). Cognitive impairment and age-related vision disorders: Their possible relationship and the evaluation of the use of aspirin and statins in a 65 years-and-over Sardinian population. Frontiers in Aging Neuroscience, 6(OCT), 1–9. https://doi.org/10.3389/fnagi.2014.00309
  33. Mitoku, K., Masaki, N., Ogata, Y., & Okamoto, K. (2016). Vision and hearing impairments, cognitive impairment and mortality among long-term care recipients: A population-based cohort study. BMC Geriatrics, 16(1), 1–7. https://doi.org/10.1186/s12877-016-0286-2
  34. Muhammad, T., & Srivastava, S. (2020). Why Rotational Living Is Bad for Older Adults? Evidence from a Cross-Sectional Study in India. Journal of Population Ageing, 1. https://doi.org/10.1007/s12062-020-09312-4
  35. Munoz, E., Stawski, R. S., Sliwinski, M. J., Smyth, J. M., & Macdonald, S. W. S. (2018). Ac c ep us cr ip t Ac c ep te cr t. 2010–2017.
  36. Ong, S. Y., Cheung, C. Y., Li, X., Lamoureux, E. L., Ikram, M. K., Ding, J., … Wong, T. Y. (2012). Visual impairment, age-related eye diseases, and cognitive function: The Singapore Malay Eye Study. Archives of Ophthalmology, 130(7), 895–900. https://doi.org/10.1001/archophthalmol.2012.152
  37. Osborne, J., & King, J. E. (2011). Binary Logistic Regression. In Best Practices in Quantitative Methods (pp. 358–384). https://doi.org/10.4135/9781412995627.d29
  38. Park, H. L., O’Connell, J. E., & Thomson, R. G. (2003). A systematic review of cognitive decline in the general elderly population. International Journal of Geriatric Psychiatry, 18(12), 1121–1134. https://doi.org/10.1002/gps.1023
  39. Park, S. J., Ahn, S., & Park, K. H. (2016). Burden of visual impairment and chronic diseases. JAMA Ophthalmology, 134(7), 778–784. https://doi.org/10.1001/jamaophthalmol.2016.1158
  40. Peila, R., Rodriguez, B. L., & Launer, L. J. (2002). Type 2 diabetes, APOE gene, and the risk for dementia and related pathologies: The Honolulu-Asia Aging Study. Diabetes, 51(4), 1256–1262. https://doi.org/10.2337/diabetes.51.4.1256
  41. Rogers, M. A. M., & Langa, K. M. (2010). Untreated poor vision: A contributing factor to late-life dementia. American Journal of Epidemiology, 171(6), 728–735. https://doi.org/10.1093/aje/kwp453
  42. Saleeby, P. W. (2016). An introduction to the International Classification of Functioning, Disability and Health (ICF). International Journal on Disability and Human Development. https://doi.org/10.1515/ijdhd-2015-0027
  43. Sand, K. M., Midelfart, A., Thomassen, L., Melms, A., Wilhelm, H., & Hoff, J. M. (2013). Visual impairment in stroke patients - a review. Acta Neurologica Scandinavica, 127(S196), 52–56. https://doi.org/10.1111/ane.12050
  44. Sand, K. M., Wilhelmsen, G., Næss, H., Midelfart, A., Thomassen, L., & Hoff, J. M. (2016). Vision problems in ischaemic stroke patients: Effects on life quality and disability. European Journal of Neurology, 23, 1–7. https://doi.org/10.1111/ene.12848
  45. Shidhaye, R., & Patel, V. (2010). Association of socio-economic, gender and health factors with common mental disorders in women: A population-based study of 5703 married rural women in India. International Journal of Epidemiology, 39(6), 1510–1521. https://doi.org/10.1093/ije/dyq179
  46. Skirbekk, V., Loichinger, E., & Weber, D. (2012). Variation in cognitive functioning as a refined approach to comparing aging across countries. Proceedings of the National Academy of Sciences of the United States of America, 109(3), 770–774. https://doi.org/10.1073/pnas.1112173109
  47. Spierer, O., Fischer, N., Barak, A., & Belkin, M. (2016). Correlation between vision and cognitive function in the elderly: A cross-sectional study. Medicine (United States), 95(3), 1–5. https://doi.org/10.1097/MD.0000000000002423
  48. Srivastava, S., Chauhan, S., & Patel, R. (2020). Socio-Economic Inequalities in the Prevalence of Poor Self-Rated Health among Older Adults in India from 2004 to 2014 : A Decomposition Analysis.
  49. Srivastava, S., & Gill, A. (2020). Untreated morbidity and treatment-seeking behaviour among the elderly in India: Analysis based on National Sample Survey 2004 and 2014. SSM - Population Health, 100557. https://doi.org/10.1016/j.ssmph.2020.100557
  50. Srivastava, S., & Muhammad, T. (2020). Violence and associated health outcomes among older adults in India : A gendered perspective. SSM - Population Health, 12, 100702. https://doi.org/10.1016/j.ssmph.2020.100702
  51. StataCorp. (2015). Stata: Release 14. Statistical Software. In College Station, TX: StataCorp LP.
  52. Stevens, G. A., White, R. A., Flaxman, S. R., Price, H., Jonas, J. B., Keeffe, J., … Bourne, R. R. A. (2013). Global prevalence of vision impairment and blindness: Magnitude and temporal trends, 1990-2010. Ophthalmology, 120(12), 2377–2384. https://doi.org/10.1016/j.ophtha.2013.05.025
  53. Subramanian, S. V, Nandy, S., Irving, M., Gordon, D., & Smith, G. D. (2005). Role of socioeconomic markers and state prohibition policy in predicting alcohol consumption among men and women in India : a multilevel statistical analysis. Bulletin of the World Health Organization, 019893(04).
  54. Suchoff, I. B., Kapoor, N., Ciuffreda, K. J., Rutner, D., Han, E., & Craig, S. (2008). The frequency of occurrence, types, and characteristics of visual field defects in acquired brain injury: A retrospective analysis. Optometry, 79(5), 259–265. https://doi.org/10.1016/j.optm.2007.10.012
  55. Tamura, H., Tsukamoto, H., Mukai, S., Kato, T., Minamoto, A., Ohno, Y., … Mishima, H. K. (2004). Improvement in cognitive impairment after cataract surgery in elderly patients. Journal of Cataract and Refractive Surgery, 30(3), 598–602. https://doi.org/10.1016/j.jcrs.2003.10.019
  56. UNFPA. (2012). Report on the status of elderly in selected states of India: Building a knowledge base on ageing in India. Retrieved from http://www.isec.ac.in/AgeingReport_28Nov2012_LowRes-1.pdf
  57. Whitson, H. E., Cronin-Golomb, A., Cruickshanks, K. J., Gilmore, G. C., Owsley, C., Peelle, J. E., … Lin, F. R. (2018). American Geriatrics Society and National Institute on Aging Bench-to-Bedside Conference: Sensory Impairment and Cognitive Decline in Older Adults. Journal of the American Geriatrics Society, 66(11), 2052–2058. https://doi.org/10.1111/jgs.15506
  58. Wong, T. Y., Klein, R., Klein, B. E. K., Tielsch, J. M., Hubbard, L., & Nieto, F. J. (2001). Retinal microvascular abnormalities and their relationship with hypertension, cardiovascular disease, and mortality. Survey of Ophthalmology, 46(1), 59–80. https://doi.org/10.1016/S0039-6257(01)00234-X
  59. Woo, S. J., Park, K. H., Ahn, J., Choe, J. Y., Jeong, H., Han, J. W., … Kim, K. W. (2012). Cognitive impairment in age-related macular degeneration and geographic atrophy. Ophthalmology, 119(10), 2094–2101. https://doi.org/10.1016/j.ophtha.2012.04.026

Tables

Table-1 Socio-demographic profile of older adults in India

Background characteristics
Sample
Percentage
Diabetes
   
No
8,570
89.8
Yes
971
10.2
Hypertension
   
No
7,520
78.8
Yes
2,021
21.2
Stroke
   
No
9,448
99.0
Yes
93
1.0
Heart disease
   
No
8,991
94.2
Yes
550
5.8
Cataract
   
No
8,305
87.1
Yes
1,236
13.0
Psychological health
   
High
7,218
76.6
Low
2,209
23.4
ADL
   
High
8,732
92.6
Low
695
7.4
IADL
   
High
4,092
43.4
Low
5,335
56.6
Self-rated health
   
Good
4,212
44.7
Poor
5,215
55.3
Chronic morbidity
   
No
3,320
35.2
Yes
6,107
64.8
Age (years)
   
60–69
5,891
61.8
70–79
2,613
27.4
80+
1,036
10.9
Gender
   
Men
4,526
47.4
Women
5,015
52.6
Marital Status
   
Not in Union
3,758
39.4
Currently in Union
5,783
60.6
Education
   
None
4,870
51.1
Below 5 years
1,955
20.5
6–10 years
2,137
22.4
11 + years
578
6.1
Working status (last one year)
   
No
6,421
67.3
Yes
2,310
24.2
Retired
810
8.5
Living arrangement
   
Alone
561
5.9
Co-reside
8871
94.1
Community involvement
   
No
1,965
20.9
Yes
7,462
79.2
Trust over someone
   
No
1,617
17.2
Yes
7,810
82.9
Wealth Status
   
Poor
4,367
45.8
Middle
1,969
20.6
Rich
3,204
33.6
Religion
   
Hindu
7,572
79.4
Muslim
671
7.0
Sikh
898
9.4
Others
400
4.2
Caste
   
SC/ST
2,510
26.3
Non-SC/ST
7,031
73.7
Residence
   
Rural
7,044
73.8
Urban
2,497
26.2
State
   
Himachal Pradesh
1,470
15.4
Punjab
1,354
14.2
West Bengal
1,127
11.8
Orissa
1,453
15.2
Maharashtra
1,379
14.5
Kerala
1,356
14.2
Tamil Nadu
1,403
14.7
Total
9,541
100.0
SC/ST: Scheduled Caste/Scheduled Tribe; ADL: Activities of Daily Living; IADL: Instrumental Activities of Daily Living


Table-2 Percentage distribution of older adults having vision disability by their background characteristics among older adults

Background characteristics
Vision impairment (%)
p < 0.05
OR (95% CI)
Diabetes
 
*
 
No
57.5
 
Ref.
Yes
72.8
 
1.55*(1.32,1.81)
Hypertension
 
*
 
No
55.1
 
Ref.
Yes
73.8
 
1.60*(1.42,1.80)
Stroke
 
*
 
No
58.9
 
Ref.
Yes
73.6
 
0.94(0.57,1.57)
Heart disease
 
*
 
No
58.1
 
Ref.
Yes
73.8
 
1.43*(1.16,1.76)
Cataract
 
*
 
No
54.4
 
Ref.
Yes
90.6
 
5.97*(4.83,7.38)
Age (years)
 
*
 
60–69
52.7
 
Ref.
70–79
67.0
 
1.66*(1.49,1.85)
80+
75.3
 
2.41*(2.02,2.88)
Gender
     
Men
57.3
 
Ref.
Women
60.6
 
0.98(0.87,1.10)
Marital Status
 
*
 
Not in Union
63.8
 
Ref.
Currently in Union
56.0
 
0.88*(0.79,0.99)
Education
 
*
 
None
59.1
 
Ref.
Below 5 years
63.5
 
1.10(0.97,1.25)
6–10 years
53.0
 
0.90(0.78,1.03)
11 + years
66.0
 
1.31*(1.07,1.62)
Working status
 
*
 
No
62.1
 
Ref.
Yes
53.8
 
0.89(0.79,1.01)
Retired
50.0
 
0.81*(0.68,0.96)
Living arrangement
     
Alone
56.5
 
Ref.
Co-reside
59.2
 
0.77*(0.63,0.95)
Wealth Status
 
*
 
Poor
58.1
 
Ref.
Middle
55.9
 
0.91(0.80,1.04)
Rich
62.3
 
1.18*(1.03,1.36)
Religion
 
*
 
Hindu
57.7
 
Ref.
Muslim
68.6
 
0.98(0.81,1.2)
Sikh
56.2
 
0.74*(0.59,0.93)
Others
73.9
 
1.12(0.87,1.44)
Caste
     
SC/ST
59.0
 
Ref.
Non-SC/ST
59.1
 
1.02(0.91,1.14)
Residence
     
Rural
59.1
 
Ref.
Urban
58.8
 
1.04(0.94,1.15)
State
 
*
 
Himachal Pradesh
48.5
 
Ref.
Punjab
58.8
 
1.30*(1.06,1.59)
West Bengal
79.7
 
3.48*(2.87,4.22)
Orissa
59.8
 
1.55*(1.32,1.83)
Maharashtra
65.0
 
1.74*(1.47,2.06)
Kerala
72.4
 
1.69*(1.41,2.04)
Tamil Nadu
34.1
 
0.58*(0.49,0.69)
Total
59.1
   
SC/ST: Scheduled Caste/Scheduled Tribe; *if p < 0.05; OR: Odds Ratio; CI: Confidence Interval; Ref: Reference


Table-3 Percentage distribution of older adults having cognitive impairment by their background characteristics among older adults

Background characteristics
Cognitive impairment
p < 0.05
OR (95% CI)
Vision impairment
 
*
 
No
51.6
 
Ref.
Yes
65.8
 
1.11*(1.01,1.23)
Psychological health
 
*
 
High
55.0
 
Ref.
Low
76.2
 
1.55*(1.36,1.77)
ADL
 
*
 
High
58.0
 
Ref.
Low
84.6
 
1.80*(1.43,2.27)
IADL
 
*
 
High
49.7
 
Ref.
Low
67.9
 
1.26*(1.14,1.40)
Self-rated health
 
*
 
Good
49.0
 
Ref.
Poor
68.9
 
1.28*(1.15,1.41)
Chronic morbidity
 
*
 
No
51.6
 
Ref.
Yes
64.5
 
1.27*(1.14,1.41)
Age (years)
 
*
 
60–69
53.1
 
Ref.
70–79
68.2
 
1.42*(1.27,1.59)
80+
78.6
 
1.83*(1.52,2.20)
Gender
 
*
 
Men
52.9
 
Ref.
Women
66.4
 
1.1(0.98,1.24)
Marital Status
 
*
 
Not in Union
69.1
 
Ref.
Currently in Union
54.1
 
0.91(0.81,1.02)
Education
 
*
 
None
70.7
 
Ref.
Below 5 years
63.3
 
0.68*(0.6,0.77)
6–10 years
40.5
 
0.43*(0.38,0.50)
11 + years
31.3
 
0.26*(0.21,0.32)
Working status
 
*
 
No
66.0
 
Ref.
Yes
53.0
 
0.88*(0.77,1.00)
Retired
32.6
 
0.71*(0.59,0.85)
Living arrangement
 
*
 
Alone
63.0
 
Ref.
Co-reside
59.8
 
1.01(0.81,1.25)
Community involvement
 
*
 
No
69.8
 
Ref.
Yes
57.4
 
0.79*(0.69,0.9)
Trust over someone
 
*
 
No
68.4
 
Ref.
Yes
58.3
 
0.78*(0.68,0.89)
Wealth Status
 
*
 
Poor
68.1
 
Ref.
Middle
60.0
 
0.89(0.78,1.02)
Rich
48.8
 
0.66*(0.57,0.76)
Religion
 
*
 
Hindu
59.7
 
Ref.
Muslim
66.3
 
0.89(0.73,1.09)
Sikh
56.1
 
0.93(0.74,1.16)
Others
63.4
 
1.24(0.98,1.56)
Caste
 
*
 
SC/ST
67.4
 
Ref.
Non-SC/ST
57.3
 
0.94(0.84,1.06)
Residence
 
*
 
Rural
62.8
 
Ref.
Urban
52.0
 
0.94(0.85,1.04)
State
 
*
 
Himachal Pradesh
54.2
 
Ref.
Punjab
55.2
 
1.14(0.93,1.41)
West Bengal
81.9
 
4.75*(3.84,5.86)
Orissa
69.3
 
1.60*(1.34,1.92)
Maharashtra
55.3
 
1.14(0.96,1.36)
Kerala
66.3
 
2.44*(2.02,2.94)
Tamil Nadu
41.6
 
0.64*(0.53,0.77)
Total
60.0
   
SC/ST: Scheduled Caste/Scheduled Tribe; *if p<0.05; OR: Odds Ratio; CI: Confidence Interval; Ref: Reference