Emerging non-thermal processing techniques are gaining much attention due to their numerous advantages over traditional methods. Thus, in this study, we employed high voltage cold atmospheric plasma (HV-CAP) separately and synergetically with ultrasound on lysozyme to investigate its activity and structure. The HV-CAP was operated at 120, 140, and 160 kV for 3 min at a frequency of 120 Hz. A significant difference was observed between the untreated and both treatments in lysozyme activity, with a more pronounced result in the ultrasound-assisted HV-CAP treatment. Both treatments influenced the tertiary structure of the lysozyme as lipid oxidation, carbonyl content, UV spectra, intrinsic fluorescence, hydrophobicity, and sulfhydryl groups increased with increased voltage. Particle size distribution of lysozyme shows that noncovalent interactions affected the tertiary structure. The effects of both treatments on the secondary structure of lysozyme were demonstrated by FTIR-ATR, CD, and relative molar ellipticity. The results indicated that plasma-generated reactive species and ultrasound-induced cavitation influenced the unfolding of tertiary and secondary structures of the lysozyme. The CD spectra postulated that lysozyme inactivation was closely linked to the α-helices and β-sheets components of the secondary structure. This study presents an original novel knowledge on the modification of activity and structure of lysozyme subjected to ultrasound-assisted HV-CAP treatment that has been missing from the literature.
Research Article
Ultrasound-assisted high voltage cold atmospheric plasma treatment on the inactivation and structure of lysozyme: Effect of treatment voltage
https://doi.org/10.21203/rs.3.rs-1492748/v1
This work is licensed under a CC BY 4.0 License
You are reading this latest preprint version
High voltage cold atmospheric plasma
Ultrasound
Lysozyme
Inactivation
Tertiary structure
Secondary structure
Chicken egg white lysozyme, as a naturally occurring enzyme, is widely employed in pharmaceutical industries owing to its amino acid residues and food industries due to its antimicrobial and preservative effects (Fatkhutdinova et al. 2022; Mañas et al. 2006; Takahashi et al. 2020; Venkataramani et al. 2013; Zhao and Yang 2008; Zhao et al. 2007). Lysozyme is an essential globular monomeric protein consisting of structural elements commonly found in proteins such as α-helical stretches and antiparallel pleated sheets (Venkataramani et al. 2013; Zhao and Yang 2008). Furthermore, the uncomplicatedness of the structure of lysozyme renders it facile to comprehend the alterations in its structure and activity (Zhao et al. 2007). The chemical and physical volatility of lysozyme makes its application difficult in industries (Venkataramani et al. 2013). So, to promote the volatility and activity of lysozyme throughout preparation, preservation, and utilisation, it is imperative to study the relationship between its stability and activity under various experimental settings (Colombié et al. 2001; Venkataramani et al. 2013). Thermal treatment has been extensively applied to inactivate and stabilise lysozyme. However, because lysozyme is sensitive to heat, this treatment can lead to protein denaturation, causing protein aggregation, affecting its activity and stability (Colombié et al. 2001; Mañas et al. 2006; Venkataramani et al. 2013). It is established that the enzyme's activity can be enhanced by changing its structure by employing physical and chemical techniques (Attri et al. 2021).
High voltage cold atmospheric plasma (HV-CAP) is an emerging non-thermal processing technology that has recently gained attention in the scientific world. HV-CAP contains ionised and un-ionised gas generated in an ambient or low-pressure ambience; the gas comprised numerous active species, including reactive oxygen and nitrogen species, electrons, neutral molecules, charged particles, free radicals, and ions (Luo et al. 2021; Nasiru et al. 2022; Umair et al. 2019; Zhang et al. 2020b). HV-CAP treated foods retains and improve their quality attributes susceptible to heat treatment, it has been proven to modify food structure effectively, it is also safe for consumers, and it is friendly to the environment (Attri et al. 2021; Basak and Annapure 2022; Umair et al. 2020). Several investigations have suggested that HV-CAP modifies the structure and activity of food materials, including egg white protein (Baek et al. 2021), banana (Gu et al. 2021), and potato polyphenol oxidase (Kang et al. 2019).
Recently, ultrasound treatment has been a technique of interest to many researchers because of its numerous applications and advantages in the food industry (Han et al. 2021; Spinei and Oroian 2021). It's a green technology that improves the structure of proteins and the quality of many food materials (Cao et al. 2021). It's also regarded as a better, safer, and more efficient food processing method than traditional thermal treatment techniques (Cao et al. 2021). Ultrasound influences food materials by chemically, mechanically, and biologically-induced changes due to cavitation and molecular friction that stimulate the disruption of the product's molecular structure (Cao et al. 2021; Spinei et al. 2021; Zhou et al. 2021). Many studies revealed that ultrasound improves the attributes of proteins such as oat protein (Li and Xiong 2021), myofibrillar protein (Chen et al. 2021), and chicken breast (Cao et al. 2021).
Therefore, this work aims to investigate chicken egg white lysozyme's inactivation and structural changes using two emerging non-thermal techniques of HV-CAP and ultrasound. We aimed to comparatively study the effects of HV-CAP and ultrasound-assisted HV-CAP treatment with respect to treatment voltage variation on the lysozyme.
Materials
Chicken egg white lysozyme (Phygene Scientific Reagent Co. Ltd., Fuzhou, China), Micrococcus lysodeikticus [M. lysodeikticus] (BeNa Culture Collection, Xinyang City, Henan, China), 8-Anilinonaphthalene-1-sulfonic acid [ANS] (Shanghai Macklin Biochemical Co. Ltd., Shanghai, China) 5,5-dithio-bis-(2-nitrobenzoic acid) [DTNB] (Shanghai Ryon Biological Technology Co. Ltd., Shanghai, China).
[ Figure 1 about here]
High voltage cold atmospheric plasma machine
A high voltage cold atmospheric plasma (HV-CAP) machine (Nanjing Suman Plasma Technology Co., Ltd. Nanjing, China) with dielectric barrier discharge (DBD) configuration was employed. A detailed description of the machine was given in our earlier article (Nasiru et al. 2021). The device was operated at three different high voltage power configurations of 120, 140, and 160 kV at a frequency of 120 Hz and a treatment time of 3 min.
Ultrasound device
Ultrasound device (KH5200DE, Kunshan Hechuang Ultrasonic Instrument Co., Ltd., Qingshan Lake Technological City, Hangzhou, China) was used and operated at an intensity of 95 % for 10 min at 4 to pre-treat the lysozyme.
Experimental plan
The effects of ultrasound-assisted HV-CAP on lysozyme activity and its mechanism were evaluated in two groups and a control sample. The first group comprised HV-CAP treated samples, while the second group was pre-treated with ultrasound before HV-CAP treatment. The treated samples were divided as follows:
CK – Control (No HV-CAP or ultrasound pre-treatment)
T1 – 120 kV/120 Hz/3 min
T2 – 140 kV/120 Hz/3 min
T3 – 160 kV/120 Hz/3 min
T4 – 120 kV/120 Hz/3 min + ultrasound pre-treatment
T5 – 140 kV/120 Hz/3 min + ultrasound pre-treatment
T6 – 160 kV/120 Hz/3 min + ultrasound pre-treatment
Ultrasound pre-treatment: 95 %/10 min/4
Lysozyme preparation
Lyophilized chicken egg lysozyme powder was dissolved in sodium phosphate buffer (20 mM, pH 7.6). The protein concentration of lysozyme was 2.12 mg/mL using the Biuret reagent method with Bovine Serum Albumin (BSA) as standard.
Lysozyme activity assay
The turbidimetric assay method was used based on Zhao and Yang (2008). As a substrate, a lyophilized M. lysodeikticus powder (0.36 mg/mL) was dissolved in sodium phosphate buffer (20 mM, pH 7.6). 2.3 mL of the substrate was put in a cuvette for each sample and stored at 25 °C with continual magnetic stirring. Initially, 0.3 mL of lysozyme sample was transferred into a 2.6 mL reaction volume in the cuvette. A decrease in absorbance of mixed M. lysodeikticus suspension was measured at an interval of 0.5 s at 450 nm using a UV-vis spectrophotometer (Shimadzu 2600 UV-vis spectrophotometer, Shimadzu Corporation, Kyoto, Japan). The decrease in absorbance against time was plotted from the absorbance data that was recorded, and the activity of each sample (450/min) was evaluated. An enzyme unit equals to a decrease in turbidity of 0.0001/min at 450 nm; thus, the activity per mL of HV-CAP and ultrasound-assisted HV-CAP treated lysozyme samples were evaluated as below:

Relative residual activity
Lysozyme's relative residual activity (RRA) was calculated as a percentage of HV-CAP, and ultrasound-assisted HV-CAP treated lysozyme solutions activity compared to control. After the activity assay, all samples were stored in ice-bath water at 0 .
[ Figure 2 about here]
Relative protein concentration
The relative protein concentration (RPC) was expressed as a percentage of the soluble protein concentration of the HV-CAP, and ultrasound-assisted HV-CAP treated lysozyme solution compared to that of the control. A 0.45 μm filter was used to filter the samples, and the absorbance was measured at room temperature with a UV-vis spectrophotometer (Shimadzu 2600 UV-vis spectrophotometer, Shimadzu Corporation, Kyoto, Japan). The RPC was expressed as:

Where; A280 is the absorbance at 280 nm of the treated lysozyme solution while AC280 is the absorbance of the control sample.
Turbidity
Turbidity of the control and HV-CAP and ultrasound-assisted HV-CAP treated lysozyme were evaluated according to Zhao and Yang (2008) using a spectrophotometer. 3 mg/mL of treated lysozyme solution was recorded at 650 nm using a UV-vis spectrophotometer (Shimadzu 2600 UV-vis spectrophotometer, Shimadzu Corporation, Kyoto, Japan). The turbidity was calculated as the transmittance percentage (T %).
Tertiary structure of lysozyme
Ultraviolet absorption spectra
A UV-vis spectrophotometer was used to analyse the UV spectra of the treated and control samples at 280 nm in a phosphate buffer (20 mM, pH 7.6) (Shimadzu 2600 UV-vis spectrophotometer, Shimadzu Corporation, Kyoto, Japan). The absorption spectra were measured from 200 to 320 nm.
Exposed sulfhydryl groups
The sulfhydryl content (SHF) of the treated and control lysozyme samples were evaluated based on Zhao et al. (2007). The treated lysozyme was diluted 10 times in Tris-glycine buffer (0.1 M Tris–(hydroxymethyl)–aminomethane (Tris), 0.1 M glycine, and 4 mM ethylenediamine–tetraacetic acid (EDTA) disodium salt, pH 7.0). 4 mg/mL 5',5-dithiobis (2-nitrobenzoic acid) [DTNB] in Tris-glycine–buffer was used to make Ellman's reagent, and 10 μL was added to the protein solution. After being maintained at ambient temperature for 10 min, the mixture was centrifuged at 19,000 g at 4 for 15 min (Allegra 64R Centrifuge, Beckman Coulter, IN, USA). In a blank sample, DTNB was substituted with Tris-glycine buffer. The supernatant was read at an absorbance of 412 nm using a spectrophotometer (Varioskan Flash, Thermo Scientific, USA). The sulfhydryl content was expressed as below:

Where; A412 is the absorbance at 412 nm, C is the lysozyme concentration (mg/mL), and D is the dilution factor.
Surface hydrophobicity
The surface hydrophobicity of treated and control lysozyme samples was evaluated by Zhao et al. (2007). The relative fluorescence intensity was used to assess the surface hydrophobicity of lysozyme. After dissolving the treated lysozyme (2 mg/mL) in phosphate buffer (20 mM, pH 7.6), 10 mL of 8 mM 8-Anilino-1-naphthalene sulfonic acid (ANS) in phosphate buffer (20 mM, pH 7.6) was added to 2 mL of the lysozyme dispersion. Using a spectrofluorometer (Varioskan Flash, Thermo Scientific, USA), the relative fluorescence intensity of lysozyme and ANS was measured at 390 nm at room temperature (excitation wavelength, slit 2.5 nm), 410 – 650 nm (emission wavelength, slit 2.5 nm), and a speed of 10 nm/s.
[ Figure 3 about here]
Intrinsic fluorescence spectroscopy
The intrinsic fluorescence spectra of HV-CAP and ultrasound-assisted HV-CAP treated and control lysozyme samples were measured in a phosphate buffer (20 mM, pH 7.6) at room temperature using a spectrofluorometer (Varioskan Flash, Thermo Scientific, USA) at 295 nm (excitation wavelength, slit: 2.5 nm), 320 – 400 nm (emission wavelength, slit: 2.5 nm) and a scanning speed of 10 nm/s.
Carbonyl content
According to Wu et al. (2014), the HV-CAP and ultrasound-assisted HV-CAP treated lysozyme carbonyl contents were evaluated. The lysozyme reaction utilised the 2,4-dinitrophenylhydrazine (DNPH) and the carbonyl groups. 0.35 mL (5 mg/mL) of lysozyme solutions were blended with 1 mL 10 mM DNPH in 2 N HCl and incubated for 2 h at 20 . A blank was made by mixing 1 mL of 2 N HCl with an equivalent volume of protein solution without DNPH. Then 0.45 mL 40 percent trichloroacetic acid was added and vortexed (Crystal VM-01U, Suzhou Jiemei Electronics Co., Ltd., Jiangsu, China) for 20 min before centrifuging for 10 min at 10,000 g (Allegra 64R Centrifuge, Beckman Coulter, IN, USA). The pellet was washed 3 times in a 1.5 mL ethyl acetate (1:1, v/v) solution. The protein was suspended in 1.0 mL 6 M guanidine hydrochloride solution and vortexed every 5 min in a water bath (37 ) for 20 min. At 367 nm, the absorbance was measured (Varioskan Flash, Thermo Scientific, USA). The results were expressed as μmoles carbonyl groups per mg of soluble protein with a molar extinction coefficient of 36,000 M-1 cm-1.
Lipid oxidation
Lipid oxidation of the HV-CAP and ultrasound-assisted HV-CAP treated lysozyme were determined according to Wang et al. (2021). Using a homogeniser (IKA T25 digital ULTRA, Germany) at a speed of 10,000 g for 30 s, 3 mg of lysozyme powder was dissolved in 15 mL deionised water and 0.05 mL butylated hydroxyl toluene (BHT) (4.2 percent in ethanol). The homogenate was centrifuged for 5 min at 2,000 g (Allegra 64R Centrifuge, Beckman Coulter, IN, USA). Then 2 mL of thiobarbituric acid (TBA) at a concentration of 20 mM was added. The mixture was then boiled in a water bath for 5 min at 90 . The mixture's temperature was then lowered, and it was centrifuged for 15 min at 4000 g. The supernatant was read at 532 nm (Varioskan Flash, Thermo Scientific, USA), and the results were expressed as mg malondialdehyde (MDA) per kg lysozyme.
Particle size distribution
The particle size and zeta potential of HV-CAP and ultrasound-assisted HV-CAP treated lysozyme (0.3 mg/mL) were measured according to the method of Qian et al. (2021) using Zetasizer Nano ZS analyser (Malvern Instruments Ltd., Worcestershire, UK) at 25 .
Secondary structure of lysozyme
Fourier transform infrared-attenuated total reflectance spectroscopy
The Fourier transform infrared-attenuated total reflectance (FTIR-ATR) spectroscopy investigated the HV-CAP, and ultrasound-assisted HV-CAP treated lysozymes' secondary structure. The treated lysozyme powder (3 mg) was placed on the diamond crystal of Nicolet iS10 FTIR-ATR Spectrometer (Thermo Fisher Scientific, Waltham, MA, USA). The spectra of the lysozyme samples were scanned at a resolution of 32 cm−1 with 100 scans from 4000 to 400 cm−1.
Circular dichroism spectroscopy
The Circular dichroism (CD) spectroscopy was utilised further to study the HV-CAP and ultrasound-assisted HV-CAP effects on the treated lysozyme. The CD measurement was conducted using a Jasco spectrometer (J-1500, Jasco Corporation, Japan). The treated lysozyme was scanned from 240 to 200 nm with a 5 nm bandwidth, 1 nm pitch, and 100 nm/min speed using a 1 mm path length cuvette. Each lysozyme sample was dissolved in phosphate buffer (20 mM, pH 7.6) to a 0.3 mg/mL final concentration.
Relative Molar Ellipticity
The relative molar ellipticity at 222 and 208 nm of lysozyme were described as a percentage of the molar ellipticity of the HV-CAP-treated and ultrasound-assisted HV-CAP-treated lysozyme samples relative compared to the control.
Statistical analysis
Origin Graphing and Statistical Analysis Software was used to perform statistical analyses and data plots (Version 2021b, OriginLab Corporation, Massachusetts, USA). Tukey's test evaluated statistical differences using a one-way analysis of variance (ANOVA). 0.05 was used as the statistical significance level. All the trials were repeated three times.
[ Figure 4 about here]
Lysozyme activity analysis
Lysozyme activity assay
Lysozyme is among the moderately packed and stiff proteins and is highly susceptible to non-thermal treatments, including cold atmospheric plasma and ultrasound (Weiss et al. 2011; Wu et al. 2016). The reaction between the HV-CAP, ultrasound-assisted HV-CAP, and lysozyme was presented in Fig. 1a. The result showed a rapid decrease (p 0.05) between the control samples and both treatments. Mild changes were observed among the HV-CAP samples compared to more pronounced changes in the ultrasound-assisted samples. The ultrasound-assisted treatment influenced the lysozyme activity significantly (p 0.05). The decreasing lysozyme activity seen in this study corroborated with Takai et al. (2012) for protein inactivation using low-temperature atmospheric pressure plasma and Choi et al. (2017) for lysozyme inactivation using atmospheric pressure plasma jet.
The changes in the HV-CAP treated lysozyme activity could be linked to the actions of reactive oxygen species (ROS) and reactive nitrogen species (RNS) that modify the exposed amino acids residues through mild modifications (Stadtman 2006). The modifications could lead to chemical reactions including sulfonation of methionine residues, hydroxylation of aliphatic amino acids side chains and aromatic groups, amidation, ring-opening, oxidation of free amino acids, chlorination of primary amino groups, and transformation of carbonyl derivatives (Misra et al. 2016; Takai et al. 2014; Thirumdas and Annapure 2020). Whereas, the ultrasound-assisted treatment reduction in enzyme activity could be because of mechanical stresses that resulted in breaking the enzyme's peptide bonds due to collision of the lysozyme enzyme molecules and by upsetting of molecular bands and uniformity caused by the ultrasonic intersperse (Mawson et al. 2011; Weiss et al. 2011).
Relative protein concentration and turbidity
The HV-CAP-treated lysozyme's soluble and insoluble protein content decreased statistically among the various treatments (Fig. 1b). The decrease was gradual for all the treatments except for T6 which drops rapidly, this shows that ultrasound pre-treatment significantly affected the enzyme aggregation. This phenomenon suggests that the treatments triggered mild aggregation of lysozyme, and the aggregation occurs with lysozyme inactivation simultaneously. This aggregation might be formed from the smaller particles formed from the increase in a hydroxyl group, which formed hydrogen linkages with the dispersant molecules in the lysozyme dispersion (Dabbour et al. 2020; Thirumdas et al. 2017). The aggregation result corresponds to the turbidity result, as shown in Fig. 1c. The turbidity of the HV-CAP treated samples increases for T1 (86.31 %) then begins to decrease up to T3 (86.86 %), after which it increases again for the ultrasound pre-treated samples to final turbidity of 87.45 % at T6. There was a slight but significant (p < 0.05) variation among the various treatments from the result.
Tertiary structure analyses
UV absorption spectroscopy analysis
UV absorption spectroscopy is a simple method utilised in studying the conformational changes in proteins' components influenced by physical forces that subsequently connote variations in the tertiary structure of proteins (Zhang et al. 2020a). Mostly aromatic amino acids (tryptophan and tyrosine) residues which are relatively nonpolar, contribute to the UV absorption of proteins by revealing two peaks at higher (250 – 280 nm) and lower (215 – 230 nm) wavelengths (Han et al. 2019; Hansen et al. 2013; Zhang et al. 2020a). Tyrosine is the only aromatic amino acid with an ionisable bond responsible for the absorption in lysozyme (Aitken and Learmonth 2009; Han et al. 2019). Figure 2a shows the absorption bands of tyrosine at different treatments. The absorption of tyrosine increases strongly toward a lower wavelength. The absorbance intensity increased with increased treatment voltage, with T6 having the highest absorbance. This result suggests conformational changes to the lysozyme enzyme as there was a change in the absorbance peak of the control (213 nm) compared to T6 (216 nm) as one single oxidised amino acid could alter the enzyme activity (Zhang et al. 2015). These changes might be attributed to the synergetic effect of HV-CAP and ultrasound-assisted HV-CAP treatments that disintegration of amide structures because of repelling against the oxygen radicals and exposure of hydrophobic groups that could lead to an increase of surface hydrophobicity (Han et al. 2019; Zhang et al. 2020a). To further understand the ultrasound-assisted HV-CAP treatment-induced changes to lysozyme constituents', the oxidation attributes such as hydrophobicity are investigated.
Lipid oxidation analysis
Lipid hydroperoxides and thiobarbituric acid reactive substances (TBARS) are reaction products induced by the HV-CAP and ultrasound-assisted HV-CAP treatments. The effect of the treatments on lipid oxidation was displayed in Fig. 2b. There was no noticeable variation in the TBARS values between the HV-CAP treated samples and control except T3. Equally, the same observation was made for the ultrasound-assisted HV-CAP treated samples. The results show that HV-CAP voltage and ultrasonication influenced oxidation of lysozyme, with substantial oxidation occurring at the highest voltage (160 kV). Reactive species generated by the HV-CAP could initiate the oxidation, while the ultrasound cavitation effect could accelerate the oxidation process (Olatunde et al. 2019; Pérez-Andrés et al. 2019; Xu et al. 2021; Zhang et al. 2021a), this might be the reason for lower TBARS values with no variation in the HV-CAP treated samples.
[ Figure 5 about here]
Carbonyl content analysis
Carbonyl content as an essential indicator of protein oxidation could be formed from the reaction between the protein and hydroxyl radicals which transform several amino acid side chain groups to carbonyl derivatives (Li et al. 2021; Sun et al. 2019; Zhang et al. 2021b). According to Fig. 2c, the carbonyl content of the lysozyme was significantly (p 0.05) affected by both treatments, with a much greater effect from the ultrasound-assisted HV-CAP treatments. This indicated that ultrasound pre-treatment induced protein oxidation owing to ultrasonic cavitation that generates reactive radicals from the sonolysis of water molecules that oxidise exposed amino acid residues such as tyrosine (Kang et al. 2016; Zhang et al. 2020a). Li et al. (2021) reported that ultrasound-produced free radicals could enhance the carbonyl content of Antarctic krill protein.
Intrinsic fluorescence spectroscopy analysis
The tertiary structural alteration goes simultaneously with quaternary structural redisposition and partial unfolding of lysozyme, which can be examined using fluorescence of tryptophan residues because of intrinsic fluorescence chromophores from those aromatic amino acids (Sha et al. 2021; Zhang et al. 2021b; Zhou et al. 2019). This alteration could change the local molecular surrounding of tryptophan residues most susceptible to the polarity (Sun et al. 2021; Zhao and Yang 2008; Zhao et al. 2007). As shown in Fig. 2d, there was a significant difference (p 0.05) in the intrinsic fluorescence intensity of the control compared to the HV-CAP, and ultrasound-assisted HV-CAP treated samples. The fluorescence spectra were excited at 295 nm with two protruding peaks at 325 and 330 nm, implying the intense attraction of tryptophan because of ultrasound-assisted HV-CAP treatment (Sha et al. 2021). The fluorescence intensity increases with voltage for both treatments. This could be attributed to the relatively high alkalinity (pH 7.6) of the buffer solution that exposed the tryptophan residues to the outer surface, increasing the degree of lysozyme protein unfolding (Dev et al. 2021). These results were consistent with those of previous studies, where whey protein isolate-gellan gum conjugate was subjected to ultrasonication (Dev et al. 2021), contrary to most reports (Li et al. 2020; Li et al. 2021; Mahdavian Mehr and Koocheki, 2020; Yu et al. 2021) of HV-CAP and ultrasonication regarding intrinsic fluorescence. This result warrants further investigations to ascertain the synergetic effect of HV-CAP and ultrasound-assisted HV-CAP treatment on proteins.
Hydrophobicity analysis
The surface hydrophobicity is a conventional technique to assess protein conformational alteration which indicates the extent of hydrophobic amino acid residues revealed to the surface of the protein particle that interacts with the polar aqueous solution that is indispensable to the physicochemical, structural, and stability attributes of the protein (Jun et al. 2020; Shen et al. 2017; Xiong et al. 2016; Zhang et al. 2020a). Most hydrophobic amino acid residues were covered inside protein aggregates and particles (Fig. 3a). After the HV-CAP and ultrasound-assisted HV-CAP treatments, the hydrophobicity intensity increased for all treatments (Fig. 3a), implying the exposure of a substantial amount of hidden hydrophobic amino acid residues after the synergetic treatments. The increase in surface hydrophobicity intensity due to the HV-CAP treatment could be due to plasma-induced changes to the three-dimensional structure of the lysozyme by unfolding its structure, thus exposing the buried amino acids that could interact with the hydrophobic groups of the lysozyme particles that were made easily accessible (Baek et al. 2021; Liu et al. 2021; Olatunde et al. 2021). Furthermore, a physical shearing force, turbulence, and micro-fluidisation effects caused by different cavitation levels during sonication, which led to perturbations in protein quaternary structure and unfolding of protein molecules, exposing the hydrophobic groups and regions initially inside the molecule, could be attributed to the more pronounced increase in surface hydrophobicity after ultrasound pre-treatment (Jun et al. 2020; Li et al. 2020; Sha et al. 2021; Zhang et al. 2020a). HV-CAP and ultrasound were reported to expose certain hydrophobic areas of proteins to the surface and increase the surface hydrophobicity of numerous proteins, including soybean (Liu et al. 2021), Antarctic krill (Li et al. 2021), and chickpea protein isolate (Xu et al. 2021).
Exposed sulfhydryl content analysis
The alteration in protein folding, protein conformation, and disulphide linkages could be affected by changes in sulfhydryl content, which plays a vital role in stabilising the protein structure that is highly susceptible to reactive species (Olatunde et al. 2021; Sun et al. 2019). Thus, a decrease in sulfhydryl content usually indicates protein oxidation (Zhang et al. 2021c). With higher voltage, the Sulfhydryl content of lysozyme (Fig. 3b) exposed to HV-CAP treatment dropped considerably from 22.22 to 21.67 μmol/g protein. Similar findings were obtained by Liu et al. (2021) and Olatunde et al. (2021) for HV-CAP treated soybean protein and myofibrillar protein isolate of Asian sea bass respectively. Similarly, the sulfhydryl content of lysozyme treated with ultrasound-assisted HV-CAP dropped by a significant amount (p 0.05), ranging from 19.79 to 12.90 μmol/g protein. Similar findings were found in ultrasound-treated pork myofibrillar proteins (Zhang et al. 2021b) and Antarctic krill proteins (Li et al. 2021). The reduction in sulfhydryl content might be attributable to lysozyme molecule aggregation, which causes partial suppression of sulfhydryl groups, resulting in a decrease in detectable sulfhydryl groups (Sun 2019). Furthermore, the cavitation caused by the ultrasonic treatment may generate hydroxyl radicals, which oxidise the highly disposed sulfhydryl groups, lowering the sulfhydryl level (Li et al. 2021; Zhang et al. 2021b).
Particle size distribution analysis
The HV-CAP and ultrasound-assisted HV-CAP treated lysozyme particle sizes were smaller than the non-treated samples. The treated lysozyme samples decreased with increased HV-CAP treatment and further decreased with ultrasound-assisted HV-CAP treatment (Fig. 4a). The average particle sizes of the HV-CAP and ultrasound-assisted HV-CAP treated lysozyme were 546.03, 497.03, 351.13 and 309.93, 287.50, 225.43 nm, respectively, compared to the non-treated lysozyme of 581.50 (Fig. 4b). To measure the range of the particle in the HV-CAP and ultrasound-assisted HV-CAP treated lysozyme, polydispersity index (PDI) was investigated and presented in Fig. 4c. The PDI results showed non-significant fluctuated values for both treatments but higher than the untreated sample, demonstrating a more acceptable range of particle sizes and a more homogenous dispersion of the lysozyme. This reveals that HV-CAP and ultrasound-assisted HV-CAP treatments affect the lysozyme's heterogeneity and particle size distribution. The reduction in average particle size of both treated samples could be due to plasma-induced disaggregation and disruption of lysozyme particle clusters, and the separation of noncovalent interactions such as hydrophobic interactions could be the driving force for aggregation through shear force and turbulence caused by ultrasound cavitation (Baek et al. 2021; Xiong et al. 2016; Zhang et al. 2021b). Similar findings were made in treating chicken myofibrillar protein (Li et al. 2020) and peanut protein isolate (Sun et al. 2021).
[ Figure 6 about here]
Zeta potential analysis
The electrostatic interactions between the lysozyme molecules for both HV-CAP and ultrasound-assisted HV-CAP treatments were evaluated based on electrophoretic mobility and electrical conductivity (Fig. 4d). The electrical potential or surface charge disparity between the molecules helps stabilises the interaction between particles (Rahman and Lamsal 2021; Shen et al. 2017). Additionally, zeta potential indicates the existence of charged amino acids that influence the aggregation and dispersion of the lysozyme (Rahman and Lamsal 2021). The zeta-potential of both treatments had a higher surface charge as they possess higher negative values than the untreated sample. The net surface charge decreases with increased HV-CAP voltage for both treatments. A possible elucidation for these results could be due to the disintegration or depolymerisation of lysozyme due to ultrasound-induced mechanical forces (Liu et al. 2020). This causes the negatively charged amino acids to increase, overcoming the positively charged ones (Mahdavian Mehr and Koocheki 2020; Rahman and Lamsal 2021). Our findings show that HV-CAP and ultrasound-assisted HV-CAP treatments strengthened electrostatic repulsion in lysozyme, which agrees with the previous work of Liu et al. (2020) for high-intensity ultrasound treated myofibrillar protein.
Secondary structure analyses
Fourier transform infrared-attenuated total reflectance spectroscopy analysis
To acquire additional information regarding lysozyme structural changes, we analysed the FTIR-ATR spectra, which can be employed to quantitatively determine the secondary structural changes of the HV-CAP and ultrasound-assisted HV-CAP treated lysozyme. The FTIR-ATR spectra of control, HV-CAP, and ultrasound-assisted HV-CAP lysozyme were displayed in Fig. 5, which indicate the adsorption of amide groups, amino groups, glycoside bonding, and C–C bonding in the ring structure of the lysozyme molecule that can be divided into three bands, namely Amide I (1600 – 1700 cm-1), Amide II (1500 – 1600 cm-1) and Amide III (1200 – 1400 cm-1). From the figure, the control and ultrasound-assisted HV-CAP treated lysozyme revealed distinctive Amide A peak that lead to N–H or O–H stretching and Amide B peak that leads to C–H deformation vibrations owing to the plasma-induced depolymerisation of the lysozyme (Chaple et al. 2020; Chen et al. 2020). Moreover, the alteration in the internal structure of the lysozyme molecule could be due to the disruption of the interaction between the protein molecules owing to the distinct sonication effects and the shear forces of the ultrasound mechanical action (Jun et al. 2020). Previous studies have employed the FTIR technique to investigate the structural changes in several proteins, including Kang et al. (2016) for beef protein and Jing et al. (2020) for egg white protein-tea polyphenol conjugates. The components of the various secondary structures of lysozyme were subsequently quantified using circular dichroism in the next section.
Circular dichroism spectroscopy analysis
Circular dichroism (CD) far-UV spectral analysis is an accurate and fast approach for examining the conformational changes connected to the polypeptide backbone structure of proteins (Jing et al. 2020; Zhao et al. 2007). Lysozyme is a tiny monomeric globular protein with a dense structure surrounded by many helices and a little β-sheet region (Zhao and Yang 2008). The active part of lysozyme, where α-and β-domains are produced, is housed in the secondary structure, which is critical to its activity (Zhao and Yang 2008). Hence, the CD was used to assess the HV-CAP and ultrasound-assisted HV-CAP-induced secondary structural changes in the lysozyme. Figure 6a shows the CD spectra of lysozyme having different bands intensities implying that alteration had occurred in the lysozyme secondary structure. Negative peaks were obtained at 208 and 222 nm for both HV-CAP and ultrasound-assisted HV-CAP samples indicating a distinctive disordered protein (Zhao and Yang 2008).
The CD spectra were further analysed to obtain the proportions of various secondary structure components of the lysozyme as affected by HV-CAP and ultrasound-assisted HV-CAP treatment. The proportions of α-helices, β-sheets, β-turns, and random coils components of the lysozyme structure are shown in Fig. 6b. The β-turns and random coils components showed no significant change, with values ranging from 24.33 to 25.43 % for β-turns and 33.93 % for random coils. The values of α-helices and β-sheets with 28.87 – 30.77 % and 8.13 – 11.73 %, respectively, showed a significance (p 0.05). This result indicated that HV-CAP and ultrasound-assisted HV-CAP treatments triggered lysozyme protein to unfold by changing the various components' content. This might be related to the adaptability of lysozyme protein molecules, which corresponds to the relative mobility of different spheres or the degree of reorientation of amino acid residues in a polypeptide chain and was previously linked to the capacity to adjust to the external environment (Xu et al. 2021). Another cause might be the breakage of hydrogen links inside peptide molecules, which help to stabilise the α-helices component and are formed between amino hydrogen and carbonyl oxygen (Tian et al. 2020).
Relative molar ellipticity analysis
Moreover, additional information was acquired by evaluating the molar ellipticity at 208 and 222 nm, due to its linkage with the helical constituents of the lysozyme (Zhao and Yang 2008). Thus, relative molar ellipticity (RME) was employed to assess further the modifications induced by both treatments to the secondary structure of the protein. From Fig. 6c, it could be seen that RME values at 222 nm increased to 103.42 % as treatment voltage increased to 120 kV then decreased to 97.77 % at 160 kV HV-CAP treatment. Equally, ultrasound-assisted HV-CAP follows the same trend with an increase in RME to 102.80 % and falls to 96.06 %. For 208 nm, the RME values decreased slightly from 100 % to 98.46 for the HV-CAP treatment, while there was a rapid decrease from 102.36 to 93.81 % for the ultrasound-assisted HV-CAP treated samples. This indicated that ultrasound-assisted HV-CAP treatment had a more pronounced influence on the secondary structure of lysozyme than HV-CAP treatment.
Subsequently, RME was plotted against the RRA of the lysozyme to elucidate further their relationship with respect to the structure of lysozyme (Fig. 6d). From the plot, the RME values for HV-CAP samples decreased with RRA values at 222 nm, while a fluctuation was observed for the ultrasound-assisted HV-CAP samples. Similarly, a decrease was seen in both treatments as RRA increased at 208 nm. This implies that alteration in the lysozyme activity influences the secondary structural components, thereby modifying the lysozyme structure (Zhao and Yang 2008).
The HV-CAP positively influenced lysozyme enzyme activity and structure. The lysozyme inactivation was affected by the HV-CAP treatment voltage and ultrasound intensity. The results show that plasma-generated reactive species, ions, electrons, neutral species, charged particles, and photons, among other things, were responsible for the inactivation. The ultrasound-induced cavitation that resulted in physical shearing force, turbulence, and micro-fluidisation influenced the activity of lysozyme and its structure. Moreover, plasma and ultrasound-induced changes led to moderate denaturation of lysozyme that disrupts the protein's tertiary structure. This disruption improved TBARS values, intrinsic fluorescence, and UV absorption and exposed the sulfhydryl groups of the lysozyme. In addition, the ultrasound-assisted HV-CAP treatment triggered protein unfolding and modification of the secondary structure of the protein by altering the amino acids and peptide-linkages splitting. This unfolding mildly affects α-helices and β-sheets constituents of the lysozyme, thereby affecting its activity. Furthermore, the structural disruption and protein unfolding causes a decrease in the lysozyme particles' sizes and lower their zeta potential values by altering the proportion of positively and negatively charged amino acid residues on the protein's surface.
Besides, the results indicated that the ultrasound-assisted HV-CAP induced changes in activity and structure of lysozyme were dependent on treatment voltage. Thus, further research could optimize the process by taking advantage of other HV-CAP treatment parameters, including treatment mode, working gas, treatment time, and frequency. The optimisation could fast-track the adoption of this great emerging technology in the food processing industries.
Author statement
Herewith, I confirm that this work is original, has not been published previously, and is not currently under consideration for publication elsewhere. All authors have consented to publication, and they declare having no conflict of interests.
Authors’ Contribution
M.M.N.: Conceptualisation, Data curation, Writing-original draft and editing, Methodology and Analysis. E.F.B.: Methodology, Software, Visualisation, and Writing-editing. Z.W.: Methodology, Data curation, and Validation. W.Y.: Conceptualisation, Supervision, and Funds acquisition. H.Z.: Conceptualisation, Supervision, and Funds acquisition. J.Z.: Conceptualisation, Supervision, and Funds acquisition.
Declaration of Competing Interest
The authors declare that they have no known competing financial interests or personal relationships that could have influenced the work reported in this paper.
Funding
This work was supported by the Jiangsu Science and Technology Plan Project (XZ-SZ202009), the Agricultural Innovation Fund Project of Jiangsu Province (No. CX (18)3041), the National Key Research and Development Program (2018YFD0700802), and the Priority Academic Program Development of Jiangsu Higher Education Institutions (PAPD).
Availability of Data and Material
The original data used to support the findings of this study are available from the first author upon request.
- Aitken A & Learmonth MP (2009) Protein determination by UV absorption. In: The protein protocols handbook. p^pp 3–6. Springer.
- Attri P, Kaushik NK, Kaushik N, Hammerschmid D, Privat-Maldonado A, De Backer J, Shiratani M, Choi EH & Bogaerts A (2021) Plasma treatment causes structural modifications in lysozyme, and increases cytotoxicity towards cancer cells. Int J Biol Macromol. 182, 1724–1736.
- Baek KH, Heo YS, Yim DG, Lee YE, Kang T, Kim H-J & Jo C (2021) Influence of atmospheric-pressure cold plasma-induced oxidation on the structure and functional properties of egg white protein. Innovative Food Science & Emerging Technologies. 74.
- Basak S & Annapure US (2022) Recent trends in the application of cold plasma for the modification of plant proteins - A review. Future Foods. 5.
- Cao C, Xiao Z, Tong H, Tao X, Gu D, Wu Y, Xu Z & Ge C (2021) Effect of ultrasound-assisted enzyme treatment on the quality of chicken breast meat. Food and Bioproducts Processing. 125, 193–203.
- Chaple S, Sarangapani C, Jones J, Carey E, Causeret L, Genson A, Duffy B & Bourke P (2020) Effect of atmospheric cold plasma on the functional properties of whole wheat (Triticum aestivum L.) grain and wheat flour. Innovative Food Science & Emerging Technologies. 66.
- Chen J, Zhang X, Chen Y, Zhao X, Anthony B & Xu X (2020) Effects of different ultrasound frequencies on the structure, rheological and functional properties of myosin: Significance of quorum sensing. Ultrason Sonochem. 69, 105268.
- Chen J, Zhang X, Fu M, Chen X, Pius BA & Xu X (2021) Ultrasound-assisted covalent reaction of myofibrillar protein: The improvement of functional properties and its potential mechanism. Ultrason Sonochem. 76, 105652.
- Choi S, Attri P, Lee I, Oh J, Yun JH, Park JH, Choi EH & Lee W (2017) Structural and functional analysis of lysozyme after treatment with dielectric barrier discharge plasma and atmospheric pressure plasma jet. Sci Rep. 7(1), 1027.
- Colombié S, Gaunand A & Lindet B (2001) Lysozyme inactivation under mechanical stirring: effect of physical and molecular interfaces. Enzyme and Microbial Technology. 28(9), 820–826.
- Dabbour M, Xiang J, Mintah B, He R, Jiang H & Ma H (2020) Localized enzymolysis and sonochemically modified sunflower protein: Physical, functional and structure attributes. Ultrason Sonochem. 63, 104957.
- Dev MJ, Pandit AB & Singhal RS (2021) Ultrasound assisted vis-à-vis classical heating for the conjugation of whey protein isolate-gellan gum: Process optimization, structural characterization and physico-functional evaluation. Innovative Food Science & Emerging Technologies. 72.
- Fatkhutdinova A, Mukhametzyanov T & Schick C (2022) Refolding of Lysozyme in Glycerol as Studied by Fast Scanning Calorimetry. Int J Mol Sci. 23(5).
- Gu Y, Shi W, Liu R, Xing Y, Yu X & Jiang H (2021) Cold plasma enzyme inactivation on dielectric properties and freshness quality in bananas. Innovative Food Science & Emerging Technologies. 69.
- Han L, Cao S, Yu Y, Xu X, Cao X & Chen W (2021) Modification in physicochemical, structural and digestive properties of pea starch during heat-moisture process assisted by pre- and post-treatment of ultrasound. Food Chemistry. 360, 129929.
- Han Y, Cheng J-H & Sun D-W (2019) Activities and conformation changes of food enzymes induced by cold plasma: A review. Critical Reviews in Food Science and Nutrition. 59(5), 794–811.
- Hansen SK, Jamali B & Hubbuch J (2013) Selective high throughput protein quantification based on UV absorption spectra. Biotechnology and Bioengineering. 110(2), 448–460.
- Jing H, Sun J, Mu Y, Obadi M, McClements DJ & Xu B (2020) Sonochemical effects on the structure and antioxidant activity of egg white protein-tea polyphenol conjugates. Food Funct. 11(8), 7084–7094.
- Jun S, Yaoyao M, Hui J, Obadi M, Zhongwei C & Bin X (2020) Effects of single- and dual-frequency ultrasound on the functionality of egg white protein. Journal of Food Engineering. 277.
- Kang D-c, Zou Y-h, Cheng Y-p, Xing L-j, Zhou G-h & Zhang W-g (2016) Effects of power ultrasound on oxidation and structure of beef proteins during curing processing. Ultrasonics Sonochemistry. 33, 47–53.
- Kang JH, Roh SH & Min SC (2019) Inactivation of Potato Polyphenol Oxidase Using Microwave Cold Plasma Treatment. Journal of Food Science. 84(5), 1122–1128.
- Li K, Li Y, Liu C-L, Fu L, Zhao Y-Y, Zhang Y-Y, Wang Y-T & Bai Y-H (2020) Improving interfacial properties, structure and oxidative stability by ultrasound application to sodium caseinate prepared pre-emulsified soybean oil. Lwt. 131.
- Li R & Xiong YL (2021) Ultrasound-induced structural modification and thermal properties of oat protein. Lwt. 149.
- Li Y, Zeng QH, Liu G, Peng Z, Wang Y, Zhu Y, Liu H, Zhao Y & Jing Wang J (2021) Effects of ultrasound-assisted basic electrolyzed water (BEW) extraction on structural and functional properties of Antarctic krill (Euphausia superba) proteins. Ultrason Sonochem. 71, 105364.
- Liu H, Zhang H, Liu Q, Chen Q & Kong B (2020) Solubilization and stable dispersion of myofibrillar proteins in water through the destruction and inhibition of the assembly of filaments using high-intensity ultrasound. Ultrason Sonochem. 67, 105160.
- Liu ZW, Niu D, Zhou YX, Cheng JH, El-Din Bekhit A & Aadil RM (2021) Oxidation induced by dielectric-barrier discharge (DBD) plasma treatment reduces soybean agglutinin activity. Food Chemistry. 340, 128198.
- Luo J, Nasiru MM, Zhuang H, Zhou G & Zhang J (2021) Effects of partial NaCl substitution with high-temperature ripening on proteolysis and volatile compounds during process of Chinese dry-cured lamb ham. Food Research International. 140.
- Mahdavian Mehr H & Koocheki A (2020) Effect of atmospheric cold plasma on structure, interfacial and emulsifying properties of Grass pea (Lathyrus sativus L.) protein isolate. Food Hydrocolloids. 106, 105899.
- Mañas P, Muñoz B, Sanz D & Condón S (2006) Inactivation of lysozyme by ultrasonic waves under pressure at different temperatures. Enzyme and Microbial Technology. 39(6), 1177–1182.
- Mawson R, Gamage M, Terefe NS & Knoerzer K (2011) Ultrasound in Enzyme Activation and Inactivation. In: Ultrasound Technologies for Food and Bioprocessing. Food Engineering Series. p^pp 369–404.
- Misra NN, Pankaj SK, Segat A & Ishikawa K (2016) Cold plasma interactions with enzymes in foods and model systems. Trends in Food Science & Technology. 55, 39–47.
- Nasiru MM, Frimpong EB, Muhammad U, Qian J, Mustapha AT, Yan W, Zhuang H & Zhang J (2021) Dielectric barrier discharge cold atmospheric plasma: Influence of processing parameters on microbial inactivation in meat and meat products. Comprehensive Reviews in Food Science and Food Safety. 20(3), 2626–2659.
- Nasiru MM, Umair M, Boateng EF, Alnadari F, Khan KR, Wang Z, Luo J, Yan W, Zhuang H, Majrashi A, Zhang J & Korma SA (2022) Characterisation of Flavour Attributes in Egg White Protein Using HS-GC-IMS Combined with E-Nose and E-Tongue: Effect of High-Voltage Cold Plasma Treatment Time. Molecules. 27(3).
- Olatunde OO, Benjakul S & Vongkamjan K (2019) High voltage cold atmospheric plasma: Antibacterial properties and its effect on quality of Asian sea bass slices. Innovative Food Science & Emerging Technologies. 52, 305–312.
- Olatunde OO, Singh A, Shiekh KA, Nuthong P & Benjakul S (2021) Effect of High Voltage Cold Plasma on Oxidation, Physiochemical, and Gelling Properties of Myofibrillar Protein Isolate from Asian Sea Bass (Lates calcarifer). Foods. 10(2).
- Pérez-Andrés JM, Álvarez C, Cullen PJ & Tiwari BK (2019) Effect of cold plasma on the techno-functional properties of animal protein food ingredients. Innovative Food Science & Emerging Technologies. 58.
- Qian J, Wang C, Zhuang H, Nasiru MM, Zhang J & Yan W (2021) Evaluation of meat-quality and myofibrillar protein of chicken drumsticks treated with plasma-activated lactic acid as a novel sanitizer. Lwt. 138.
- Rahman MM & Lamsal BP (2021) Ultrasound-assisted extraction and modification of plant-based proteins: Impact on physicochemical, functional, and nutritional properties. Compr Rev Food Sci Food Saf. 20(2), 1457–1480.
- Sha L, Koosis AO, Wang Q, True AD & Xiong YL (2021) Interfacial dilatational and emulsifying properties of ultrasound-treated pea protein. Food Chemistry. 350.
- Shen X, Fang T, Gao F & Guo M (2017) Effects of ultrasound treatment on physicochemical and emulsifying properties of whey proteins pre- and post-thermal aggregation. Food Hydrocolloids. 63, 668–676.
- Spinei M & Oroian M (2021) The influence of osmotic treatment assisted by ultrasound on the physico-chemical characteristics of blueberries (Vaccinium myrtillus L.). Ultrasonics. 110, 106298.
- Stadtman ER (2006) Protein oxidation and aging. Free radical research. 40(12), 1250–1258.
- Sun Q, Chen Q, Xia X, Kong B & Diao X (2019) Effects of ultrasound-assisted freezing at different power levels on the structure and thermal stability of common carp (Cyprinus carpio) proteins. Ultrason Sonochem. 54, 311–320.
- Sun X, Zhang W, Zhang L, Tian S & Chen F (2021) Effect of ultrasound-assisted extraction on the structure and emulsifying properties of peanut protein isolate. Journal of the Science of Food and Agriculture. 101(3), 1150–1160.
- Takahashi M, Takahashi H, Okakura Y, Ichikawa M, Kuda T & Kimura B (2020) Impact of pH and protein hydrophobicity on norovirus inactivation by heat-denatured lysozyme. PLoS One. 15(8), e0237888.
- Takai E, Kitamura T, Kuwabara J, Ikawa S, Yoshizawa S, Shiraki K, Kawasaki H, Arakawa R & Kitano K (2014) Chemical modification of amino acids by atmospheric-pressure cold plasma in aqueous solution. Journal of Physics D: Applied Physics. 47(28), 285403.
- Takai E, Kitano K, Kuwabara J & Shiraki K (2012) Protein Inactivation by Low-temperature Atmospheric Pressure Plasma in Aqueous Solution. Plasma Processes and Polymers. 9(1), 77–82.
- Thirumdas R & Annapure US (2020) Enzyme inactivation in model systems and food matrixes by cold plasma. In: Advances in Cold Plasma Applications for Food Safety and Preservation. p^pp 229–252.
- Thirumdas R, Trimukhe A, Deshmukh RR & Annapure US (2017) Functional and rheological properties of cold plasma treated rice starch. Carbohydr Polym. 157, 1723–1731.
- Tian R, Feng J, Huang G, Tian B, Zhang Y, Jiang L & Sui X (2020) Ultrasound driven conformational and physicochemical changes of soy protein hydrolysates. Ultrason Sonochem. 68, 105202.
- Umair M, Jabbar S, Nasiru M, Sultana T, Senan A, Awad F, Hong Z & Zhang J (2019) Exploring the Potential of High-Voltage Electric Field Cold Plasma (HVCP) Using a Dielectric Barrier Discharge (DBD) as a Plasma Source on the Quality Parameters of Carrot Juice. Antibiotics. 8(4).
- Umair M, Jabbar S, Nasiru MM, Senan AM, Zhuang H & Zhang J (2020) Sequential Application of High-Voltage Electric Field Cold Plasma Treatment and Acid Blanching Improves the Quality of Fresh Carrot Juice (Daucus carota L.). Journal of Agricultural and Food Chemistry. 68(51), 15311–15318.
- Venkataramani S, Truntzer J & Coleman DR (2013) Thermal stability of high concentration lysozyme across varying pH: A Fourier Transform Infrared study. J Pharm Bioallied Sci. 5(2), 148–153.
- Wang X, Wang Z, Zhuang H, Nasiru MM, Yuan Y, Zhang J & Yan W (2021) Changes in color, myoglobin, and lipid oxidation in beef patties treated by dielectric barrier discharge cold plasma during storage. Meat Science. 176.
- Weiss J, Kristbergsson K & Kjartansson GT (2011) Engineering Food Ingredients with High-Intensity Ultrasound. In: Ultrasound Technologies for Food and Bioprocessing. Food Engineering Series. p^pp 239–285.
- Wu L, Zhao W, Yang R & Chen X (2014) Effects of pulsed electric fields processing on stability of egg white proteins. Journal of Food Engineering. 139, 13–18.
- Wu L, Zhao W, Yang R, Yan W & Sun Q (2016) Aggregation of egg white proteins with pulsed electric fields and thermal processes. Journal of the Science of Food and Agriculture. 96(10), 3334–3341.
- Xiong W, Wang Y, Zhang C, Wan J, Shah BR, Pei Y, Zhou B, Li J & Li B (2016) High intensity ultrasound modified ovalbumin: Structure, interface and gelation properties. Ultrason Sonochem. 31, 302–309.
- Xu L, yan W, Zhang M, Hong X, Liu Y & Li J (2021) Application of ultrasound in stabilizing of Antarctic krill oil by modified chickpea protein isolate and ginseng saponin. Lwt. 149.
- Yu J-j, Chen G-y, Zhang Y-f, Zheng X-c, Jiang P-y, Ji H, Li S-h & Chen Y (2021) Enhanced hydration properties and antioxidant activity of peanut protein by covalently binding with sesbania gum via cold plasma treatment. Innovative Food Science & Emerging Technologies. 68, 102632.
- Zhang H, Chen G, Liu M, Mei X, Yu Q & Kan J (2020a) Effects of multi-frequency ultrasound on physicochemical properties, structural characteristics of gluten protein and the quality of noodle. Ultrasonics Sonochemistry. 67.
- Zhang H, Xu Z, Shen J, Li X, Ding L, Ma J, Lan Y, Xia W, Cheng C, Sun Q, Zhang Z & Chu PK (2015) Effects and Mechanism of Atmospheric-Pressure Dielectric Barrier Discharge Cold Plasma on Lactate Dehydrogenase (LDH) Enzyme. Sci Rep. 5, 10031.
- Zhang J, Zhang Y, Zou Y & Zhang W (2021a) Effects of ultrasound-assisted cooking on quality characteristics of spiced beef during cold storage. Lwt. 136.
- Zhang Q, Cheng Z, Zhang J, Nasiru MM, Wang Y & Fu L (2020b) Atmospheric cold plasma treatment of soybean protein isolate: insights into the structural, physicochemical, and allergenic characteristics. Journal of Food Science. 86(1), 68–77.
- Zhang R, Xing L, Kang D, Zhou L, Wang L & Zhang W (2021b) Effects of ultrasound-assisted vacuum tumbling on the oxidation and physicochemical properties of pork myofibrillar proteins. Ultrason Sonochem. 74, 105582.
- Zhang S, Tian L, Yi J, Zhu Z, Dong X & Decker EA (2021c) Impact of high-intensity ultrasound on the chemical and physical stability of oil-in-water emulsions stabilized by almond protein isolate. Lwt. 149.
- Zhao W & Yang R (2008) The effect of pulsed electric fields on the inactivation and structure of lysozyme. Food Chemistry. 110(2), 334–343.
- Zhao W, Yang R, Lu R, Tang Y & Zhang W (2007) Investigation of the Mechanisms of Pulsed Electric Fields on Inactivation of Enzyme: Lysozyme. Journal of Agricultural and Food Chemistry. 55(24), 9850–9858.
- Zhou C-Y, Cao J-X, Zhuang X-B, Bai Y, Li C-B, Xu X-L & Zhou G-H (2019) Evaluation of the secondary structure and digestibility of myofibrillar proteins in cooked ham. CyTA - Journal of Food. 17(1), 78–86.
- Zhou C-Y, Xia Q, He J, Sun Y-Y, Dang Y-L, Ou C-R, Pan D-D, Cao J-X & Zhou G-H (2021) Improvement of ultrasound-assisted thermal treatment on organoleptic quality, rheological behavior and flavor of defective dry-cured ham. Food Bioscience. 43.
No competing interests reported.
- floatimage7.jpeg
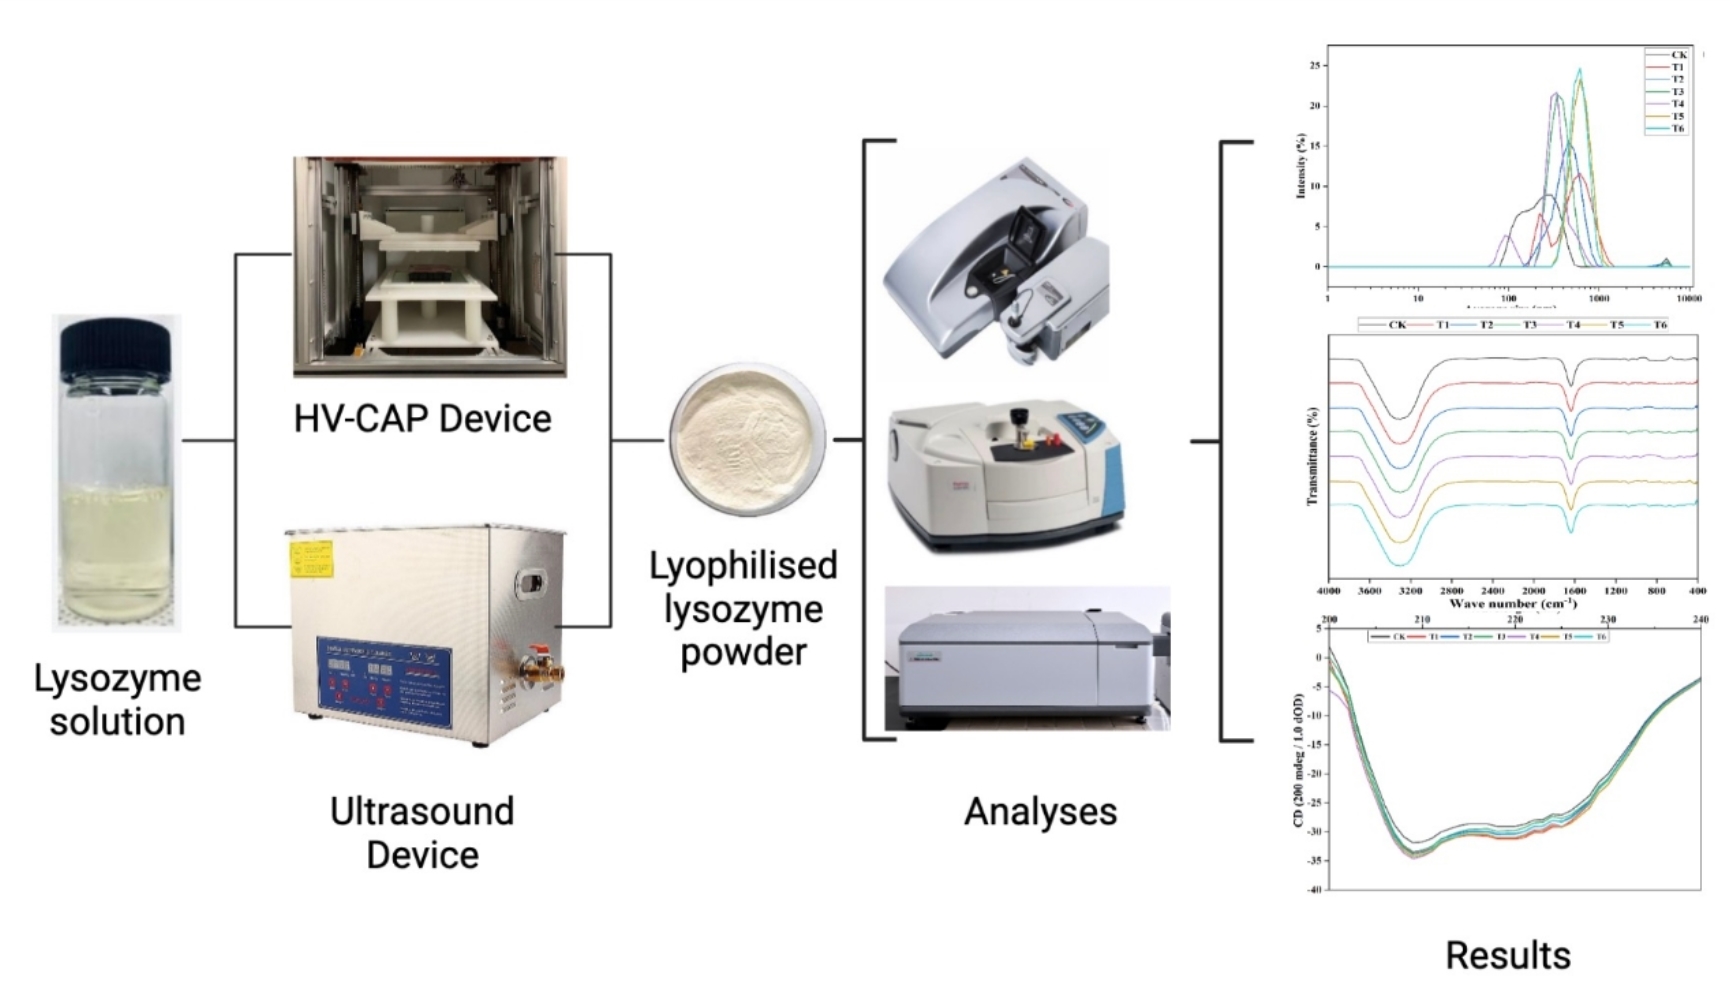
Graphical abstract