Study on the Transmission of COVID-19 in Hubei Province Based on SEIR Model with Intervention Measures

DOI: https://doi.org/10.21203/rs.3.rs-154675/v1

Abstract

Background At the end of 2019, an unidentified coronavirus, named as “COVID-19” by WHO, has broken out in Wuhan, Hubei Province. We aimed to simulate the development trend of COVID-19 in Wuhan and Hubei as well as estimate the number of COVID-19 cases with the government control policies and traffic control.

Methods We collected the COVID-19 data in Wuhan and Hubei (January 1, 2020 to April 8, 2020) and simulated three situations about COVID-19 epidemic trend: non-interference, government controlling behavior and traffic control by the SEIR model to analyzed the development and influence of the epidemic.

Results We adopted the SEIR model to estimate the number of COVID-19 cases in Hubei peaked on the 107th day without human control, and the number in Wuhan peaked on the 51st day after the lockdown of Wuhan. The number of new cases in Hubei and Wuhan presented a skewed normal distribution in the time series. Government intervention and traffic control had a certain inhibitory effect on the daily increase of COVID-19 cases. During the period from January 23 to April 8, 2020, there was a difference of 1,253,433 cases between the daily number of confirmed cases and the actual number of confirmed cases in Hubei under the simulated state of without human control. Also, there was a difference of 953,202 cases between the

daily number of confirmed cases and the actual number of confirmed cases in Wuhan under the simulated state of without human control.

Conclusion The actual COVID-19 outbreak quantity conforms to the simulation results, secondly the government control behavior and the traffic control can effectively inhibit COVID-19 to spread and the efficient can reach 52%. In other countries or regions, an effective intervention measures can control the spread of the epidemic. The earlier the control started and the stronger the control intensity was, the more effective the intervention for the COVID-19 epidemic was, so appropriate to cut off the route of transmission as soon as possible.

Background

Coronavirus which are enveloped nonsegmental positive RNA viruses get their name because they look like a crown under an electron microscope. They belong to Coronaviridae and nonsegmental Nidovirales, and are widely distributed among humans and other mammals. They mainly cause the respiratory diseases, also lead some diseases of digestive and nervous systems. At the end of 2019, an unidentified pneumonia virus with human-to-human characteristics has broken out in Wuhan, Hubei Province. The novel coronavirus, isolated from confirmed patients, are named as “COVID-19” by WHO. COVID-19 has strong infectivity and long incubation period. There are also some asymptomatic infections. Up to April 26, 2020, more than 200 countries and regions have reported confirmed cases, bringing the total number of confirmed cases to 2,874,855, with more than 203,458 million deaths.

In the face of the epidemic outbreak, the Chinese government has taken a series of prevention and control measures, including the lockdown of cities across the country since January 23, and the launching of the “Level-1 response plan for major public health emergencies” in different regions. Timely control measures have effectively controlled the rampant spread of COVID-19 in our country[1].

Although COVID-19 is under control to a certain extent in China, the spread of COVID-19 abroad has continued to increase for a period of time, which is not optimistic. The public health emergency has a major impact on people around the world so that COVID-19 has attracted wide attention worldwide and sparked an upsurge of research on COVID-19 in academic circles. Chaolin Gu[2] et al. used cubic and quadratic functions to simulate the inflection points of COVID-19 in the whole of China (including Hong Kong, Macao and Taiwan), the whole of China except Hubei province, and the world. Fan ruguo[3] et al. established the SEIR dynamics model (susceptible-exposed-infected-removed) of COVID-19 epidemic disease with incubation period based on the complex network theory. By setting scenarios of three viruses with different incubation periods, the model parameters were simulated and analyzed based on the epidemic data of the country and some regions and different scenarios, and the inflection points of the epidemic under the three scenarios were predicted. Wang Jianmei[4] et al. constructed a three-level fractal model based on SIR extended non-uniform infection model(susceptible-infected-removed) in China, Wuhan city and Hubei province. The study shows that isolation is an effective method to control the epidemic, and the effectiveness of intervention is evaluated through simulation analysis, which provides a useful reference for China and other countries in the world to judge the risk of the epidemic, master the rhythm of epidemic intervention, and develop prevention and control strategies. Nathaniel S[5] et al. take Wuhan as an example, obtaining an accurate closed solution of the SIR epidemic model by using asymptotic approximation to simulate and predict the COVID-19 outbreak, so as to model and predict COVID-19. Yan Ming-jiang[6] et al. adopted an improved infectious disease transmission model ISEIR and predicted the epidemic situation of the whole country (except Hubei Province) and Hubei province respectively based on the dynamic daily effective regeneration number. Wang Siyuan[7] et al. used the improved SEIR model to predict the COVID-19 epidemic trend in Hubei Province and South Korea based on the basic regeneration number(R0) of COVID-19. ZHOU T[8] et al. used the SEIR model to predict the basic regeneration number and the cases number of COVID-19 in Wuhan. Li[9] et al. constructed the e-ISHR model to estimate the basic copy number of COVID-19 in Wuhan, simulate and predict the number of confirmed cases in Wuhan and the whole country (except Hubei Province). And the result shows the importance of isolating and increasing hospital beds to contain COVID-19. The predecessors’ studies are mostly based on the transmission model of infectious diseases, either by improving the model or by reasonably determining the basic regeneration number of COVID-19 in the study area to further simulate the COVID-19 epidemic and the number of COVID-19 cases in the study area. A large number of studies show that the SEIR model has a good simulation effect on COVID-19 and a good practicality on the epidemic prediction and simulation[10, 11]. From the perspective of geography, studies on COVID-19’s attention and spatial and temporal differences[12], epidemic evolution, spatial and temporal characteristics[13], and transmission routes have unique perspectives on the study of COVID-19[14]. However, the relationship between government control and intervention implementation(especially the population migration patterns in the context of big data) and COVID-19 outbreak control has not been fully studied[15, 16, 17]. At the same time, this is also a supplementary study on the transmission and development law of COVID-19 from the perspective of geography. In this study, we aim to analyze the impact of intercity migration indices on COVID-19 outbreak and control in Wuhan city and Hubei province.

The article is based on data of COVID-19 outbreak from January 1,2020 to April 8,2020 in Wuhan city and Hubei province, simulating the epidemic situation without human control in Wuhan city and Hubei province by using the SEIR model, estimating the effectively reduced number of COVID-19 cases in the study area after isolation, city lockdown, traffic control and corresponding intervention measures in 2020 by using the Baidu migration scale index of Hubei Province and Wuhan city in the same period of 2019 and 2020.

Figure 1 is the time series axis diagram during the epidemic period in the study area. The axis diagram marks the epidemic time and time nodes of important events in the study area.

Methods

Data source

Epidemic data is based on the real-time dynamic data of COVID-19 in Wuhan city and Hubei province from January 1 to April 8, 2020 released by The People’s Daily and Ding Xiang yuan. According to a notice issued by the Wuhan COVID-19 prevention and Control Headquarters, Wuhan suspended traffic and closed the exit routes from Wuhan at 10:00 am on January 23,2020, and the city is closed on January 23. At the same time, other prefecture-level cities in Hubei province have also carried out traffic control. Wuhan was closed until April 8,2020, and other regions in Hubei province also lifted traffic control before and after April 8. As of April 8,2020, the cumulative number of COVID-19 cases in Wuhan city and Hubei province was 67,803 and 5,0008, respectively. Figure 2 shows the spatial distribution of the number of COVID-19 cumulative infections in the study area as of April 8,2020.

The Baidu migration scale index data: From Baidu migration network, the emigration scale index and the immigration scale index of Wuhan city and Hubei province from January 1 to April 8,2019 and January 1 to April 8, 2020. Baidu migration is a big data visualization project launched by Baidu with the theme of “crowd migration”. Migration scale index: The overall scale of migration at the provincial level is divided into inter-provincial migration and migration out; the migration in or migration out at the city level is differentiated. The urban migration boundary adopts the shape and government division of the city, including the district, county, township and village under the jurisdiction of the city. The migration scale index of this paper is equal to the sum of the emigration scale index and immigration scale index.

SEIR model and relevant parameters

The National Health Commission stated in its 26 January 2020 release that COVID-19 is contagious during the incubation period. Therefore, the SEIR model can simulate the transmission process of virus accurately. The epidemic model of SEIR, which includes latent infectivity, involves susceptible population, exposed population, infected population and removed population. This model sets the assumptions:(1) The transmission process of the epidemic is limited to human-to-human transmission. The transmission mode is contact transmission, and other forms of transmission are not considered for the time being. (2) There is no effective curing medicine or vaccine at this stage. (3) The influence of external environment on parameters such as case fatality rate is not considered. (4) Natural births, deaths and international movements of the population are not considered.

Figure 3 shows Si,Ei,Ii,Ri and represents the number of susceptible persons, exposed persons, infected persons and removed persons on day I respectively. “r” represents the average number of daily contacts per infected person. “r1”represents the average number of daily contacts per exposed person. “α”represents the prevalence rate of an exposed person. “β” represents the probability of transmission by contacting with an infected person. “β2” represents the probability of transmission by contacting with an exposed person. “γ” represents the recovery rate of infected persons. “k” represents the death rate of infected persons. The differential equations of SEIR model are as follows.

Among them, “i” is the number of days of transmission of COVID-19. “N” is the total number of persons. (N=Si+Ii+Ri+Ei) The determination of parameters in the model are as follows.

The total number N: The statistics bureau of Hubei Province showed that the permanent resident population of Hubei province was 59.27 million at the end of 2018, and that of Wuhan city was 11,21.2 million at the end of 2017[18].

When COVID-19 is spreading rapidly, Wuhan city and Hubei province adopt corresponding intervention measures to inhibit the spread of the epidemic. Assuming that both the average number of daily contacts per infected person and exposed person are 10 before Wuhan city and Hubei province take traffic control measures.

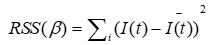
Using the data published by the National Health Commission, referring to the β and β2 of some relevant studies[19][20], and then we use the residual sum of squares between the predicted value and the true value minimized by the least square method, estimating the value of β and β2 by the following formula.(β=β2≈0.048)

The recovery rate of infected persons γ: According to the daily count of newly diagnosed and cured persons (no control of government) in Wuhan city and Hubei province before January 23, 2020, the value of γ is about 0.125. (γ≈0.125)

The prevalence rate of an exposed person α: Referring relevant literatures[21], the prevalence rate of an exposed person is determined to be 0.1.(α=Ii/Ei)

The basic regeneration number R0: R0 refers to the number of people infected by each patient during the course of the illness at the beginning of the illness, assuming that all persons are susceptible. Based on the SEIR model, R0 is calculated as follows.

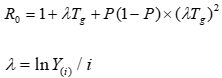
λ is the rate of early infection in the formula.Yi is the number of infected persons up to the time of “i”. Referring to relevant literatures[22][23], Tg is between 7 and 10 in this article, and P is calculated as 0.7. By substituting the P value into the above formula, R0 is calculated to be between 1.89 and 2.35, and the R0 calculation result is reasonable[24].

Results

The prediction of COVID-19 trends by SEIR model in Wuhan city and Hubei province

Prediction results: According to the relevant parameters in the equation, basic regeneration number and key parameters are shown in Table 1 below. Based on the MATLAB, using the SEIR model and simulating the cumulative number of cases in Wuhan city and Hubei province respectively, the prediction results are shown as the Fig. 4.

Table 1

The basic regeneration number and key parameters based on the SEIR model

parameter

Tg

Y(i)

i

R0

value

7

50008

100

1.89

value

10

50008

100

2.35

value

7

67803

100

1.89

value

10

67803

100

2.35

Note: The cumulative number of cases in Wuhan city is 50,008 and that in Hubei province is 67,803 as of April 8,2020.

As can be seen from the above Fig. 4, the cumulative number of COVID-19 cases in Wuhan city and Hubei province simulated by the SEIR model reached the peak at March 13,2020 and March 23,2020 respectively without control and intervention measures. But due to the active and effective prevention and control measures taken by governments at all levels and relevant departments, the cumulative number of COVID-19 cases in Wuhan city and Hubei province has reached the peak at March 17,2020 actually. The study shows that the SEIR model can better simulate the cumulative number of COVID-19 cases in Wuhan city and Hubei province. Due to the implementation of relevant intervention measures, the time when the cumulative number of patients in provincial and municipal regions reached the peak has differences. At the same time, differences in the intensity and timing of interventions across prefectural cities have resulted in the cumulative number of COVID-19 cases simulated by model in the provincial regions being delayed more than the actual number. In Wuhan city, because of the stricter control measures of government and personnel flow control, the peak time of the cumulative number of COVID-19 cases simulated by the model has come earlier. This is also the same as the previous studies[25], and with the corresponding interventions, the cumulative number of COVID-19 cases is declining continually after the peak.

The time series fitting of daily new COVID-19 cases during government intervention

According to the actual number of daily new COVID-19 cases in Wuhan city and Hubei province, the number of daily new COVID-19 cases had reached the peak on February 4,2020 since the government took the intervention. The Fig. 5 above shows that the number of new cases in Wuhan city and Hubei province from January 23 to April 8,2020 shows a skewed normal distribution in terms of time series. R2 is 0.87 and 0.92 respectively in the fitting function, showing a good fitting effect. The result shows that the control measures and relevant interventions of government don’t immediately have an effect on controlling the COVID-19 transmission in Wuhan city and Hubei province but effectively control the COVID-19 transmission about 14 days (the incubation period of COVID-19) after the implementation of the COVID-19 intervention.

The relationship fitting between intercity traffic control and daily new COVID-19 cases in Wuhan city and Hubei province

Figure 6 shows the relationship fitting between intercity traffic control and daily new COVID-19 cases in Wuhan city and Hubei province. By constructing a functional relationship between the number of daily new COVID-19 cases in the study area at January 23,2020 to April 8,2020 and the intercity migration index in the same period, it aims to quantify the relationship between intercity traffic control and COVID-19 transmission in the study area. But by simulating the number of daily COVID-19 cases in Hubei province and the function of migration scale index on Baidu, the function fit between intercity traffic control and the number of COVID-19 cases is not ideal. This may due to the fact that Baidu migration scale index does not involve migration, gathering, personal health protection measures and isolation of people in a small area (such as different districts in the same city). The impact of these related government control measures on the number of daily new COVID-19 cases can’t be ignored. But due to the function fitting value of R2 (0.40 and 0.44) between the Baidu migration scale index and the number of daily new cases, it can be seen that the intercity traffic control has a certain inhibitory effect on the number of daily new COVID-19 cases in Hubei province.

Intercity traffic control and government interventions have effectively reduced the number of COVID-19 cases in Wuhan city and Hubei province

Based on the basic regeneration number, Fig. 7 shows the actual and simulated changes in confirmed cases in Wuhan city and Hubei province during the period of traffic control and related interventions. The result shows that there is a difference of 1,253,433 people between the number of diagnosed patients in simulated daily life in Hubei province and the actual number of diagnosed patients in actual daily life, and a difference of 953,202 people in Wuhan city. Intercity traffic control and government interventions can effectively reduce the spread and development of COVID-19 in Wuhan city and Hubei province, with an effective rate of 52%.

Discussion

At present, SI, SIR, SIRS, SEIR and regression analysis are commonly used models of epidemic transmission. Among them, SEIR model is more suitable for COVID-19 simulation. Because the COVID-19 has a certain incubation period, SEIR model is more and more widely used in epidemic simulation prediction. This article confirms the relevant parameters of SEIR model by referring to the relevant research of predecessors, and uses MATLAB to establish the SEIR model, simulating the trend of free onset of COVID-19 in Wuhan city and Hubei province, comparing with the actual COVID-19 epidemic data in the study area. By comparing the Baidu migration scale index in 2019 and 2020(from January 23 to April 8), it is concluded that with the government control policies and intercity traffic control, the number of COVID-19 cases in Wuhan city and Hubei province has effectively reduced 1,253,433 people and 953,202 people respectively. Traffic control and relevant intervention measures can effectively reduce the spread and development of COVID-19 in Wuhan city and Hubei province, with an effective rate of 52%. At the same time, by modeling and simulation and using causal inference methods, it can be simulated and reversed the decision-making and implementation of major public health emergencies, so as to improve the social governance ability of governments at all levels to deal with major public health emergencies[26].

The research of this article also has some shortcomings: Traffic control based on intercity Baidu migration index data does not reflect the quantification of effective reduction in the number of COVID-19 transmission and development in Wuhan city and Hubei province. The Baidu migration data are suitable for a large range of population mobility, which can’t reflect a small range of population mobility. It is impossible to quantify the contribution of a specific measure to the spread of epidemic when prevention and control of isolation, strengthening of personal health protection measures and traffic control etc are going on at the same time.

Conclusion

In conclusion, this article collected and collated the COVID-19 official network epidemic notification data from January 1,2020 to April 8,2020 in in Wuhan city and Hubei province, and analyzed the development law of COVID-19 from the outbreak of the epidemic to the period of traffic control in Wuhan city and Hubei province by establishing the SEIR epidemic dynamics model. And the SEIR model was used to estimate the incidence of COVID-19 without human control measures, and the actual incidence of COVID-19 with government control policies and traffic control, in order to quantify the number of COVID-19 cases reduced and the effective rate. The analysis results show that:①Without human control, the cumulative number of COVID-19 cases had reached the peak on the 127th day, namely April 12 in Hubei province and the 52th day after Wuhan was closed down, namely March 14 in Wuhan city .②From January 23,2020 to April 8,2020, the number of daily new COVID-19 cases in Wuhan city and Hubei province shows a skewed normal distribution in terms of time series. ③The intercity traffic control has a certain inhibitory effect on the number of daily new COVID-19 cases in Hubei province. ④There is a difference of 1,253,433 people in Hubei province between the number of diagnosed patients in simulated daily life and the actual number of diagnosed patients in actual daily life, and a difference of 953,202 people in Wuhan city. The intercity traffic control and government intervention measures can effectively reduce the spread and development of COVID-19 in Wuhan city and Hubei province, with an effective rate of 52%. ⑤Prevention and control of isolation, strengthening of personal health protection measures and traffic control can effectively curb the widespread of COVID-19 and the rapid growth of the number of infected people.

Based on the SEIR model established in this article, the COVID-19 epidemic in Wuhan city and Hubei province is retrospectively analyzed. The research results confirm that the SEIR model is reliable in the spread of infectious diseases and can provide theoretical support for the intervention decision of other countries and regions in the world. However, there are some differences between the model and the reality inevitably, which lead to some deviations in the analysis and prediction results.

Abbreviations

COVID-19: Coronavirus disease 2019; WHO: World Health Organization; RNA: Ribonucleic Acid; SIR: susceptible - infectious – recovered model; SEIR: susceptible - exposed - infectious – recovered model; RSS: residual sum of squares; MATLAB: matrix laboratory; SI: susceptible - infectious model

Declarations

Acknowledgements

Not applicable

Ethics approval and consent to participate

Not applicable

Authors' contributions

SHL contributed to the conception, data analysis and interpretation of the results. LX contributed to the conception and interpretation of the results. ZSYH drafted the manuscript and all authors were involved in its review and revision. All authors read and approved the final manuscript.

Funding

This work was supported by the National Natural Science Foundation, China (41861053).

Availability of data and materials

The datasets supporting the conclusions of this article are available from Baidu migration data (http://qianxi.baidu.com/), Hubei Provincial Bureau of Statistics (http://tjj.hubei.gov.cn/).

The datasets used and/or analyzed during the current study are available from the corresponding author Ling XIE on reasonable request.

Consent for publication

Not applicable.

Competing interests

The authors declare that they have no competing interests.

Author details

1 College of Environment and Resources, Guangxi Normal University, No.15 Yucai Road, Qixing District, Guilin, Guangxi 541004, China

2 College of Environment and Resources, Xinjiang University, No.14 Shengli Road, Urumqi, Xinjiang 830046, China

3 Department of Geography, Beijing Normal University, No.19 Xinjiekouwai street, Haidian District, Beijing 100875, China

References

  1. Ding Yu, Luo Sihui, Zheng Xueying, Ling Ping, Yue Tong & Weng Jianping(2020). Association between population migration and epidemic control of Coronavirus disease 2019; 63(6): 936–939.
  2. GU Chao-lin, ZHU Jie, Sun Yi-fei, et al. The inflection point about COVID-19 may have passed[J]. Science Bulletin.2020;65:865–867.
  3. Fan Ruguo, Wang Yibo, Luo Ming, et al. New pneumonia transmission model and inflection point prediction based on SEIR. Journal of Electronic Science and Technology. 2020;49(03):369–374.
  4. Wang Jianmei, Li Gang novel coronavirus pneumonia infection model and intervention analysis. Journal of Electronic Science and Technology. 2020; 49(03):392–398.
  5. Barlow Nathaniel S., Weinstein Steven J.. Accurate closed-form solution of the SIR epidemic model. Physica D. 2020; https://doi.org/10.1016/j.physd.2020.132540
  6. Yan Mingjiang, Dong Yihong, Jia Xiangen, et al. Epidemic trend prediction of novel coronavirus pneumonia 36.04(2020):560–569. https://doi.org/10.13242/j.cnki.bingduxuebao.003712.
  7. Wang Siyuan, Tan Hanlin, Li Dongjie.Prediction of a novel coronavirus pneumonia based on improved infection kinetics susceptibility exposure infection recovery (SEIR) mode. Journal of the Second Military Medical University: 41.06(2020):637–641. doi:10.16781/j.0258-879x.2020.06.0637.
  8. Zhou T, Liu Q, Yang Z, Liao J, Yang K, Bai W, et al. Preliminary prediction of the basic reproduction number of the Wuhan novel coronavirus 2019-nCoV. J Evid Based Med. 2020,13:3–7.
  9. Li, S., Song, K., Yang, B. et al. Preliminary Assessment of the COVID-19 Outbreak Using 3-Staged Model e-ISHR. J. Shanghai Jiaotong Univ. 2020;25, 157–164.
  10. Zhang Lin. Fitting and forecasting of novel coronavirus pneumonia epidemic growth model. Journal of Electronic Science and Technology. 2020; 49(03):345–348.
  11. Xu Xiaoke, Wen Cheng, Zhang Guangyao, et al. Geographical distribution and influence novel coronavirus pneumonia outflow in Wuhan.Journal of Electronic Science and Technology. 2020; 49(3):324–329.
  12. Sun Yuting, Xiao Fan, Zhou Yong, Tian Guangzeng. Spatial-Temporal Distribution and Influence Mechanism of Internet Public Attention on COVID-19: A Case Study on the Baidu Searching Index. Tropical Geography. 2020;40(3):375–385. doi:10.13284/j.cnki.rddl.003244.
  13. Wang Jiaobei, Li Gang, Wang Jianpo, Qiang Jingqi, Zhu Dandan. Spatio-Temporal Evolution and Risk Profiling of the COVID-19 Epidemic in Shaanxi Province[J]. Tropical Geography. 2020;40(3):432–445. doi:10.13284/j.cnki.rddl.003246.
  14. Liu Zhengqian, Ye Yuyao, Zhang Hong’ou, Guo Hongxu, Yang Ji, Wang Changjian. Spatio-Temporal Characteristics and Transmission Path of COVID-19 Cluster Cases in Zhuhai[J]. Tropical Geography. 2020; 40(3): 422–431. doi:10.13284/j.cnki.rddl.003228.
  15. YANG Hua-lei, WU Yuan-yang, LIN Xue-yu. New Coronavirus Pneumonia, Population Migration and Epidemic Prevention and Control. Chinese Journal of Management Science. 2020;28(03):1–10. doi:10.16381/j.cnki.issn1003-207x.2020.03.001.
  16. Zhou Jibiao, Ma Changxi, Dong Sheng, et al. City public transport under novel coronavirus pneumonia epidemic prevention strategy: a case study of Ningbo City. Journal of China highwa. 2020; 33(11):1–10. doi:10.19721/j.cnki.1001-7372.2020.11.001.
  17. Zhao Xumao, Li Xinhai, Nie Changhong. China's epidemic control novel coronavirus pneumonia based on big data backtracking.Journal of the Chinese Academy of Sciences. 2020; 35(3):248–255. doi:10.16418/j.issn.1000-3045.20200210002.
  18. Hubei Provincial Bureau of Statistics. http://tjj.hubei.gov.cn. (Accessed 1 March 2020)
  19. Xu Juan Nian, Ma ran, Zhao Zhong Rui. Preliminary prediction of novel coronavirus pneumonia epidemic in Shandong. Journal of Chongqing Normal University (NATURAL SCIENCE EDITION). 2020; 37(2):101–106.
  20. CAI Jie, JIA Hao-yuan, WANG Ke. Prediction of development trend of COVID-19 in Wuhan based on SEIR model. Shandong Medical Journal. 2020; 60(6):1–4.
  21. Geng Hui, Xu anding, Wang Xiaoyan, et al.Analysis of novel coronavirus pneumonia epidemic situation based on SEIR model. Journal of Jinan University (Natural Science and medicine). 2020; 41(2):175–180.
  22. Zhou Tao, Liu Quanhui, Yang Zimo, et al. Preliminary prediction of novel coronavirus pneumonia's basic reproduction number. Chinese Journal of evidence based medicine. 2020; 20(3):359–364.
  23. Joseph T. Wu, Kathy Leung, Gabriel M. Leung. Nowcasting and Forecasting the Potential Domestic and International Spread of the 2019-nCoV Outbreak Originating in Wuhan, China: A Modeling Study. Obstetrical & Gynecological Survey. 2020; 75(7):399–400 doi: 10.1097/01.ogx.0000688032.41075.a8
  24. Zhao Shi, et al."Preliminary estimation of the basic reproduction number of novel coronavirus (2019-nCoV in China, from 2019 to 2020: A data-driven analysis in the early phase of the outbreak." International Journal of Infectious Diseases. 2020; 92(prepublish):214–217.
  25. Fang Yaqing, Nie Yiting, Penny Marshare. Transmission dynamics of the COVID-19 outbreak and effectiveness of government interventions: A data-driven analysis. Journal of medical virology. 2020;92(6): 645–659
  26. You Guangrong, you Guangrong, you Hanlin, etc.Causal analysis of novel coronavirus pneumonia epidemic spreading model and prevention and control intervention measures. Science and technology guide. 38.06(2020):90–96. doi:.