A kind of lead halide perovskites (LHPs) with aggregation-induced emission (AIE) feature is used as a fluorescent probe for cholesterol detection. LHPs exhibit a high emission when they aggregate in water. However, β-cyclodextrin modified gold nanoparticles (β-CD@AuNPs) cause the AIE quenching of LHPs. Based on the host-guest recognition between β-cyclodextrin (β-CD) and cholesterol, LHPs are replaced by cholesterol, resulting in the AIE recovery of LHPs. A linear range of cholesterol is obtained from 0.35 to 20 nM with the limit of detection 0.12 nM which is lower than the most reported methods. This is because only a few pM β-CD@AuNPs quench the AIE of LHPs. Furthermore, phytosterols cannot interfere with the detection of cholesterol due to the different affinities of cholesterol and phytosterols for β-CD. Finally, this method is applied to detecting cholesterol in egg, milk, and pork. Additionally, cholesterol in milk powder containing phytosterols has been determined with good recoveries.
Research Article
Accurate detection of cholesterol in the presence of phytosterols in food samples based on lead halide perovskites with aggregation-induced emission
https://doi.org/10.21203/rs.3.rs-1583868/v1
This work is licensed under a CC BY 4.0 License
You are reading this latest preprint version
perovskite halides
β-CD modified gold nanoparticles
aggregation-induced emission
food.
Cholesterol is the most important risk factor for inducing atherosclerotic cardiovascular diseases, such as peripheral artery disease and ischemic stroke (Gylling, et al. 2020). One part of cholesterol is produced by the liver, and the other part is ingested from food (Li, et al. 2019). The National Cholesterol Education Program recommends that the cholesterol intake of the general population is under 300 mg/day (Ishinaga, et al. 2005). When the blood cholesterol content of the human body exceeds 100 mg/dL, it is necessary to reduce the intake of cholesterol by controlling the diet (Grundy, et al. 2004). The therapeutic lifestyle proposes that patients with high cholesterol should consume less than 200 mg/day of cholesterol. Therefore, it is necessary to detect cholesterol in food to guide diet.
The most commonly used method to detect cholesterol clinically is Trinder reaction (Van Gent, et al. 1977), where cholesterol oxidase (ChOx) catalyzes the oxidation of cholesterol to produce hydrogen peroxide (H2O2). In the presence of peroxidase, 4-aminoantipyrine is oxidized by H2O2 to generate a red quinone imine compound. This method is proper to determine cholesterol in blood with good selectivity. However, it is not suitable for cholesterol measurement in food. The reason is that some phytosterols, such as sitosterol and stigmasterol are usually in foods (e.g. milk powder and vegetable oil), and their structures are similar to that of cholesterol (Tolve, et al. 2020). Phytosterols can also be catalyzed by ChOx to H2O2 (MacLachlan, et al. 2000), resulting in the interference of cholesterol detection. In addition, ascorbic acid is rich in food, and it can reduce H2O2. Thus, the enzymatic methods are inappropriate to detect cholesterol in food samples.
For another, non-enzymatic ways show a comparable sensitivity and selectivity due to the components that can specifically recognize cholesterol. For instance, cholesterol can be inserted into the β-cyclodextrin (β-CD) cavity by host-guest interactions. In this way, the nano-probes, such as carbon quantum dots (CQDs) (Li, et al. 2019) and luminescent metal-organic framework (LMOF) (Gong, et al. 2019), in the cavity of β-CD were pushed out, producing the fluorescence recovery. Although the affinity of phytosterols for the β-CD is inferior to that of cholesterol because of the structural differences, the phytosterols can also enter into the macrocyclic cavity of β-CD. Moreover, the nano-probes exhibit the weakest affinity for β-CD. Thus, the phytosterols in food also interfere with the detection of cholesterol in non-enzymatic ways. Developing a fluorescent way for cholesterol detection in food with good sensitivity and selectivity is still challenging.
In 2015, Zhong’s group have exploited a new kind of lead halide perovskites (LHPs) with aggregation-induced emission (AIE) (Niu, et al. 2015). Through a rapid precipitation method, the LHPs were synthesized by dodecyl ammonium iodide (C12H25NH3I) and lead iodide (PbI2), and they show strong fluorescence when aggregate in water. This AIE behavior offers the possibility of fluorescence detection based on LHPs. In this paper, it is found that the β-CD modified gold nanoparticles (β-CD@AuNPs) can quench the AIE of LHPs effectively. The reason may be that by host-guest interaction the dodecyl ligand of LHPs can enter into the cavity of β-CD. However, the cholesterol reveals the highest affinity for β-CD, so the addition of cholesterol replaces LHPs from the cavity, leading to the AIE recovery of LHPs. Based on this principle, cholesterol can be detected sensitively with the linear range from 0.35 to 20 nM. The limit of detection (LOD) of cholesterol is 0.12 nM, which is more sensitive than most reported works. Additionally, it should be noted that phytosterols do not interfere with the detection of cholesterol in food samples by this strategy, because the affinity of LHPs for β-CD is higher than phytosterols. Last but not the least, cholesterol has been successfully determined in egg, milk powder, pork, and milk. The results can provide guidance for scientific diets.
2.1 Chemicals and materials
Hydroiodic acid, dodecanamine [CH3(CH2)11NH2], lead iodide (PbI2), tetrahydrofuran (THF), β-cyclodextrin (β-CD), chloroauric acid (HAuCl4·4H2O), cholesterol, N, N-dimethylformamide (DMF), isopropanol, β-sitosterol, lactose, ascorbic acid, Vitamin D2, Vitamin B, and oleinic acid were obtained from Aladdin Reagent Co., Ltd. (Shanghai, China). Palmitic acid was purchased from Yuanye Biotechnology (Shanghai, China). KCl, NaCl, MgCl2, CaCl2, and ZnCl2 were obtained from Tianjin Guangcheng Chemical Reagent Co., Ltd. (Tianjin, China). The enzyme-linked immunosorbent assay (ELISA) kit was purchased from Baolai Biotechnology Co., Ltd (Jiangsu, China). The food samples were collected from local supermarkets. All chemicals were of analytical grade and were used without further purification. All aqueous solutions were prepared with deionized water.
2.2 Instruments
The fluorescence was recorded by Hitachi F-7000 fluorescence spectrophotometer (Hitachi, Japan). Fourier transform infrared spectroscopy (FT-IR) was carried out (via the KBr pellet method) using a Thermo Nicolet Nexus 470 FT-IR ESP spectrometer (Thermo Nicolet, USA). A Cary 300 Bio UV-vis spectrophotometer was used to measure absorption spectra (Varian, USA). The fluorescence lifetimes were recorded using a Fluorolog-3-21 fluorescence spectrometer (Horiba Jobin Yvon, USA).
2.3 Synthesis of C12H25NH3I
According to the previously reported literature (Niu, et al. 2015), stoichiometric quantities of hydroiodic acid solution were dropped into dodecanamine [CH3(CH2)11NH2] solution (40 wt% in ethyl alcohol) at 0 oC with stirring. In a rotary evaporator, the mixture was evaporated under reduced pressure at 50°C for 2 hours. Thereafter, the resulting solid was filtered and washed with diethyl ether several times and dried at 50 oC for 1 d.
2.4 Synthesis of LHPs
The LHPs were synthesized according to the previous method (Niu, et al. 2015). C12H25NH3I (0.13 g, 0.20 mmol) and PbI2 (0.92 g, 0.10 mmol) were added in THF (1.0 mL) and sonicated to a clear yellow solution. The solution was filtered through a Teflon filter (pore size: 0.2 µm). Deionized water (19.0 mL) was injected rapidly. Then the mixture was stirred vigorously for 2 h. After aggregates formed, the suspension was separated by centrifugation (7000 rpm/3 min). It was dried at room temperature in a dryer. What's more, the concentration of LHPs which is used in the following experiments is 50 mg/mL.
2.5 Preparation of β-CD@AuNPs
The β-CD@AuNPs were prepared by the citrate reduction method (Zhao, et al. 2016). At first, all glasswares were washed with aqua regia (mixture of HCl and HNO3 at a 3:1 ratio) and then with deionized water. Typically, 15 mL of PBS (0.1 M, pH 7.0), 3 mL of HAuCl4 (0.01 M) and 30 mL of β-CD (0.01 M) were added in 105 mL water, and vigorously stirred. Then, the mixture was heated to 100 oC for 60 min. When the β-CD@AuNPs is formed, the solution gradually changed from light yellow to wine red. At last, it was cooled to room temperature and preserved at 4 oC for future use. According to an extinction coefficient of 6.31×10⁸ M− 1cm− 1 at 450 nm, the concentration of the β-CD@AuNPs solution was approximately 0.4 nM by calculating (Haiss, et al. 2007).
2.6 Fluorescence detection of cholesterol
First, different concentrations of cholesterol were reacted with 23 µL β-CD@AuNPs (0.4 nM) for 30 min. Then, 25 µL DMF solution of LHPs (50 mg/mL) were added into the above mixture and the final volume was adjusted to 1 mL with deionized water. The fluorescence spectra of the samples were measured after 30min of reaction, and the excitation wavelength is 365nm. A calibration curve is constructed by the fluorescence ratio of (F2-F1)/F1 (F1 and F2 representing the fluorescence intensities of the LHPs at 515 nm in the presence of β-CD@AuNPs before and after addition of cholesterol, respectively).
2.7 Real sample detection
The real samples were processed according to the previous method (Albuquerque, et al. 2016). Firstly, a proper sample-pretreatment was required. For instance, pork was chopped, and an egg was stirred. The milk powder was dissolved, and the milk was taken out directly. Subsequently, in a 50 mL tube, 1 g or 1 mL of sample was weighed, and 5 mL of ethanolic KOH (0.4 M, w/v) were added. Samples were heated in a water bath at 50°C for 30 min. Afterwards, the mixture was cooled at room temperature, and 5 mL of deionized water was added and thoroughly mixed in a vortex. The solution was extracted twice with 10 mL of n-hexane. The combined extracts were dried and then redissolved in 3 mL of isopropanol. After that, deionized water was added to the obtained solution to an appropriate concentration. The final mixture was analyzed as described in the “Fluorescence detection of cholesterol” section. Finally, the spike experiment was carried out. Different concentrations of the standard cholesterol solutions were spiked into the unprocessed samples. Then, the spiked samples were treated as mentioned above and then analyzed.
3.1 Characterizations of LHPs and β-CD@AuNPs
Typically, N, N-dimethylformamide (DMF) is a good solvent for LHPs, our group has studied the AIE feature of LHPs in DMF/water mixtures (Qu, et al. 2021). As shown in Fig. 1a, LHPs are highly dispersed in nano-scale irregular shapes in Transmission electron microscopy (TEM) image. However, LHPs aggregate significantly in water, and some micrometer-sized sticks are observed in the TEM image (Fig. 1b). Meanwhile, the emission of LHPs in DMF is extremely low, while the aggregated ones in water emit strong fluorescence (Fig. 1c). The AIE behavior of LHPs in water is supported by these results.
Figure 1
On the other hand, through the one-step colloidal synthesis method, the β-CD@AuNPs with wine-red color are prepared (Zhao, et al. 2016; Zhang, et al. 2019). The Fourier transform infrared spectroscopy (FT-IR) spectra (Fig. 2a) display the characterized surface groups of β-CD@AuNPs and β-CD. The peak of β-CD at 1640 cm− 1 corresponds to the stretching vibrations of O-C-O (Zhang, et al. 2019). However, its blue shifts to 1624 cm− 1 in the FT-IR spectrum of β-CD@AuNPs. This reason is that the hydroxy groups in β-CD reduce Au3+ into Au0, and the hydroxy groups themselves are oxidized to carboxyl groups (Zhao, et al. 2016). Furthermore, the peaks at 3430 and 1160 cm− 1 are the stretching vibrations of O-H and C-O in the FT-IR spectra of β-CD and β-CD@AuNPs. Additionally, these nanoparticles are mostly spherical particles and highly dispersed in solution (Fig. 2b). The diameter of β-CD@AuNPs is mainly around 21 nm. These results illustrate that β-CD@AuNPs are successfully synthesized with good solubility in water.
Figure 2
3.2 The interaction between β-CD@AuNPs and LHPs
A high AIE is shown by the aggregations of LHPs. However, the AIE is quenched with an increasing concentration of β-CD@AuNPs. A good linear relationship (R2 = 0.998) between the quenching efficiency and the concentrations of β-CD@AuNPs is from 5.2 to 10 pM (Fig. 3b). As well known, a variety of substances, such as CQDs (Li, et al. 2019), rhodamine B (RB) (Zhao, et al. 2016), CuInS2 quantum dots (Hu, et al. 2017), and so on, can be quenched by β-CD@AuNPs. The above reports use the concentrations of the β-CD@AuNPs in the nanomolar range. However, only 10 pM β-CD@AuNPs can quench the AIE of LHPs by about 87%. This phenomenon illustrates the sensitive response of LHPs to β-CD@AuNPs.
The quenching mechanism of LHPs by β-CD@AuNPs is investigated. The surface plasmon peak of β-CD@AuNPs in the UV-vis spectrum (Fig. 3c) appears at 533 nm. This result overlaps well with the emission of the LHPs. Hence, the inner filter effect (IFE) or Förster resonance energy transfer (FRET) may be causing the effective fluorescence quenching of LHPs by β-CD@AuNPs (Shang, et al. 2009; Jares-Eruman, et al. 1997). Different from IFE, the fluorescence lifetime decreases in FRET (Koushik and Vogel 2008). Figure 3d suggests that after adding β-CD@AuNPs, the fluorescence decay time of LHPs is from 1.86 to 0.64 ns. As a result, the fluorescence quenching of LHPs by β-CD@AuNPs is mostly based on FRET rather than IFE. Moreover, FRET is distance-dependent and occurs when the donor and acceptor are brought close to one another (Varghese, et al. 2010). The TEM image of LHPs after adding β-CD@AuNPs (Fig. S1) shows that many β-CD@AuNPs are attached to the surface of LHPs. It is reasonable to speculate that by host-guest interactions the ligand dodecanamine of LHPs may enter into the macrocyclic cavity of β-CD. Thus, this close distance provides a favorable condition for FRET. Additionally, the FRET efficiency can be assessed by Eq. (1) (Biju, et al. 2006; Qu, et al. 2021):

where τ0 (τ0 = 1.86 ns) and τ (τ = 0.64 ns) are the fluorescence lifetimes of the LHPs in the absence and presence of the β-CD@AuNPs at the concentration of 12.4 pM. The result indicates that approximately 66% of the quenching is attributed to the FRET by calculating.
Figure 3
To further investigate the remaining quenching effect, static quenching effect (SQE) and dynamic quenching effect (DQE) are analyzed according to the Stern-Volmer Eq. (2) (Xiang, et al. 2007):
$${\text{F}}_{\text{0}}\text{/F=1+}{\text{K}}_{\text{sv}}\left[\text{Q}\right]$$
2
where F0, F are the fluorescence intensities of LHPs in the absence and presence of β-CD@AuNPs, respectively; Ksv is the Stern–Volmer quenching constant, and [Q] is the concentration of β-CD@AuNPs. At different temperatures, the concentration of β-CD@AuNPs remains linear with the fluorescence intensity ratios (\({\text{F}}_{\text{0}}\text{/F}\)) (Fig. S2). One type of quenching mechanism (SQE or DQE) is predominating by the liner Stern–Volmer plots (\({\text{F}}_{\text{0}}\text{/F}\) versus [Q]) revealing (Xiang, et al. 2007). During the excited state, DQE is ascribed to the collisional encounters between the quencher and the fluorophore. Higher temperature promotes molecular diffusion. This phenomenon leads to an increase in the Ksv. For SQE, between the fluorophore and quencher forms a nonfluorescent ground-state complex. The temperature increment causes a decrease in the stability of the complex, leading to a smaller value of Ksv (Legrand, et al. 2021). The obtained Ksv values from Stern-Volmer slopes in Fig. S2 at 277, 288, 298, and 313 K are 5.435 ⋅ 1010, 4.682 ⋅ 1010, 4.315 ⋅ 1010 and 3.698 ⋅ 1010 M− 1, respectively. With increasing temperature, these Ksv values show a tendency that is gradually decreasing. The result proves that another mechanism of the β-CD@AuNPs quenching LHPs is DQE instead of SQE. The ground-state complexes formed between β-CD@AuNPs and LHPs are validated by UV-vis absorption spectra. The characteristic absorption peaks of LHPs and the surface plasmon peak of β-CD@AuNPs disappear when β-CD@AuNPs and LHPs are mixed (Fig. S3). Therefore, β-CD@AuNPs induce significant fluorescence quenching of LHPs via a combination of FRET and SQE.
3.3 Detection of cholesterol
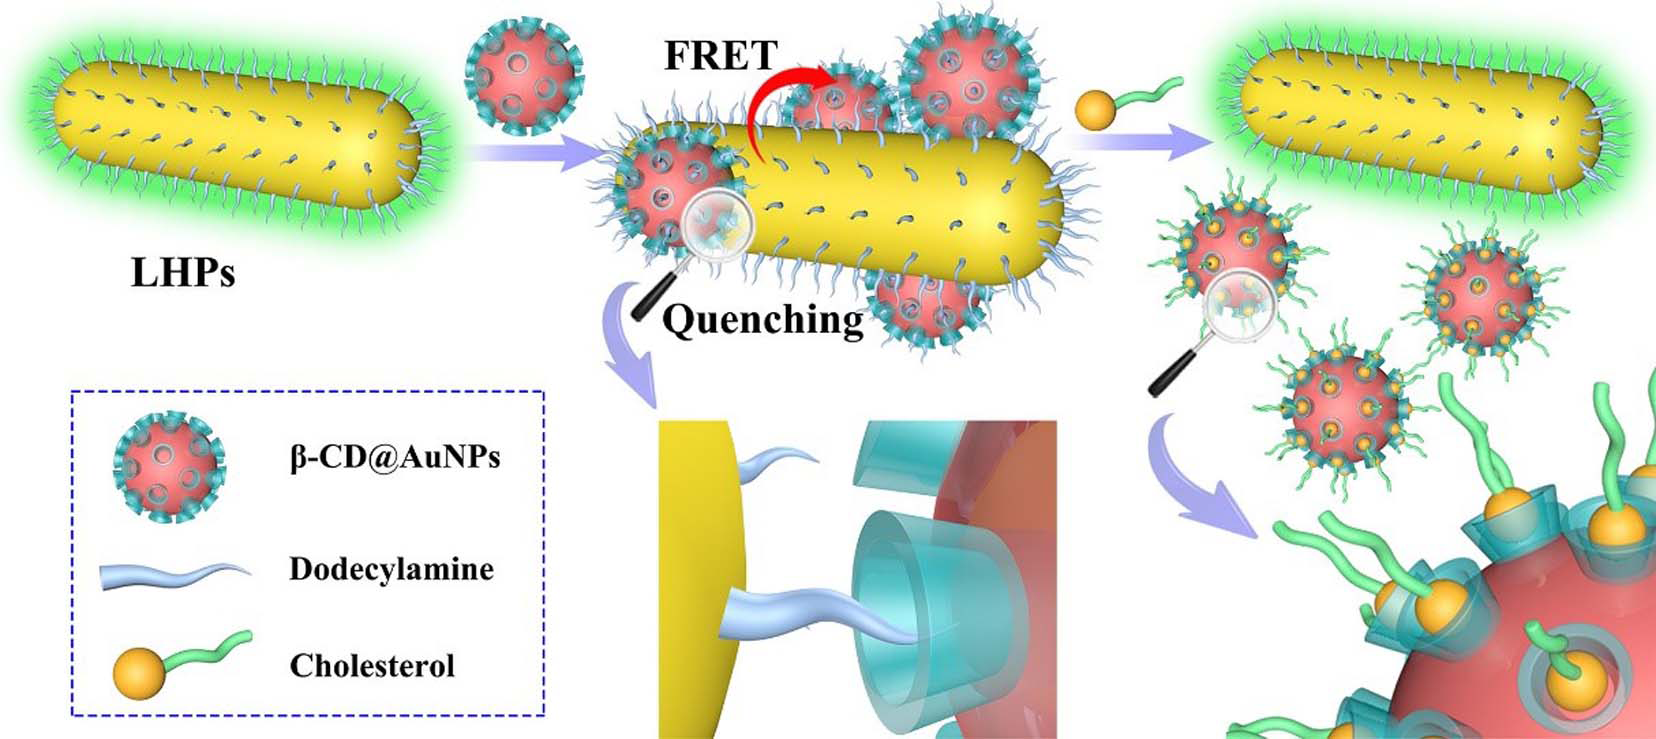
As shown in Fig. 4, there is no reaction between cholesterol and LHPs, because cholesterol does not affect the AIE of LHPs. However, β-CD@AuNPs quench effectively the AIE of LHPs. When cholesterol and β-CD@AuNPs are preincubated, cholesterol can enter the macrocyclic cavity due to the strong hydrophobicity of the cholesterol structure (Zhao, et al. 2016). Thus, the ligand dodecylamine of LHPs cannot enter the cavities of β-CD, resulting in the fluorescence recovery of LHPs. Under UV lamp at 365 nm (inset in Fig. 4), the above phenomenon is also observed. Scheme 1 illustrates the principle of detection of cholesterol based on this system.
Figure 4
Scheme 1
Experimental conditions have been optimized for the sensitive detection of cholesterol, including addition order and incubation time (Fig. S4 and S5). Under the optimized conditions, the AIE of LHPs is gradually restored with increasing concentration of cholesterol in the presence of β-CD@AuNPs (Fig. 5a). A good linear range of cholesterol is obtained from 0.35 to 20 nM (Fig. 5b). The LOD is determined to be as low as 0.12 nM. The expression which is \(\text{LOD=3σ/K}\) is used to calculate LOD, where σ is the standard deviation for the blank solution (n = 10), and K is the slope of the calibration curve (Wu, et al. 2007; Zi, et al. 2021). As summarized in Table 1, the LOD of this work is better than most reported methods involving enzyme and non-enzyme. The sensitive response of LHPs to β-CD@AuNPs may be causing the AIE of LHPs effectively quenched by β-CD@AuNPs, which the concentration of β-CD@AuNPs is only a few pM. Thus, very few amounts of cholesterol can be detected.
|
Method |
System |
Linear range |
LOD |
Refs. |
|---|---|---|---|---|
|
Electrochemistry |
ChOx / AuNPs |
0.5–48 µM |
0.26 µM |
[27] |
|
Colorimetry |
ChOx / horseradish peroxidase |
0–40 µM |
0.6 µM |
[28] |
|
Colorimetry |
ChOx / Prussian blue |
4-100 µM |
3 µM |
[29] |
|
Fluorescence |
ChOx / CdTe CQDs |
5-100 nM |
0.89 nM |
[30] |
|
Fluorescence |
ChOx / Ag nanocluster |
0.06-15 µM |
0.03 µM |
[31] |
|
Fluorescence |
CQDs / β-CD@AuNPs |
10–210 µM |
0.34 µM |
[8] |
|
Fluorescence |
β-CD@AuNPs / RB |
0.32–4.80 µM |
0.15 µM |
[11] |
|
Fluorescence |
β-CD functionalized CQDs |
3.5–110 µM |
0.7 µM |
[32] |
|
Fluorescence |
LHPs / β-CD@AuNPs |
0.35-20 nM |
0.12 nM |
This work |
Figure 5
Table 1
3.4 Selectivity
It is important to have good selectivity for real sample detection. Therefore, β-sitosterol (a kind of phytosterols), lactose, palmitic acid, vitamin B, ascorbic acid, vitamin D, oleinic acid, K+, Na+, Mg2+, Ca2+, and Zn2+ are selected as potential interference substances. As shown in Fig. 6, AIE recovery of LHPs may not be induced by these substances. In particular, ascorbic acid does not interfere with the detection of cholesterol, because there is no redox reaction in this strategy.
Nowadays, phytosterols are often added to milk powder, because phytosterols can inhibit the body absorption of cholesterol, reducing the risk of cardiovascular disease (Gylling, et al. 2020). Thus, it is important to determine cholesterol even when cholesterol and phytosterols co-exist in food. Up to now, no reports are available on the accurate detection of cholesterol in the presence of phytosterols. Herein, cholesterol can be detected when cholesterol coexists with β-sitosterol, suggesting the importance of this method. The good selectivity may be related to the different affinities of cholesterol and β-sitosterol to β-CD. The fluorescence responses of LHPs to cholesterol, dodecylamine, and β-sitosterol have been studied in the presence of β-CD@AuNPs. The fluorescence of LHPs can be restored by cholesterol and dodecylamine rather than β-sitosterol (Fig. S6). The structure of β-sitosterol has one more ethyl group than cholesterol (Fig. S7), so it is reasonable to speculate that the ethyl group increases the steric hindrance. Therefore, the affinity of β-sitosterol for β-CD is weakest compared with that of cholesterol or dodecylamine. It should be mentioned that this is the first case to accurately detect cholesterol in the presence of phytosterols.
Figure 6
3.5 Detection of cholesterol in real samples
This method is further applied to the analysis of cholesterol in foods. As illustrated in Table S1, the content of cholesterol per gram of egg is 3.62 mg; the content of cholesterol per milliliter of milk is 0.25 mg; the content of cholesterol per gram of pork is 1.46 mg. These results are similar to those obtained by ELISA as a reference method. It reveals that the detection of cholesterol based on this essay is reliable. After that, a series of cholesterol standard solutions with different levels are spiked to the food samples. And the result can verify the accuracy of the proposed method. As shown in Table S2, it is obtained that the range of the satisfactory recoveries of cholesterol is from 96.8–100.6%, revealing that the detection of cholesterol in foods is accurate based on the proposed method. The therapeutic lifestyle recommends that the intake of cholesterol in patients with high cholesterol should not exceed 200 mg/day. Hence, according to the test results, it is recommended that the daily intake of eggs does not exceed 55 g; milk does not exceed 800 g; pork does not exceed 135 g. These results can provide dietary guidance for people with high cholesterol.
It is worth noting that this method can accurately determine the cholesterol content when cholesterol coexists with phytosterols, so cholesterol is measured in milk powder, where phytosterols are added (Table S3). The cholesterol in this kind of milk powder is 1.02 mg/g, which is not much different from the labeled amount on milk powder cans (1.08 mg/g). It indicates that cholesterol can be accurately detected in presence of phytosterols by this assay.
In summary, a novel fluorescent platform that highly sensitive detects cholesterol based on LHPs and β-CD@AuNPs is developed. Compared with other probes for the determination of cholesterol, this strategy is more sensitive because the AIE of LHPs is effectively quenched by β-CD@AuNPs with only a few pM. Furthermore, this method shows a good selectivity toward cholesterol, and especially the ascorbic acid and phytosterols cannot interfere with the detection of cholesterol. This is important for the detection of cholesterol in foods. Last but not least, it is believed that this method can sensitively and accurately determine cholesterol to further evaluate the cholesterol content in food and provide support for dietary guidance.
Data availability
The data generated during the current study are included in this published article and the Supplementary Information.
Funding
This work was supported by the Shandong Provincial Natural Science Foundation, China (ZR2019QB010), National Natural Science Foundation of China (21705095, 21775088), and the Scientific Research Foundation of Qufu Normal University (BSQD20130117).
Author information
Affiliations
The Key Laboratory of Life-Organic Analysis of Shandong Province, School of Chemistry and Chemical Engineering, Qufu Normal University, Jining 272000, China
Aiqing Jiao, Fei Qu & Xian-En Zhao
Qufu Center for Disease Control and Prevention, Jining 272000, China
Wenna Ge
Department of Physical and Chemical Testing, Shandong Center for Disease Control and Prevention, Jinan 250014, China
Dafeng Jiang
Corresponding authors Correspondence to Fei Qu or Xian-En Zhao
Email address: [email protected]; [email protected]
Author Contributions
Aiqing Jiao: investigation, writing-original draft preparation; Wenna Ge: data analysis, writing-review and editing; Dafeng Jiang: resources, validation; Fei Qu: writing-review and editing, funding acquisition; Xian-En Zhao: resources, project administration.
Ethics Declarations
Ethics Approval
This article does not contain any studies with human participants or animals performed by any of authors.
Informed consent
Not applicable.
Conflict of interest
The authors declare no competing interests.
- Gylling H, Strandberg TE, Kovanen PT, Simonen P (2020) Lowering low-densitylipoprotein cholesterol concentration with plant stanol esters to reduce the risk of atherosclerotic cardiovascular disease events at a population level: a critical discussion. Nutrients 12(8):2346. https://doi.org/10.3390/nu12082346
- Li LH, Dutkiewicz EP, Huang YC, Zhou HB, Hsu CC (2019) Analytical methods for cholesterol quantification. J Food Drug Anal 27(2):375–386. https://doi.org/10.1016/j.jfda.2018.09.001
- Ishinaga M, Ueda A, Mochizuki T, Sugiyama S, Kobayashi T (2005) Cholesterol intake is associated with lecithin intake in Japanese people. J. Nutr. 135(6):1451–1455. https://doi.org/10.1093/jn/135.6.1451
- Grundy SM, Cleeman JI, Merz CNB, Brewer HB, Clark LT, Hunninghake DB, Pasternak RC, Smith SC, Stone NJ (2004) Implications of recent clinical trials for the national cholesterol education program adult treatment panel III guidelines. Circulation 110:227–239. https://doi.org/10.1016/j.jacc.2004.07.001
- Van GC, Van H, De A, Klein F (1977) Cholesterol determinations. A comparative study of methods with special reference to enzymatic procedures. Clin. Chim. Acta 75(2):243–251. https://doi.org/10.1016/0009-8981(77)90195-4
- Tolve R, Cela N, Condelli N, Cairano M, Caruso MC, Galgano F (2020) Microencapsulation as a tool for the formulation of functional foods: the phytosterols' case study. Foods 9(4):470. https://doi.org/10.3390/foods9040470
- MacLachlan J, Wotherspoon A, Ansell R, Brooks C (2000) Cholesterol oxidase: sources, physical properties and analytical applications. J. Steroid Biochem. Mol. Biol. 72(5):169–195. https://doi.org/10.1016/S0960-0760(00)00044-3
- Li Y, Cai J, Liu F, Yang H, Lin Y, Li S, Huang X, Lin L (2019) Construction of a turn off-on fluorescent nanosensor for cholesterol based on fluorescence resonance energy transfer and competitive host-guest recognition. Talanta 201:82–89. https://doi.org/10.1016/j.talanta.2019.03.110
- Gong M, Yang J, Li Y, Zhuang Q, Gu J (2019) Substitution-type luminescent MO-F sensor with built-in capturer for selective cholesterol detection in blood serum. J. Mater. Chem. C 7(40):12674–12681. https://doi.org/ 10.1039/C9TC04399C
- Niu Y, Zhang F, Bai Z, Dong Y, Yang J, Liu R, Zou B, Li J, Zhong H (2015) Aggregation-induced emission features of organometal halide perovskites and their fluorescence probe applications. Adv. Opt. Mater. 3(1):112–119. https://doi.org/10.1002/adom.201400403
- Zhao Y, Huang Y, Zhu H, Zhu Q, Xia Y (2016) Three-in-one: sensing, self-assembly, and cascade catalysis of cyclodextrin modified gold nanoparticles. J. Am. Chem. Soc. 138(51):16645–16654. https://doi.org/10.1021/jacs.6b07590
- Haiss W, Thanh NT, Aveyard J, Fernig DG (2007) Determination of size and concentration of gold nanoparticles from UV-Vis spectra. Anal. Chem. 79(11):4215–4221. https://doi.org/10.1021/ac0702084
- Albuquerque TG, Oliveira MB, Sanches-Silva A, Costa HS (2016) Cholesterol de-termination in foods: comparison between high performance and ultra-high performance liquid chromatography. Food Chem. 193:18–25. https://doi.org/10.1016/j.foodchem.2014.09.109
- Qu F, Yin T, Fa Q, Jiang D, Zhao XE (2021) Lead halide perovskites with aggregation-induced emission feature coupled with gold nanoparticles for fluorescence detection of heparin. Nanotechnology 32(23):235501. https://doi.org/10.1088/1361-6528/abe905
- Zhang NMY, Qi M, Wang Z, Wang Z, Chen M, Li K, Shum P, Wei L (2019) One-step synthesis of cyclodextrin-capped gold nanoparticles for ultra-sensitive and highly-integrated plasmonic biosensors. Sens. Actuators, B 286:429–436. https://doi.org/10.1016/j.snb.2019.01.166
- Hu T, Na W, Yan X, Su X (2017) Sensitive fluorescence detection of ATP based on host-guest recognition between near-infrared beta-cyclodextrin-CuInS2 QDs and aptamer. Talanta 165:194–200. https://doi.org/10.1016/j.talanta.2016.09.064
- Shang L, Qin C, Jin L, Wang L, Dong S (2009) Turn-on fluorescent detection of cyanide based on the inner filter effect of silver nanoparticles. Analyst 134(7):1477–1482. https://doi.org/10.1039/B823471J
- Jares-Eruman EA, Song L, Jovin TM (1997) Photochromism-FRET (phFRET): modulation of fluorescence resonance energy transfer by a photochromic acceptor. Mol. Cryst. Liq. Cryst. Sci. Technol., Sect. A 298(1):151–159. https://doi.org/10.1080/10587259708036155
- Koushik SV, Vogel SS (2008) Energy migration alters the fluorescence lifetime of cerulean: implications for fluorescence lifetime imaging Forster resonance energy transfer measurements. J. Biomed. Opt. 13(3):031204. https://doi.org/10.1117/1.2940367
- Varghese SS, Zhu Y, Davis TJ, Trowell SC (2010) FRET for lab-on-a-chip devices-current trends and future prospects. Lab Chip 10(11):1355–1364. https://doi.org/ 10.1039/B924271F
- Biju V, Itoh T, Baba Y, Ishikawa M (2006) Quenching of photoluminescence in conjugates of quantum dots and single-walled carbon nanotube. J. Phys. Chem. B 110(51):26068–26074. https://doi.org/10.1021/jp0657890
- Qu F, Guo Z, Jiang D, Zhao XE (2021) In situ growth of polydopamine on surface of covalent organic frameworks under the catalysis of acid phosphatase for dopamine detection. Chin. Chem. Lett 32(11):3368–3371. https://doi.org/10.1016/j.cclet.2021.04.010
- Xiang G, Tong C, Lin H (2007) Nitroaniline isomers interaction with bovine serum albumin and toxicological implications. J. Fluoresc. 17(5):512–521. https://doi.org/10.1007/s10895-007-0203-3
- Su Q, Gan L, Zhu Y, Yang X (2021) Dual-emissive fluorescence and phosphorescence detection of cholesterol and glucose based on carbon dots-cyanuric acid complex quenched by MnO2 nanosheets. Sens. Actuators, B 335:129715. https://doi.org/10.1016/j.snb.2021.129715
- Wu D, Deng H, Wang W, Xiao H (2007) Catalytic spectrophotometric determination of iodine in coal by pyrohydrolysis decomposition. Anal. Chim. Acta 601(2):183–188. https://doi.org/10.1016/j.aca.2007.08.041
- Zi Y, Xu D, Li C, Qu F, Zhao XE (2021) Aggregation-enhanced emission of metal nanoclusters triggered by peptide self-assembly and application in chymotrypsin inhibitor screening. Sens. Actuators, B 345:130243. https://doi.org/10.1016/j.snb.2021.130243
- Lin X, Ni Y, Kokot S (2016) Electrochemical cholesterol sensor based on cholesterol oxidase and MoS2-AuNPs modified glassy carbon electrode. Sens. Actuators, B 233:100–106. https://doi.org/10.1016/j.snb.2016.04.019
- Zhao M, Li Y, Ma X, Xia M, Zhang Y (2019) Adsorption of cholesterol oxidase and entrapment of horseradish peroxidase in metal-organic frameworks for the colorimetric biosensing of cholesterol. Talanta 200:293–299. https://doi.org/10.1016/j.talanta.2019.03.060
- He Y, Niu X, Shi L, Zhao H, Li X, Zhang W, Pan J, Zhang X, Yan Y, Lan M (2017) Photometric determination of free cholesterol via cholesterol oxidase and carbon nanotube supported Prussian blue as a peroxidase mimic. Microchim. Acta 184(7):2181–2189. https://doi.org/10.1007/s00604-017-2235-y
- Wang K, Ren H, Li N, Tan X, Dang F (2018) Ratiometric fluorescence sensor based on cholesterol oxidase-functionalized mesoporous silica nanoparticle@ZIF-8 core-shell nanocomposites for detection of cholesterol. Talanta 188:708–713. https://doi.org/10.1016/j.talanta.2018.06.019
- Hassanzadeh J, Khataee A, Eskandari H (2018) Encapsulated cholesterol oxidase in metal-organic framework and biomimetic Ag nanocluster decorated MoS2 nanosheets for sensitive detection of cholesterol. Sens. Actuators, B 259:402–410. https://doi.org/10.1016/j.snb.2017.12.068
- Sun Q, Fang S, Fang Y, Qian Z, Feng H (2017) Fluorometric detection of cholest-erol based on beta-cyclodextrin functionalized carbon quantum dots via competit-ive host-guest recognition. Talanta 167:513–519. https://doi.org/10.1016/j.talanta.2017.02.060
Scheme 1 is available in Supplementary Files section.
No competing interests reported.