Materials
Human lung adenocarcinoma cell line (A549) was puchursed from National Biomedical Experimental Cell Resource (BMCR) (China). Dulbecco's minimal essential medium (DMEM), 100x Penicillin-Streptomycin-Amphotericin B, 0.25% trypsin (w/v) containing 0.52 mM EDTA were purchased from Gibco company (USA). And fetal bovine serum (FBS) was from HyClone company (USA). All the chemicals were of analytical grade. Unless otherwise stated, all solutions were prepared with ultrapure water from Barnstead Nanopure Water System.
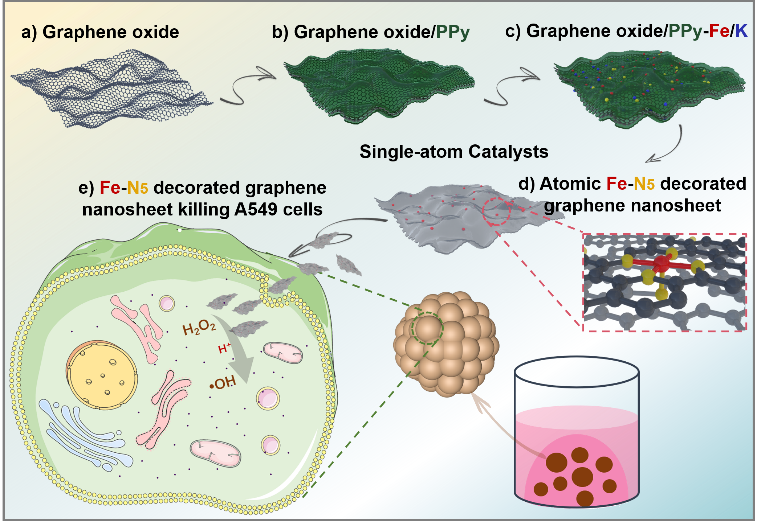
Preparation of Fe-N5 decorated graphene nanosheet (Fe-N5/GN SAC)
Firstly, 50 mg of graphene oxide was dispersed in 60 ml 0.2 M HCl solution and mixed with 0.5 ml pyrrole, followed by 30 min sonication and 3 h vigorous stirring. Subsequently, 1.0 g ammonium peroxydisulfate (APS) was added dropwise to the above mixture under continuous stirring at room temperature. After stirring for 24 h to allow polymerization, the product was separated by vacuum filtration and washed with ethanol and water. The wet hybrid was then dispersed in 100 ml mixture solution of potassium chloride (2.98 g) and potassium ferricyanide (0.658 g), followed by 5 min sonication and 24 h vigorous stirring. This hybrid precursor was collected by vacuum filtration and dried at 60°C for 12 h and pyrolyzed at 900°C under N2 atmosphere for 30 min and NH3 atmosphere for 30 min. The obtained carbon material was soaked in with a 0.5 M H2SO4 solution at 60°C for 4 h to remove KCl and unstable Fe species and then annealed at 900°C under NH3 atmosphere for 30 min to achieve atomically dispersed Fe-N-doped graphene (Fe-N5/GN SAC).
Material characterization
The material was characterized using scanning electron microscopy (SEM, FEI Sirion 200, operated at 30 kV), transmission electron microscopy (TEM, Tecnai G2 T20, 200 kV; Titan G 60-300 S/TEM, 60 kV, FEI, Hillsboro), and X-ray photoelectron spectroscopy (XPS, Escalab 250, Al Kα). The X-ray absorption spectroscopy measurement at Fe K-edge was performed at the Advanced Photon Source (APS) on the bending-magnet beamline 12-BM and 20-BM with electron energy of 7 GeV and average current of 100 mA. The radiation was monochromatized by a Si (111) double-crystal monochromator. Harmomic rejection was accomplished with Harmonic rejection mirror. All spectra were collected in fluorescence mode by vortex four-element silicon drift detector. XAS data reduction and analysis were processed by Athena software.
Evaluation of enzyme-like properties
Enzyme-like properties were evaluated following the previous method [21]. To verify the peroxidase-like feature, 10 μL of 0.8 mM TMB solution and 1 μL of 1 M H2O2 solution were first added to 0.488 mL of 0.2 M NaAc-HAc buffer (pH 3.5), and then 1 μL of 0.05 mg/mL Fe-N5/GN SAC solution was added to the above mixture. To evaluate the catalytic activity units (U) of Fe-N5/SAC, the absorbance at 652 nm was immediately recorded at a 15 s interval within 1200 s. After subtracting the background, the catalyst activity expressed in units (U) was calculated according to the following equation:

where bcatalyst is the catalyst activity (U), V is the volume of reaction solution (μL), ε is the molar absorption coefficient of the TMB substrate (39,000 M-1 cm-1 at 652 nm), l is the optical path length through reaction solution (cm), and ΔA/Δt is the initial rate (within 1 min) of the absorbance change (min-1). When using different amounts of Fe-N5/GN SAC to measure the peroxidase-like activity, the specific activity of catalyst was determined using the following equation:

where acatalyst is the specific activity of catalyst (U mg-1), and m is the catalyst amount (mg).
For the steady-state kinetic measurements of peroxidase-like Fe-N5/GN SAC, 10 μL of various concentraions of TMB solution (from 0 to 3.5 mM) and 1 μL of 1 M H2O2 solution were added to NaAc-HAc buffer (pH 4.0). After 1 μL of 0.05 mg/mL Fe-N5/GN SAC solution was added and mixed together for reaction, the absorbance at 652 nm was immediately recorded at a 10 s interval within 60 s. Then, the initial rates of the chromogenic reaction upon different concentrations TMB were obtained. The substrate concentration-dependent reaction rate curves were fitted with the Michaelis-Menten model. The maximum reaction rate vmax and Michaelis constant Km were calculated according the following Michaelis-Menten equation:

where v is the initial rate of the chromogenic reaction, and [S] is the TMB concentration. The catalytic constant kcat was calculated using the following equation:

where [E] is the catalyst concentration (M).
Density functional theory (DFT) calculations
The spin-polarized Kohn-Sham DFT [22, 23] calculations were performed by using the Quantum ESPRESSO software package [24] with the Projector Augmented-Waves (PAW) type pseudopotentials [25]. The exchange-correlation functional was treated in the Perdew-Burke-Ernzerhof (PBE) type of generalized gradient approximation (GGA) [26]. The electronic wavefunction was expressed as a planewave summation truncated at an energy cutoff of 1,360 eV and the electron density was represented on a grid with an energy cutoff of 5500 eV. A periodic 6×6 graphene with lattice parameters a = b = 14.76 Å and γ = 120° was used as a basis and Fe-N4 site were embedded in the center of the graphene sheet to construct the Fe-N4 model (Figure S2). An Fe-N4 structure in a graphene matrix coupled with pyridinic N was built to model the twin-layer atomic Fe-N5 structure (Figure S2) [27, 28]. The vacuum spacing was set to 20 Å to avoid the interactions between neighboring sheets. The Brillouin zone integration was performed within the Monkhorst-Pack scheme [29] using the k-points set of 2×2×2. The semiempirical Grimme's DFT-D2 [30] was applied in order to determine the influence of Van der Waals force on the adsorption of intermediates on active site. All atoms were allowed to relax until the calculated forces were converged to better than 5 meV/Å. The charge density difference was evaluated using the formula Δρ = ρ(A+B) − ρA − ρB, where ρX is the electron charge density of X.
Preparation and culture of 3D cancer cells model
Human lung adenocarcinoma cells (A549) were cultured in DMEM, 10% FBS, and 100x Penicillin-Streptomycin-Amphotericin B. They grew in carbon dioxide incubatorat with 5% CO2 and 95% atmospheric humidity at 37°C. For establishing 3D cancer cell model, cells were seeded into Magrigel (Corning, USA) with Y27632 (Selleck, USA) on the first day. Change medium every other day. After 7 days, the single cell grew into 3D cancer cell colony. Then the Matrigel was degraded using Dispase II protease at 37°C. And colonys were collected and used 0.25% trypsin (w/v) containing 0.52 mM EDTA to digested into the single cell to conduct the following experiments.
Cell viability assay by Cell Counting Kit-8 (CCK-8)
A549 were seeded into 96-well plate to grow into 3D cancer cell colony. Fe-N5/GN SAC were dilluted into cell medium. Different concentrations of Fe-N5/GN SAC including 1, 5, 10, and 20 μg/mL treated 3D cancer cell colony for 24, 48, and 72 h. Then the medium contained Fe-N5/GN SAC were discarded. 100 μL new medium were added into each well. 10 μL CCK-8 (Beyotime, China) were added into each well to incubate with cells at the same time. After incubation for 1 h, the absorbance at 450 nm of each well in 96-well plate was detetcted using microplate reader.
Cell cytotoxicity assay by LDH Assay Kit
For detect the cell cytotoxicity of Fe-N5/GN SAC, we used LDH assay Kit (Beyotime, China). This kit would detect the activity of lactate dehydrogenase (LDH) released into the cell medium to achieve the determination of cytotoxicity. This parameter could indicate the cell membrane integrity. First, A549 cells were seeded into the 96-well plate for 7 days to grow into the 3D cancer cell colony. Then, used PBS wash cells once and prepared to added Fe-N5/GN SAC and other reagents. The wells were devided into different groups: blank control group(only cell medium), control group (only cell), positive group (maximum enzyme activity), and sample group (20 and 50 μg/mL Fe-N5/GN SAC). All cells were cultured for 24 h. And the cell culture medium in each well were collected and detected by the kit. The cell cytotoxicity could be calculated as this formula:

Cellular ROS level by ROS Assay Kit
Cellular ROS level was mesured using ROS assay Kit (Beyotime, China). DCFH-DA is one type of fluorescence probe and could free access to cell membrane. When it enters into cells, cellular esterase could hydrolyze it to DCFH. And DCFH can’t pass through the cell membrane and loaded into cells. Then cellular ROS could oxidize non-fluorescent DCFH to achieve fluorescent DCF. So we can detect the cellular ROS level. A549 cells were seeded into 12-well plate for 7 days to grow to 3D cancer cell colony. Cells were treated and devided into different groups, including control group (only cells), positive group (200 μM H2O2 treatment for 4 h), and sample group (20 μg/mL Fe-N5/GN SAC treatment for 24 h). In each group, there were three repeat wells. Then, cells were digested with Dispase II and trypsin protease continuously. Finally, single cells were collected and analyzed using flow cytometry.
Cell apoptosis by Annexin V-FITC Apoptosis Detection Kit
Cell apoptosis was measured using Annexin V-FITC Apoptosis Detection Kit (Beyotime, China). In this kit, Annexin V could selectively bind with phosphatidylserine (PS) distributing into the inside the cell. At the initial stage of cell apoptosis, PS could be exposed to bind with Annexin V-FITC. For late apoptotic cells, the integrity of destroycell membrane would be destroyed. Propidium Iodide (PI) is one type of nucleic acid dyes and couldn‘t transfer the whole cell membrane and enter into cell. However, when cell apoptosis occurs, PI enters into cells and dyes cell nucleus. Based on these, we can detect cell aoptosis using this kit. In the assay, we seeded A549 cells in the 12-well plate for 7 days to grow to 3D cancer cell colony. Cells were treated and devided into different groups, including control group (only cells) and sample group (20 and 50 μg/mL Fe-N5/GN SAC treatment for 24 h). Three repeat wells in each group were conducted. Also cell colony were digested into single cells. Then, cells were collected and dyed with the kit to perform the flow cytometry analysis.
Expression levels of apototic-related genes by RT-PCR assay
Cells were seeded into12-well plate for 7 days to grow to 3D cancer cell colony. Then they were treated with 20 μg/mL Fe-N5/GN SAC for 24 h. Cell colony were digested into single cells. And single cells were collected into TRIzol reagent (CWBIO, China) for 10 min on the ice. Then add chloroform and centrifuge at 12,000 rpm for 10 min at 4℃. Collect the uppest layer into a new Rnaes-free tube and add isopropanol for 15 min on the ice. Then centrifuge at 12,000 rpm for 20 min at 4℃ again. Discard the supernate and use 75% ice ethanol to wash the sediment and centrifuge at 12,000 rpm for 10 min at 4℃. Finally, we discard the supernate and collect RNA.
After that, reverse transcription-polymerase chain reaction (RT-PCR) was conducted. First, reverse transcription was performed with the FastQuant RT kit (Tiangen, China). We can achieve the cDNA. Second, cDNA, primers, RealMasterMix (Tiangen, China), and ddH2O were mixed to conducted the RT-PCR using a 7500 Real-Time PCR System (Applied Biosystems, USA). The system was set as 95℃ for 5 min, 40 cycles of 95℃ for 30 s, 65℃ for 30 s, and 72℃ for 30 s [31]. The relative expression of genes was calculated as 2-ΔΔCt.The primers showed in Table S4.