Animals preparation
Adult male C57BL/6J mice weighing 25–28 g were purchased from the Experimental Animal Center of Drum Tower Hospital. All experimental protocols and procedures for this study were approved by the Institutional Animal Care and Use Committee at Drum tower hospital and conformed to the National Institutes of Health (NIH) Guide for the Care and Use of Laboratory Animals. All mice were acclimated in a 12-h light/dark cycle room, and allowed free access to food and water under conditions of controlled humidity and temperature (24 ± 0.5 °C).
Models Of SAH And Experimental Design
Experimental SAH models used in this study were performed as previous study [18]. Briefly, mice were placed in a stereotaxic frame after inhalation anesthesia with isoflurane (2% in oxygen gas, 300 ml/min). After disinfection, nearly 1.0 cm midline scalp incision was made and the skull was exposed. A hole with a diameter of 1.0 mm was drilled through the skull in the midline 4.5 mm anterior to the bregma. Simultaneously, one mouse was euthanized as a donor for arterial blood by exposed left ventricular cardiac puncture. Next, 50 µl arterial blood was injected into the prechiasmatic cistern through the prepared hole, and the needle must kept in this position for at least 2 min to prevent blood backflow or cerebrospinal fluid (CSF) leakage. Sham animals were subjected to the same procedures, but was injected into equal volume of normal saline solution. All animals were allowed to recover for 45 min after SAH, then returned to the cages and maintained at a temperature of 24.0 ± 0.5 °C.
All mice were randomly assigned to the following experiments as described (Supplemental Fig. S1).
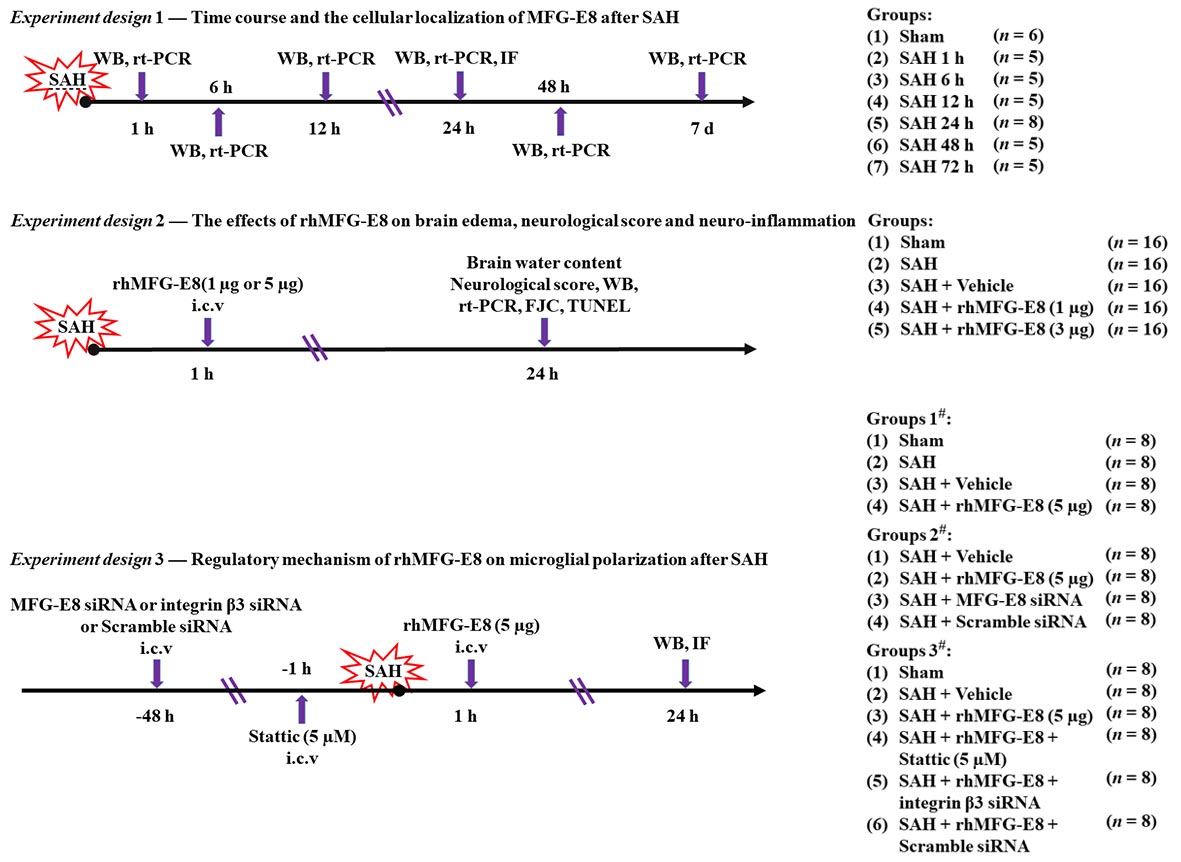
Experiment design 1 — To determine the expression of MFG-E8 in the cortex of mice after SAH. Mice were randomly assigned to seven groups: Sham group (n = 6) and SAH group (1 h, 6 h, 12 h, 24 h, 48 h, 72 h) (n = 5 per group, except SAH 24 h group, n = 8). 5 mice of each group were selected randomly for Western blot analyses and Quantitative Real-Time Polymerase Chain Reaction and the rest mice for double-immunofluorescence staining.
Experiment design 2 — To evaluate the effect of rhMFG-E8 on neuroprotection after SAH. Mice were randomly assigned to five group: Sham group, SAH group, SAH + Vehicle group, SAH + rhMFG-E8 (1 µg and 5 µg) (n = 16 each). Assessment method including brain water content and neurological Score (n = 5), Western blot analyses (n = 5), FJC staining (n = 3) and TUNEL-immunofluorescence staining (n = 3).
Experiment design 3 — To explore the potential mechanism of rhMFG-E8 on microglial polarization after SAH. Mice were randomly assigned into the following group: Sham group, SAH group, SAH + Vehicle group, SAH + rhMFG-E8, SAH + rhMFG-E8 + Stattic (5 µM), SAH + MFG-E8 siRNA, SAH + Scramble siRNA, SAH + rhMFG-E8 + integrin β3 siRNA, SAH + rhMFG-E8 + Scramble siRNA. Assessment method including western blot analyses (n = 5 per group) and double immunofluorescence staining (n = 3 per group).
Intracerebroventricular Administration
Intracerebroventricular (i.c.v) drug administration was performed as previously described [18]. Briefly, mice were placed in a stereotaxic frame after inhalation anesthesia with isoflurane (2% in oxygen gas, 300 ml/min). The needle of a 10-µl Hamilton syringe (Shanghai Gaoge Industry & Trade Co., Ltd., Shanghai, China) was inserted into the left lateral ventricle through a burr hole using the following coordinates: 1.0 mm posterior and 1.5 mm lateral to the bregma, and 3.2 mm below the dural layer. rhMFG-E8 was purchased from R&D Systems, Inc. (McKinley, NE, USA) and injected at 1 h after SAH induction, doses of rhMFG-E8 were determined according to previous study [17, 19]. Stattic (Abcam, USA, 5 µM) was dissolved in sterile saline solution containing 2% dimethyl sulfoxide (DMSO) and injected at 1 h before SAH induction. According to the detection of siRNA effect and previous study [17, 19], MFG-E8 siRNA, integrin β3 siRNA and scramble siRNA (500 pmol/5 µl, Santa Cruz Biotechnology) were injected into the left lateral ventricles at a rate of 0.5 µl/min with a 10-µl Hamilton syringe at 2 d before SAH induction.
Quantitative Real-time Polymerase Chain Reaction
Quantitative real-time polymerase chain reaction (qPCR) was performed and analyzed as previously described [20]. Total RNA from brain tissues was extracted using TRIzol Reagents (Invitrogen Life Technologies, USA). RNA quality was insured by gel visualization and spectrophotometric analysis (OD260/280). After reverse transcription, quantitative analysis of the MFG-E8, Integrin β3, IL-1β, IL-6, TNF-α and IL-10 mRNA expression were performed with the real-time PCR method and the primers were synthesized by ShineGene Biotechnology (Shanghai, China) (Additional file Table 1). Test cDNA results were normalized to β-actin. All samples were analyzed in triplicate.
Table 1
Polymerase chain reaction (PCR) primer sequences.
| Target gene | Forward (5’ to 3’) | Reverse (5’ to 3’) |
| mfg-e8 | CGGGCCAAGACAATGACATC | TCTCTCAGTCTCATTGCACACAAG |
| gapdh | AAGAAGGTGGTGAAGCAGGC | TCCACCACCCTGTTGCTGTA |
| il-1β | AAGCCTCGTGCTGTCGGACC | TGAGGCCCAAGGCCACAGG |
| il-6 | GAGACTTCCATCCAGTTGCCT | TGGGAGTGGTATCCTCTGTGA |
| tnf-α | GTAGCCCACGTCGTAGCAAA | CCCTTCTCCAGCTGGAAGAC |
| il-10 | GGTTGCCAAGCCTTATCG A | ACCTGCTCCACTGCCTTGCT |
| β-actin | CGTGAAAAGATGACCCAGATCA | CACAGCCTGGATGGCTACGTA |
Table 2
Neurological evaluation (Modified Garcia scoring)
| Test | Score |
| 0 | 1 | 2 | 3 |
| Spontaneous Activity (in cage for 5 min) | No movement | Barely moves position | Move but does not approach at least three sides of cage | Move and approaches at least three sides of cage |
| Spontaneous movements of all limbs | No movement | Slight movement of limbs | Moves all limbs but slowly | Move all limbs same as pre-SAH |
| Movements of forelimbs (outstretching while held by tail) | No outreaching | Slight outreaching | Outreach is limited and less than pre-SAH | Outreach same as pre-SAH |
| Climbing wall of wire cage | | Fails to climb | Climbs weakly | Normal climbing |
| Reaction to touch on both side of trunk | | No response | Weak response | Normal response |
| Response to vibrissae touch | | No response | Weak response | Normal response |
Immunofluorescence Staining And TUNEL Staining
Immunofluorescence Staining was performed as previously described [18, 21]. Briefly, mice were deeply euthanized and perfused with 4% paraformaldehyde in 0.1 mM phosphate-buffered saline (PBS, PH7.4). Brain samples were immersed in 30% sucrose until sinking to the bottom. 8 um-thick slices were cut with a cryostat. The slides of each coronal sections were incubated in blocking buffer for 2 h, then washed with PBS three times for 10 min. Next, the slides were incubated with anti-MFG-E8 (1:200), anti-CD86 antibody (1:100), anti-CD206 antibody (1:100), and anti-p-STAT3 (1:200) respectively, in a dark place overnight at 4 °C. Afterwards, the slides were washed three times with PBS and incubated with another antibody, namely anti-NeuN (1:100), anti-GFAP (1:100), anti-Iba-1 (1:50), under similar conditions. The following day, the slides were thoroughly washed with PBST and incubated with the corresponding secondary antibodies for 1 h at the room temperature. For TUNEL staining, the sections were incubated with the TUNEL reagent for 1 h at 37 ℃. Then wash with PBS, the slides were stained with DAPI for 15 min to show the location of nucleus. Coverslips were applied with mounting media. The fluorescently-stained cells were imaged on an Olympus IX71 inverted microscope system and analyzed using the Image-Pro Plus 6.0 software (Media Cybernetics, Silver Spring, MD, USA).
Western Blot Analysis
For Western blot analysis, the total protein concentration of the lysate was determined by the Bradford method using Bradford Protein Assay Kit (Beyotime Biotechnology, Shanghai, China). Equal amounts of proteins were resolved on a 10%-12% sodium dodecyl sulfate-polyacrylamide gel electrophoresis (SDS-PAGE) gel and transferred onto polyvinylidene fluoride (PVDF) membrane (Immobilon-P, Millipore Billerica MA, USA). Then, blocked with 5% non-fat dry milk in TBST (Tris-buffered saline with 0.05% Tween 20) for 2 h at room temperature, and then incubated overnight at 4 °C, separately with the appropriate primary antibodies against the specific proteins, MFG-E8, IL-1β, IL-6, TNF-α, IL-10, Integrin β3 (Santa Cruz Biotechnology, USA, 1:200), CD86, CD206 (Abcam, Cambridge, UK, 1:200), STAT3, p-STAT3 at Try 705, and SOCS3 (Cell Signaling Technology, United states, 1:1000), β-actin (Bioworld Technology, United states, 1:5000), and GAPDH (Cell Signaling Technology, United states, 1:5000) in a blocking buffer. Afterwards, the membrane was washed three times with TBST for 15 min, and then incubated with the secondary antibodies, namely HRP conjugated secondary antibodies (goat; Bioworld Technology, United states, 1:5000) or HRP conjugated secondary antibodies (horse; Cell Signaling Technology, United states, 1:1000) for 2 h at room temperature. Finally, following a 20-min wash with TBST, the protein bands were visualized via enhanced chemiluminescence (ECL) (Millipore, Billerica, MA, USA) and exposure to X-ray film. The Western blot results were analyzed using Un-Scan-It 6.1 software (Silk Scientific Inc., Orem, UT, USA).
Fluoro-jade C (FJC) Staining
FJC staining (Merckmillipore, Germany) was performed according to the operation instructions and to detect degenerating neurons. Briefly, frozen sections were prepared, fixed, and immersed in a basic alcohol solution consisting of 1% sodium hydroxide in 80% ethanol for 5 min, then rinsed for 2 min each in 70% ethanol and distilled water and then incubated in 0.06% potassium permanganate solution for 10 min. Following a 1–2 min water rinse, the slides were transferred for 10 min to a 0.0001% solution of FJC dissolved in 0.1% acetic acid vehicle and then rinsed through three changes of distilled water for 1 min per change. The slides were air-dried, cover slips were applied, and the sections were visualized on an Image J software (Image J 1.4, NIH, USA). Two observer blinded to the experimental group counted the FJC-positive cells in six sections per brain (at 20 × magnification) through the injury’s epicenter. The data were presented by the average number of FJC-positive neurons in the fields.
Brain Water Content
Brain water content was measured as previously study [22, 23]. Brains were quickly removed at 24 h after SAH. The brainstem was discarded, while the tissue of left hemisphere cortex and right cortex were harvested, and weighted the wet weight of each cortical tissue, then dried for 72 h at 80 °C and the dry weight determined. The percentage of brain water content was calculated as the following formula = [(wet weight − dry weight)/wet weight] × 100%.
Neurologic Evaluation
The neurological deficits were evaluated as previously described modified Garcia scoring (Additional file Table. 2) and beam-walking tests at 24 h after SAH [24–26]. Briefly, modified Garcia scoring (maximum score = 18) included six subtests scored from 0 to 3 or 1 to 3: spontaneous activity, spontaneous movement of four limbs, forelimbs outstretching, climbing ability, body proprioception, and the response to vibrissae stimulation. Beam-waling texts were performed and including seven-point rating scale. All the tests were evaluated by two independent observer who was blind to the treatment conditions. Higher scores represented better neurological function.
Statistical Analysis
The SPSS 17.0 software package was used for the statistical analysis. All data are expressed as the mean ± Standard Deviation (SD). Comparisons between two groups were performed using Student’s t test and multiple comparisons were performed using a one-way ANOVA followed by Tukey’s test. A p value < 0.05 was regarded as statistically significant.