Whole genome resequencing data of the six genotypes
A total of six samples belonging to groups NL and WSH were subjected the whole genome resequencing, and 9.23–12.85 Gb clean data, with ‘Q20 rate’ > 97% and ‘Q30 rate’ > 92%, were generated (Additional file 1). Among the six samples, M652 produced the lowest amount of clean data (9.23 Gb), whereas NL-CK produced the highest amount (12.85 Gb). The GC content of all samples varied from 39.28% to 40.14%, and no significant difference was detected in GC content between and within the two groups (Additional file 1). The mapping rate of NL group genotypes (93.63%–94.43%) was lower than that of WSH group accessions (98.22%–98.43%). Additionally, the 1× and 4 × coverage of NL group samples was also lower than those of WSH group accessions; the 4 × coverage of NL group ranged from 80.41% to 83.54%, whereas that of the WSH group varied from 94.65% to 98.67% (Additional file 1).
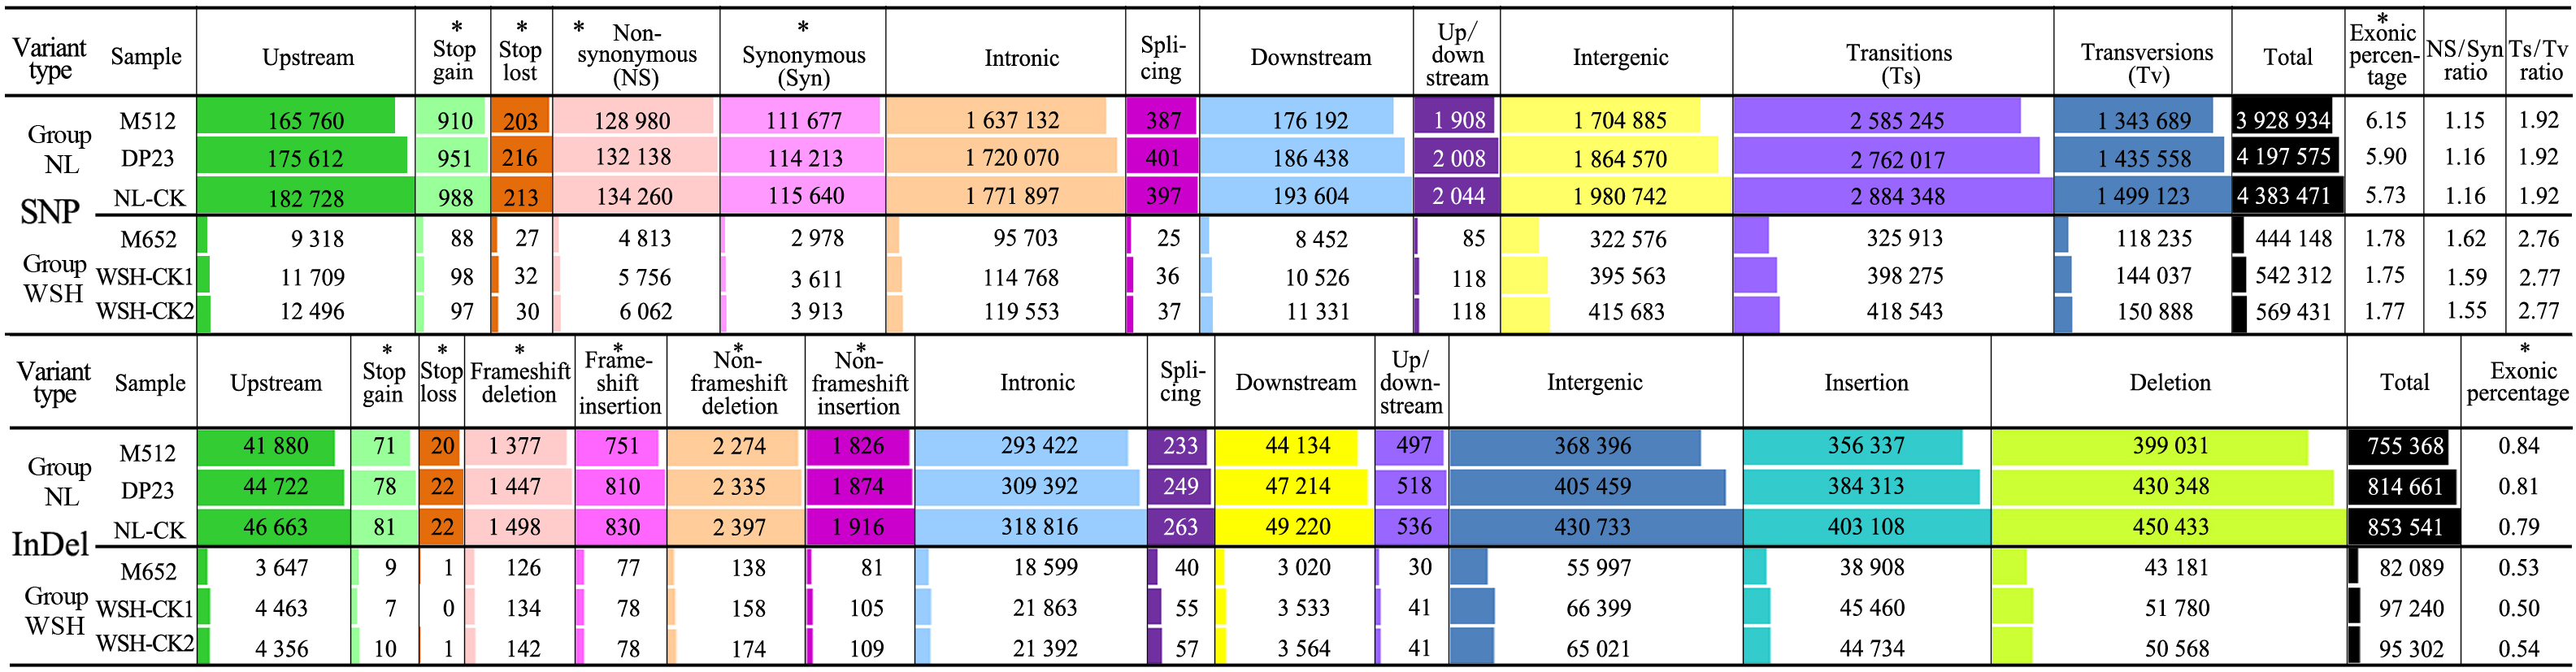
SNPs and Indels in the six genotypes
The sequence reads of all six accessions were mapped onto the reference genome sequence of lotus, and SNPs and Indels were called for each accession. The total number of SNPs identified in each sample of NL group was about 7–10-fold higher than that of WSH group, and it was about 8–10-fold higher in Indel (Additional file 2). Of all the SNPs identified in the NL group, 6.15% (M512), 5.90% (DP23), and 5.73% (NL-CK) were mapped to exonic regions, which were approximately 3.5 times greater than the number of exonic SNPs in the WSH group. Of all the Indels identified in the NL group, 0.84% (M512), 0.81% (DP23), and 0.79% (NL-CK) were mapped to exonic regions, which was approximately 1.5 times those of group WSH (Additional file 2).
Within each group, the controls contained more SNPs and Indels than their mutants (Additional file 2), which was probably associated with the increase in variant sites caused by the pooling of DNA extracted from three seedlings per control. Additionally, the ratio of nonsynonymous to synonymous SNPs (Nonsyn/Syn), transitions to transversions (Ts/Tv), and exonic sequence variation to total variation (exonic/total) varied slightly among the three accessions within each group (Additional file 2), to some extent, suggesting that the three genotypes within each group exhibit very low genetic diversity.
Analysis of SNPs and Indels between mutant accessions and their controls
Within each group, the SNPs and Indels were filtered between any two samples (except between WSH-CK1 and WSH-CK2). A total of 716,656 SNPs and 221,688 Indels were obtained from the NL group, while 639,953 SNPs and 134,6118 Indels were obtained from the WSH group (Fig. 1). Compared with the controls, nucleotide polymorphisms in the mutant samples of the two groups occurred mainly in the intergenic regions: intergenic SNPs accounted for 61.3% and 72.6% of all SNPs identified in NL and WSH groups, respectively, and intergenic Indels accounted for 58.4% and 67.4% of all Indels identified in NL and WSH groups, respectively (Fig. 1). By contrast, the proportion of SNPs and Indels that mapped to exonic regions was very small in both groups (1.9% SNPs and 0.47% Indels in the NL group; 1.7% SNPs and 0.48% Indels in the WSH group) (Fig. 1). This showed that the ratio of exonic SNPs to total SNPs was slightly higher in the NL group than in the WSH group.
Annotation and analysis of genes harboring SNPs and Indels in the exonic regions
The predicted amino acid sequences of the variant genes with exonic SNPs and Indels were blasted in the Gene Ontology (GO) and Kyoto Encyclopedia of Genes and Genomes (KEGG) databases to annotate their functions. In the GO database, 4,890 (72.8%) of the 6,715 variant genes in the NL group were selected for annotation and assigned to three functional categories for a total of 19,785 times (Table 1). The most times of these variant genes were assigned to the biological process category (99,311 times [50.2%]), followed by the cellular component and molecular function categories (Table 1). In the entire genetic background and variant genes, GO terms including ‘ADP binding’, ‘pattern binding’, and ‘polysaccharide binding’ were significantly (Q < 0.05) enriched in the molecular function category and contained 88, 37, and 37 candidate genes, respectively (Fig. 2A). After excluding duplicates, a total of 125 candidate genes were selected from the above three GO items (Additional file 3).
Table 1
Annotation and distribution of variant genes in GO and KEGG databases
|
Database
|
Sample group
|
No. of variant genes
|
No. of annotated genes
|
Percentage of annotated genes
|
Distributed times of annotated genes
|
|
Total times
|
Biological process
|
Cellular component
|
Molecular function
|
|
GO
|
NL
|
6,715
|
4,890
|
72.8
|
197,885
|
99,311
|
72,072
|
26,502
|
|
WSH
|
5,353
|
1,272
|
23.8
|
52,425
|
25,824
|
20,751
|
5,850
|
|
Database
|
Sample group
|
No. of variant genes
|
No. of genes annotated
|
Percentage of annotated genes
|
No. of pathways
|
No. of annotated genes in the top three pathways
|
|
Metabolic pathways
|
Biosynthesis of secondary metabolites
|
Starch and sucrose metabolism
|
|
KEGG
|
NL
|
6,715
|
2,286
|
34.0
|
122
|
430
|
256
|
67
|
|
WSH
|
5,353
|
645
|
12.0
|
68
|
128
|
84
|
39
|
In the WSH group, 1,272 genes were annotated in the GO database, accounting for 23.8% of the 5,353 variant genes, which was significantly lower than the proportion of annotated genes in the NL group (Table 1). These annotated genes of WSH group received a total of 52,425 assignments in the three functional categories (in the same order as that observed in the NL group): 25,824 times (49.3%) in the biological process category, followed by 20,751 times in the cellular component category, and 5,850 times in the molecular function category (Table 1). Seven GO terms, such as ‘ADP binding’, ‘chitin metabolic process’, ‘chitin catabolic process’, showed significant differences (Q < 0.05). Among them, ‘ADP binding’ contained 55 genes, while each of the remaining six GO terms contained 12 identical genes (Fig. 2B). Finally, A total of 62 candidate genes were identified in the seven GO terms, after excluding gene duplicates (Additional file 3).
In the KEGG database, 2,286 variant genes of the NL group were assigned into 122 pathways, of which the top three pathways were ‘metabolic pathways’ (430 genes), ‘biosynthesis of secondary metabolites’ (256 genes), and ‘starch and sucrose metabolism’ (67 genes) (Table 1). By contrast, only 645 genes of the WSH group were annotated and distributed to 68 pathways, and the top three pathways with the most annotated genes and their order were the same as those in the NL group, each with 128, 84, and 39 genes, respectively (Table 1). However, no pathway that showed a significant difference, based on the Q-value (Q < 0.05), was found in the two groups. While four pathways (comprising 104 genes, Additional file 3) with significant P-value (P < 0.05) were detected in the NL group, including ‘ribosome biogenesis’, ‘ABC transporters’, ‘propanoate metabolism’, and ‘phenylpropanoid biosynthesis’. And five pathways (comprising 35 genes, Additional file 3) were detected in the WSH group (P < 0.05), including ‘ABC transporters’, ‘starch and sucrose metabolism’, ‘plant-pathogen interaction’, ‘ether lipid metabolism’, and ‘amino sugar and nucleotide sugar metabolism’.
In summary, 227 (125 from GO database and 104 from KEGG database) and 89 (62+35) enriched genes (based on significant Q- or P- value) were collected from the NL and WSH groups, respectively, after GO and KEGG annotations (Additional file 3), which are an essential reference for locating and screening tepal shape-regulating genes of lotus in the future.
Candidate genes related to the development of tepal shape in lotus
According to the 227 (NL group) and 89 (WSH group) genes enriched in the GO and KEGG databases, those shared by both groups and with mutation rate > 5‰ in the exonic regions were selected. Thus, a total of 41 crucial candidate genes were obtained that potentially regulate the tepal shape in lotus, including eight genes shared by the two groups and 24 and nine genes exclusive to the NL and WSH groups, respectively (Additional file 4). Among the eight shared genes, three (LOC104590721, LOC104605275, and LOC104607443) were enriched in the GO but not the KEGG database, and the remaining five were enriched in both GO and KEGG databases (Additional file 4).
Of the 41 candidate genes, 35 were annotated with a clear function, including 17 disease resistance related genes, six (like-) receptor protein kinases, and 12 related to chitinase, transferase, synthase, and other functions (Additional file 4). The lengths of the 41 genes varied from 891 to 17,163 bp, in which two candidate genes (LOC104607832 and LOC104609114) produced four transcript variants, and 10 genes produced two to three transcript variants (Additional file 4).
In terms of ‘family and domain’, the genes harboring nucleotide-binding adaptor shared by APAF-1, R proteins and CED-4 (NB-ARC) and leucine-rich repeat (LRR) domains were the most (18, 44%) and mainly related to the function of ‘ADP binding’ (Additional file 4). While the domains of the six (like-) receptor protein kinases were epidermal growth factor (EGF)-like, Pkinase, and wall-associated receptor-kinase galacturonan-binding (GUB_WAK), which are associated with the morphological development of plants due to their functions such as ‘ATP binding’, ‘calcium ion binding’, ‘polysaccharide binding’, and ‘protein serine/threonine kinase activity’ (Additional file 4). In the KEGG database, only 18 of the 41 candidate genes were assigned to specific pathways, while the remaining 23 genes were unknown (Additional file 4).