Animal and infection procedures
Thew
present study was achieved using a total of 15 male ICR (CD1) mice weighing 30-35 g. The E. caproni strain and the infection procedures carried out has been previously described [9, 16]. Briefly, encysted metacercariae were removed from kidneys and pericardium of experimentally infected Biomphalaria glabrata snails and used for infection. Mice were randomly allocated into four groups (3 mice in each group). Animals belonging to one of the groups were infected by gastric gavage with 50 metacercariae of E. caproni. Mice of a second group were treated with rIL-25 (R&D Systems®) (concentration: 0.2 mg/ml each) in 150 ml of PBS during each of the four days prior to infection with 50 metacercariae of E. caproni as described above. Animal of another group were simply treated with penicillin under the conditions described above. This group was not exposed to metacercariae of E. caproni. Finally, the remainder 5 mice were used as control and they were not exposed neither to rIL-25 nor E. caproni metacercariae. All mice were necropsied one week after the exposure to metacercariae of the first two groups of mice. The animals were maintained under standard conditions with food and water ad libitum.
Intestinal epithelial cells isolation and protein extraction
Ileal sections from mice in each group were removed at necropsy and IECs were isolated. Briefly, the intestinal sections were opened longitudinally and rinsed by shaking in washing buffer: ice-cold Hank’s balance salt solution (HBSS) containing 2% of heat-inactivated fetal calf serum (FCS). Supernatant was then removed and fresh washing buffer was added to the ileal sections. This procedure was repeated 4 times, until the supernatant was clear. The tissue was cut into small, 1 cm-long, segments and incubated for 20 min at 37 °C in HBSS containing 10% FCS, 1nM EDTA, 1mM DTT, 100 U/ml penicillin and 100 µg/ml streptomycin (dissociation buffer). The supernatant was collected and maintained on ice and the incubation was repeated a second time with fresh dissociation buffer. Supernatants were combined and filtered through a 100 nm cell strainer before IECs were pelleted out by centrifuging at 200 g for 10 min at 4 °C and washed three times in PBS under the same centrifuge conditions to remove any residual medium.
Protein extraction was performed using M-PER Mammalian Protein Extraction Reagent (Thermo Scientific) according to the manufacturer’s instructions. Shortly, extraction reagent was added to the IECs pellet (20:1, v/v), mixed by vortex and incubated at room temperature (RT) for 20 min under continuous gentle agitation. The lysate was then clarified by centrifugation at 18,000 g for 15 min at 4 °C, transferred into a new tube and stored at -80 °C until use.
Preparation of biological replicates and protein labeling
To increase the biological significance avoiding erroneous conclusions related to individual variations, four biological replicates were prepared for each experimental group: infected infected with E. caproni, rIL-25-treated mice exposed to E. caproni metacercariae, rIL-25-treated mice and naïve animals.
Three of this replicas were obtained from different animals and the fourth was obtained by mixing the previous three by applying the same amount of protein from each sample (20 μg/sample). Then, 200 μg of protein from each biological replicate were cleaned and precipitated with 2-D Clean-Up kit (GE Healthcare) to remove salts and other substances that interfere with labeling and electrophoresis. The samples were resuspended in DIGE tagged buffer (7M urea, 2 M tiourea, 4 % CHAPS, 20 mM Tris). The protein concentration after precipitation was determined by the RC DC (BioRad Protein Assay) method, using BSA as standard protein. The concentrations for labeling with fluorochromes should be between 1 and 20 μg / μl, being between 5-10 μg / μl the optimum concentrations for labeling according to the manufacturer's instructions. With the precipitated samples, 100 μg pools needed for the experiment were made for each group, with equimolar amounts of each samples in each group and quantified again. The DIGE experiment was designed to perform 8 gels containing the samples of the four groups to be compared. After checking that the pH of all samples was between 8 and 8.5, the CyDye DIGE Fluor (GE Healthcare®) fluorochromes were labeled according to the protocol recommended by the manufacturer. One microliter of dye (400 pmol) was added to each sample and maintained on ice for 30 min in the dark. The reaction was stopped by adding 1 µl of 10 mM lysine. To minimize any dye-specific labeling artefacts, two biological replicates of each experimental group were labeled with Cy3 and the other two were labeled with Cy5. The internal standard, prepared by mixing the same amount of protein of each sample included in the experiment, was always labeled with Cy2.
The proteomic analysis was performed in the proteomics facility of SCSIE University of Valencia. This proteomics laboratory is a member of Proteored, PRB3 and is supported by grant PT17/0019, of the PE I+D+i 2013-2016, funded by ISCIII and ERDF”
2D differential in gel electrophoresis (2D-DIGE)
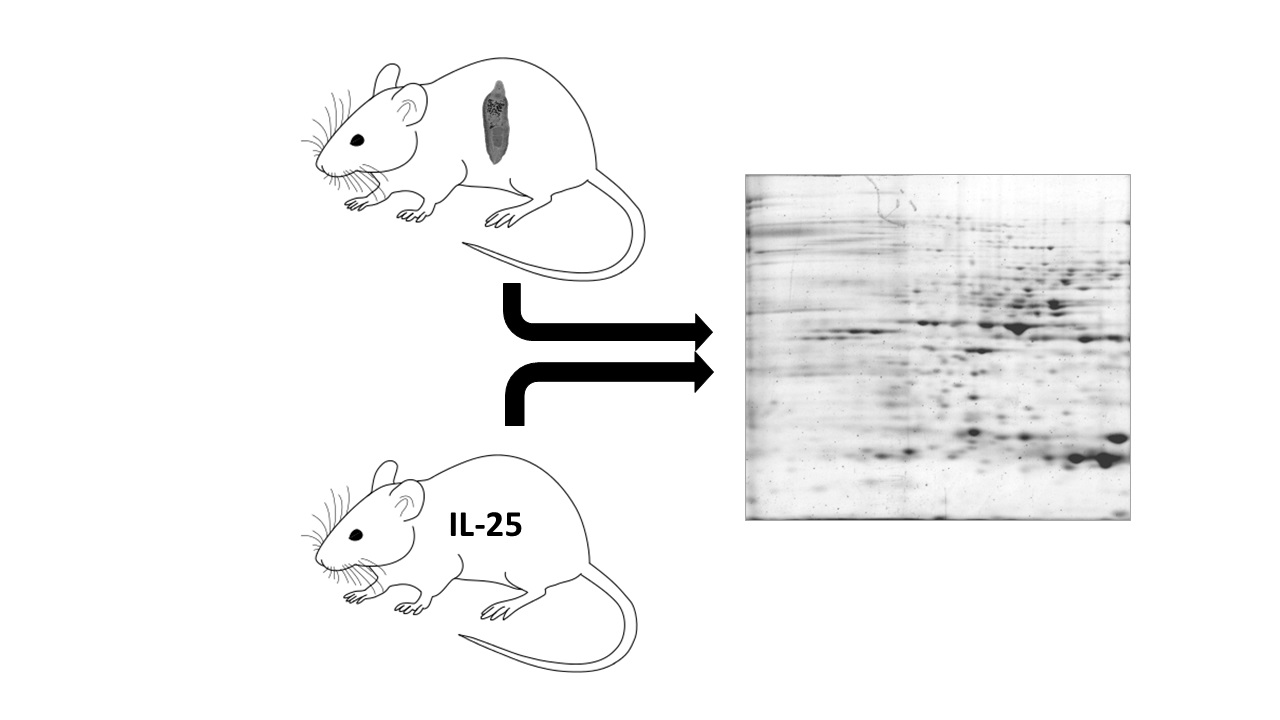
To analyze the effect of IL-25 in the course of E. caproni infection, ileal protein extracts from naïve, infected, rIL-25-treated and rIL-25-treated and exposed to metacercariae mice were compared over 8 2D-DIGE to analize changes in the intestinal production of proteins. The 8 pairs of Cy3- and Cy5-labeled biological replicates (50 µg of protein each) were combined with a 50 µg aliquot of the Cy2-labeled internal standard. The mixtures containing 150 µg of protein were then separated in the first dimension, i.e. isoelectric focusing, and the second dimension. The IPG strips (24 cm, nonlinear pH 3-11) were rehydrated overnight with rehydration buffer (8 M urea, 4% CHAPS, 1% ampholytes and 12 µl/ml of DeStreak™), and the labeled samples were then applied to the strips by anodic cup loading, after the addition of DTT and ampholytes up to a final concentration of 65 mM and 1%, respectively. The isoelectric focusing was carried out at 20 °C in the Ettan IPGphor 3 System (GE Healthcare) as follows: (i) 300 V for 4 h; (ii) gradient to 1,000 V for 6 h; (iii) gradient to 8,000 V for 3 h; and (iv) 8,000 V up to 32,000 Vh. Prior to the second dimension the strips were equilibrated in two steps, 15 min each, in equilibration buffer (50 mM Tris, 6 M urea, 30% glycerol and 2% SDS) containing either 2% DTT or 2.5% iodoacetamide, respectively. The separation of proteins in the second dimension was performed on an Ettan DALTsix system (GE Healthcare) using 12.5% polyacrylamide gels. Electrophoresis was run at 1 W/gel for 1h followed by 5 h, approximately, at 15 W/gel.
Imaging and 2D-DIGE analysis
Gels were scanned in a Typhoon™ 9400 Variable Mode Imager (GE Healthcare) at appropriate wavelengths for each fluorophore: Cy2 (488/520 nm), Cy3 (532/580 nm) and Cy5 (633/670 nm), and at 50 µm resolution. The irrelevant information was removed using ImageQuant Tools software and DeCyder v7.0 software was used for image analysis. The differential in gel analysis module was employed for automatic spot detection and abundance measurements in each individual gel, comparing the normalized volume ratio of each spot from a Cy3- or Cy5-labeled sample to the corresponding Cy2 signal from the internal standard. Data sets were collectively analyzed by means of the biological variation analysis module of the same software, allowing inter-gel matching and calculation of standardized average volume ratios (AVRs) for each protein spot over all the gels that comprised the study. Statistical analysis was evaluated for each alteration in AVR using one-away ANOVA, together with the corresponding post-hoc analysis, and the false discovery rate (FDR) test, which avoids the introduction of false positives when performing multiple comparisons. Statistical significance was considered when p<0.01 and q<0.05 in the ANOVA and FDR analyses, respectively. Moreover, inter-gels matching of statistically different spots was manually confirmed.
Unsupervised principal components analyses (PCAs) and hierarchical clustering analyses (HCAs) (Euclidean) were performed using the DeCyder extended data analysis module, both on all protein spots present at least in 7 of the 8 gels of the experiment (85% presence) and the set of spots that were found to be significantly differentially expressed among the groups compared. These multivariate analyses group the individual biological replicates based on a collective comparison of the expression patterns of the set of proteins chosen, with any a priori knowledge of the biological reasons for clustering [17].
Mass spectrometry and protein identification
Spots showing significant changes in protein abundance among groups were manually excised from the gel and washed twice with double-distilled water. Then, proteins were reduced in 100 mM ammonium bicarbonate containing 10 mM DTT for 30 min at 56 °C, alkylated with iodoacetamide 55mMin 100mM ammonium bicarbonate for 20 min at RT in the dark and, finally, digested in-gel with an excess of sequencing grade trypsin (Promega) overnight at 37 °C, as described before [18]. Protein digestion was stopped with 1% TFA and peptides were dried in a vacuum centrifuge and resuspended in 7 μl of 0.1% TFA, pH 2. One microliter of peptide mixture was spotted onto a MALDI target plate and allowed to air dry at RT before adding 1 μl of matrix, a 5 mg/ml solution of α-cyano-4-hydroxy-transcinnamic acid (CHCA, Sigma-Aldrich®) in 0.1% TFA and 70% ACN, and left to air dry again.
Samples were analyzed in a 5800 MALDI TOF/TOF (AB Sciex) in positive reflectron mode using 3000 laser shots per position. Previously, the plate and the acquisition methods were calibrated with 0.5 μl of CM5 calibration mixture (AB Sciex), in 13 positions. For the MS/MS analysis, 5 of the most intense precursors were selected for each position, according to the following threshold criteria: a minimum signal to-noise of 10; a minimum cluster area of 500; a maximum precursor gap of 200 ppmand amaximum fraction gap of 4.MS/MS data were acquired using the default 1 kV MS/MSmethod. Several spots could not be identified by MALDI TOF/TOF, however, LC-MS/MS was performed. Five microliters of each sample were loaded onto a trap column:NanoLC Column, 3 μ C18-CL, 350 μm × 0.5 mm (Eksigen) and desalted with 0.1% TFA at 3 μl/min for 5min. The peptides were then loaded onto an analytical column: LC Column, 3 μ C18-CL, 75 μm× 12 cm(Nikkyo), equilibrated with 5% ACN, 0.1% formic acid (FA). Elution was carried out with gradient of 5 to 45% B in A for 15 min (A: 0.1% FA; B: ACN, 0.1% FA) at a constant flow rate of 300 nl/min. Peptides were analyzed in a mass spectrometer nanoESI qQTOF (5600 TripleTOF, AB Sciex). The tripleTOF was operated in information-dependent acquisition mode, in which a 0.25-s TOF MS scan from m/z 350–1250 was performed, followed by 0.05-s product ion scans from m/z 100–1500 on the 50 most intense 2–5 charged ions.
Database search
Database search was carried out by ProteinPilot v5.0. search engine (ABSciex). ProteinPilot default parameters were employed to generate a peak list directly from 5600 TripleTof wiff files and Paragon algorithm of ProteinPilot v5.0 was used to search in Uniprot database (versión 01-2017) with the following parameters: trypsin specificity, cys-alkylation, taxonomy restricted to mice, and the search effort set to through. Identifications were considered positive when there were at least two different matching peptides (≥95% confidence) and ProteinPilot unused score was >1.3, which means that proteins are identified with confidence ≥95%.