Infection of Aag2 cells with DENV-2
Aag2 cells were continuously observed for 4 days after DENV-2 infection. The virus-infected cells exhibited a nonlytic infection with no morphology and no cytopathic effect (CPE) compared with uninfected cells. Cell and supernatant samples were collected at 1, 2, and 4 dpi, and plaque assays were performed to detect the virus titers in these samples. The virus titers in the cell samples obtained at 1, 2 and 4 dpi were 0, 3.20, and 4.83 (×102) PFUs/ml, respectively, and those in the corresponding supernatant samples were 0.24, 6.40, and 62.55 (×102) PFUs/ml. The virus copy numbers in the cell and supernatant samples collected at 1, 2, and 4 dpi were simultaneously detected by a qRT-PCR (Probe) analysis. The results showed that the virus copy numbers in the cell samples collected at 1, 2 and 4 dpi were 3.28, 2.94, and 3.38 (Log10), respectively, and those in the supernatant samples were 4.27, 4.44, and 5.14 (Log10), respectively. In this study, cell samples collected at 4 dpi were selected for transcriptome sequencing.
Transcriptome alteration in Aag2 cells infected with DENV-2 and sample biological repetition
Transcriptome sequencing of cell samples obtained at 4 dpi was performed to analyze and verify the transcriptome changes induced in Aag2 cells by infection with DENV-2. Four biological replicates of each group were included in the analysis, and the results identified 51,096,080, 43,125,874, 42,338,962, and 46,677,830 raw reads in the four repeats from the infection group and 48,724,088, 51,748,932, 50,600,756, and 55,023,262 in the four repeats from the control group. After data filtering, were 50,436,036, 42,663,786, 41,621,178, and 45,731,474 clear reads were obtained from the infected group, and 47,885,880, 50,965,704, 49,833,962, and 54,099,464 were found for the four repeats from the control group. Among these reads, 8,866 unigenes were found in both the infection and control groups, 225 unigenes were only found in the infection group, and 683 unigenes were found only in the control group. A total of 1,689 new annotated genes were predicted. The differences between the infection and control groups and the repeated samples within the groups are shown in an inter-sample correlation heat map (Fig. 1a) and PCA charts (Fig. 1b). The results showed that the differences between the samples were more obvious, and the samples within the groups exhibited better repeatability.
Bioinformatics analysis of differentially expressed genes
A DESeq2 analysis using | Log2 (FC) |> 1 and Padj <0.05 as the screening criteria identified 1,199 DEGs that might be related to DENV-2 infection (Additional file 2: Table S2). Among these DEGs, 1,014 genes were downregulated, and the Log2 (FC) values were between -5.6 and -1. In contrast, 185 genes were upregulated, and the Log2 (FC) values were between 1 and 4.7 (Fig. 2). To further analyze the related functions of DEGs and identify biological pathways that play a key role in biological processes with the aim of revealing and understanding the basic molecular mechanism, we performed enrichment analyses of the 1,199 DEGs.
The GO enrichment results identified 552 terms, and these included 303 biological process (BP) terms, 65 cellular component (CC) terms, and 184 molecular function (MF) terms. Among the BP terms, the DEGs were most significantly enriched in metabolic processes such as those involving pyrimidine nucleotides, pyrimidine-containing compounds, and ribonucleosides, and catabolic processes such as those involving cellular nitrogen compounds, heterocycles, and aromatic compounds. In addition, the identified DEGs are also involved in cell development and differentiation, biosynthesis, and signaling pathways, among other processes. The analysis of the CC terms revealed that the DEGs were most significantly enriched in cellular structures such as the extracellular space, extracellular region part, and plasma membrane, and participate in the formation of synapses, the transmembrane transporter complex, various organelles, and the cytoskeleton. Among the MF terms, DEGs were most significantly enriched in the processes related to DNA-binding transcription factor activity, transcriptional regulator activity, symporter activity, transmembrane transporter activity, and transferase activity, among others. In addition, the DEGs were found to participate in the regulation of the binding of various substances, such as iron ions, cofactors, and NADP, and of the activities of enzymes such as oxidoreductases, peptidases, hydrolases, and synthases. Separate enrichment analyses of the upregulated and downregulated DEGs were then performed. The upregulated genes were mainly enriched in the metabolic processes of cofactors, nucleobase-containing small molecules, and pyrimidine nucleotides, and in the biosynthesis processes of heterocyclic, organic cyclic compounds, and small molecules (Fig. 3a and Additional file 3: Table S3). In contrast, the downregulated genes were mainly enriched in the formation of the extracellular space and extracellular region part and regulate the processes related to symporter activity, transmembrane transporter activity, serine-type enzyme activity and other various enzyme activities as well as cell development and differentiation (Fig. 3b and Additional file 4: Table S4).
The KEGG enrichment results showed that the DEGs were enriched in 67 pathways and mainly participated in longevity regulating pathway-multiple species, circadian rhythm-fly, DNA replication, purine metabolism, pyrimidine metabolism, peroxisome, drug metabolism-other enzymes and other pathways. The upregulated DEGs were enriched in 39 pathways, which mainly included DNA replication, pyrimidine metabolism, longevity regulating pathway-multiple species, retinol metabolism, and FoxO signaling pathway (Fig. 3c and Additional file 5: Table S5). In contrast, the downregulated DEGs were enriched in 41 pathways, which mainly included longevity regulating pathway-multiple species, purine metabolism circadian rhythm-fly, ABC transporters, tyrosine metabolism, MAPK signaling pathway-fly and others (Fig. 3d and Additional file 6: Table S6).
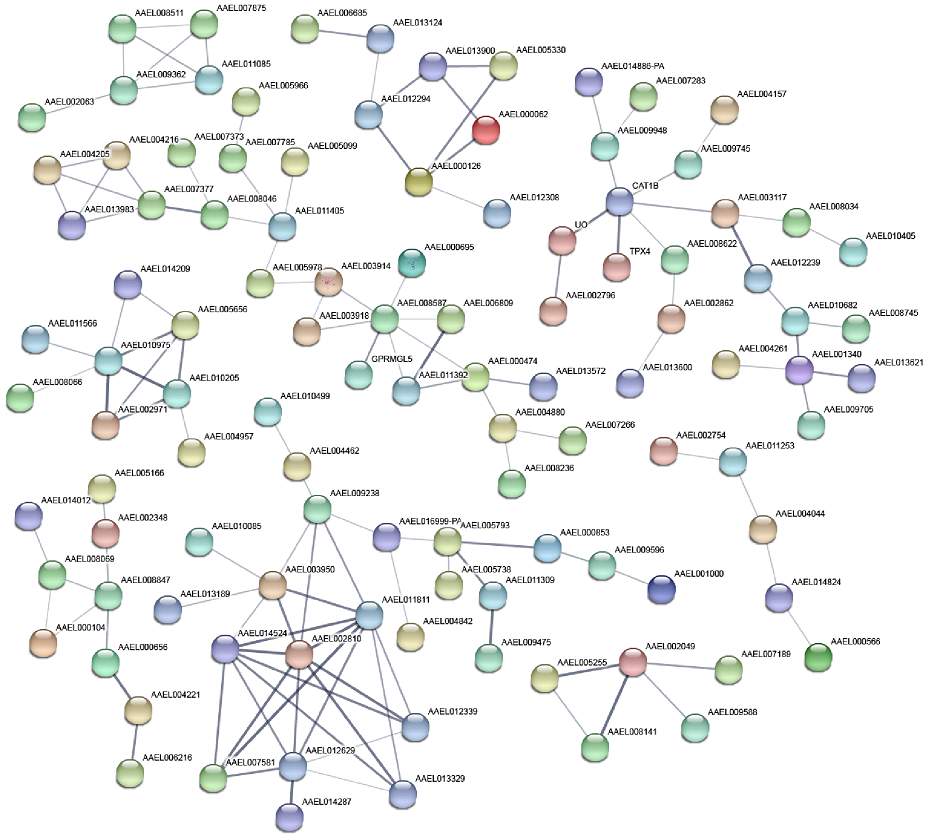
Using the STRING database, PPIs analyses of 550 genes with protein-coding functions among the 1,199 DEGs, and 108 genes with more than two connecting lines were identified (Fig. 4). In addition, 132 edges (representative of PPIs) were obtained, and the PPI enrichment p-value was less than 1.0e-16. Nine groups of interacting proteins were obtained from the DEGs with protein-coding functions.
qRT-PCR validation of sequencing data
To verify the transcriptome sequencing data, we selected 12 genes with significant differential expression and used cell samples collected at 4 dpi for qRT-PCR verification. The relative expression levels of the 12 genes obtained by qRT-PCR showed FC in the range of 1.05 to 1.43. Specifically, among these 12 genes, the T-box transcription factor TBX6 (TBX6, LOC5564263, AAEL004174), proteasome maturation protein (LOC5564671), and methylthioribose-1-phosphate isomerase (M1Pi, LOC5578712, AAEL013828) were significantly increased after infection (P < 0.05), with FCs of 1.41, 1.41, and 1.43, respectively (Fig. 5).
Changes in gene expression at 1, 2 and 4 dpi
To observe the changes in the expression levels of the 12 above-described genes in cells, we also performed qRT-PCR experiments at 1 and 2 dpi. The FC range at 1 dpi was 0.77-1.22; among the 12 genes, Toll-like receptor 7 (TOLL7, LOC5575353, AAEL002583) exhibited a significant increase in expression after infection (P < 0.05), with a FC of 1.22, and proteasome maturation protein and protein extramacrochaetae (PEM, LOC5575760, AAEL002721) showed significant decreases in expression after infection (P < 0.05), with FC values of 0.88 and 0.84, respectively. The FC range at 2 dpi ranged from 0.74 to 1.19, and among the 12 genes, methylthioribose-1-phosphate isomerase exhibited a significant increase in expression after infection (P < 0.05), with a FC of 1.16. The FC values for genes at the these different time points were also analyzed by one-way ANOVA, and the results are shown in Table 1. Among the investigated genes, serine pyruvate aminotransferase (LOC5578354, AAEL003508), proteasome maturation protein, methylthioribose-1-phosphate isomerase, protein lethal (2) essential for life (LOC5573688, AAEL013344) exhibited significant differentially expression at the different time points after infection (P < 0.05), and all of these were downregulated at the early stage of infection and upregulated at the later stage.
A PPI analysis of four coding genes (PEM, M1Pi, TOLL7, and TBX6) that were found to be significantly differentially expressed in the qRT-PCR analysis was then performed using the STRING database, and a total of 41 related genes were identified (Fig. 6). The GO enrichment analysis of these genes in terms showed that they are mainly enriched in several BP (L-methionine salvage from methylthioadenosine, methionine metabolic process, sulfur amino acid biosynthetic process, sulfur amino acid metabolic process, and drug metabolic process), CC (cytoplasm and nucleus) and MF (catalytic activity and metal ion binding) terms. The KEGG enrichment results indicated that the related genes are mainly involved in ubiquitin-mediated proteolysis, the Toll and Imd signaling pathways, cysteine and methionine metabolism, apoptosis-multiple species, beta-alanine metabolism, arginine and proline metabolism, glutathione metabolism, and metabolic pathways.