Materials
All chemical reagents were bought from commercial suppliers and used without further purification. Cetyltrimethylammonium bromide (CTAB), chloroauric acid (HAuCl4), sodium borohydride (NaBH4), silver nitrate (AgNO3), L-ascorbic acid, methyl 2-sulfanylacetate, ethylenediamine and methyl acrylate were obtained from Aladdin (Shanghai, China). N-hydroxysuccinimide (NHS), 1-(3-dimethylaminopropyl)-3-ethylcarbodiimide (EDC). GX1 peptide was bought from Chu Peptide Biotechnology Co., Ltd (Shanghai, China). FAM172A were from Ruibo Biological Technology Co., Ltd (Guangzhou, China).
Synthesis of PAMAM-G3
PAMAM dendrimers were synthesized using the divergence method. (24) Briefly, an appropriate amount of methanol was added to a three-necked flask with a magnetic stirrer, a reflux condenser, and a thermometer. Ethylenediamine was dissolved in anhydrous methanol and added dropwise to an excessive amount of methyl acrylate in methanol solution while continuously stirring for 48 hours, and then the solvent and monomer were distilled off under reduced pressure to obtain PAMAM-G0.5 dendrimer. The PAMAM-G0.5 dendrimer was dissolved in anhydrous methanol, and then added dropwise to an excess of ethylenediamine in methanol solution with a drop rate of 1 drop/second while continuously stirring for 48 hours. The methanol and excess ethylenediamine were distilled off under reduced pressure to obtain a PAMAM-G1.0 dendrimer. PAMAM-G3.0 was obtained by repeating the above reactions twice.
Synthesis of Au NR
GNRs with long-wavelength LSPR peaks at 800 nm were synthesized in an aqueous solution using the seed-mediated template-assisted protocol.(25) Briefly, 0.6 mL of 10 mM ice-cold NaBH4 was injected into a 10 mL aqueous solution containing 0.1 M CTAB and 0.25 mM HAuCl4, under vigorous stirring. 0.2 mL of 25 M HAuCl4 was added to 10 mL of 0.1 M CTAB to prepare the GNR growth solution. Then, 40 μL of 16 mM AgNO3 and 90 μL 80 mM ascorbic acid were respectively added to the solution. After shaking, the growth liquid became colorless, and 12 μL of the previously prepared gold seed solution was injected therein. The solution was allowed to stand at 37°C for 12 hours to promote GNRs growth. The synthesized GNRs were purified by centrifugation twice at 8000 rpm for 10 min, and then re-dispersed in deionized water.
Synthesis of Au NR@PAMAM
According to reports in the literature, a partially thiolated G3 (G3-SH) was synthesized.(26) After that, under ultrasonic treatment, the aqueous solution of G3-SH (20 mg in 1 mL of water) and Au NSs (10 mL) were mixed for 15 minutes, and then stirred at room temperature for another 24 h. The purified Au NR@PAMAM were obtained by centrifugation three at 8000 rpm for 10 min and dispersed in DI water.
Synthesis of Au NR@PAMAM-GX1
1.6 molar equivalents of EDC and NHS were added to 1 mL of GX1 (20 mg / mL, DMSO) solution and stirred for 4 hours. Then, the above solution was added to the Au NR@PAMAM dispersion and mix under continuous stirring overnight. Finally, The purified Au NR@PAMAM-GX1 were obtained by centrifugation three at 8000 rpm for 10 min and resuspended in DI water.
Characterization
The chemical structures of PAMAM and PAMAM-SH was confirmed by 1H NMR spectroscopy (300 MHz, Varian, USA) with deuterium oxide (D2O) as the solvent. The morphology of Au NR@CTAB was observed using transmission electron microscopy (JEOL TEM-1210) at 120 kV. Zeta potential and particle size were measured with a Nano-ZS instrument (Malvern Instru-ments Limited, England). UV-Vis spectra of PAMAM-SH, Au NR@CTBA, and Au NR@PAMAM were examined on a UV-2450/2250 (Shimadzu) spectrophotometer with the wavelength ranging from 200 nm to 900 nm. The Fourier transform infrared (FTIR) spectra of all samples were recorded in a Nexus 670 FT-IR spectrophotometer (Nicolet) in transmission mode with a KBr plate. The components of Au NR@PAMAM and AuNR@PAMAM-GX1 were determined using thermogravimetric analysis (Shimadzu TGA-50).
Preparation of Au NR@PAMAM-GX1/pDNA complex
To obtain Au NR@PAMAM-GX1/pDNA complexes, Appropriate amount of pDNA was added to the Au NR@PAMAM-GX1 solutions. Then, the mixture was incubated at room temperature for 30 min to form Au NR@PAMAM-GX1/pDNA complexes.
Agarose gel retardation assay
The pDNA condensing ability of Au NR@PAMAM-GX1 was examined by agarose gel retardation electrophoresis assay. In short, the AuNR@PAMAM-GX1/pDNA complexes with different N/P ratios were separated by 1% agarose gel electrophoresis containing Gold View II (Sigma) at 150 V for 15 minutes. After that, a gel imaging analysis system (Bio-Rad, Bio-Doc-ITM, USA) was used to capture images.
Complex Size and Potential
The hydrodynamic sizes and zeta potentials of Au NR@PAMAM-GX1/pDNA complexes were assessed at room temperature using a Malvern Zetasizer Nano ZS system. Data were recorded through three independent experiments.
Cytotoxicity of Au NR@PAMAM-GX1
Cytotoxicity of Au NR@PAMAM-GX1 was tested on HCT-8 cells and L929 cells. Briefly, HCT-8 cells were seeded in 96-well plates at 1×10⁴ cells in each well and incubated in a 37 °C humidified incubator (5% CO2) for 12 h. Then, the cells were treated with fresh cell medium containing Au NR@PAMAM-GX1 with concentrations ranging from 10 to 100 μg/mL and incubated for 24 h. After that, cells were washed with PBS and added with fresh cell medium containing 10% CCK-8 to all wells. The cell viability was determined with a microplate reader (MultiskanMk3, USA) HCT-8 cells treated with RPMI 1640 medium were used as control. Cytotoxicity of AuNR@PAMAM-GX1 was tested on L929 cells by the same method.
Cellular uptake of Au NR@PAMAM-GX1 complex
The cellular uptake of Au NR@PAMAM-GX1 by HCT-8 cells was quantified using confocal laser scanning microscopy (CLSM) measurements. Before measurement, Au NR@PAMAM-GX1 was labeled by FITC showing green fluorescence. In detail, HCT-8 cells were seeded in a 2 cm confocal microscopy dish at a density of 2×10⁵ cells per well and incubated for 12 h. Then, cells were treated with FITC-labeled Au NR@PAMAM-GX1 and incubated for a different time. After each interval 1 h, 3 h and 6 h), the cells were washed with PBS and stained with 4',6-diamidino-2-phenylindole (DAPI) for 10 min at 37 °C. Finally, the cells were washed again and incubated with 2 mL of PBS for further observation. The Fluorescent pictures were captured by CLSM. Note that nuclei were stained by DAPI displaying blue fluorescence.
GX1 targeting ability assay
Cellular uptake of Au NR@PAMAM-GX1 complex with and without GX1 functionalization was analyzed to confirm the targeting ability of GX1. In detail, HCT-8 cells were seeded in 24-well plate with a density of 5×10⁴ cells/well and incubated in a 37 °C humidified incubator (5% CO2) for 12 h. Then, FITC-labeled Au NR@PAMAM or Au NR@PAMAM-GX1 complex was added to treat the cells and incubated for a different time. After each interval (1 h, 3 h and 6 h), cells in each group were washed by PBS, trypsinized, centrifuged and resuspended in 200 μL PBS in an Eppendorf tube. Finally, samples were measured using flow cytometry and the corresponding fluorescent intensity was quantified by Flow Jo 7.6.1 software.
In vitro gene transfection assay
HCT-8 cells were seeded in a 24-well plate at a density of 5×10⁴ per well and cultured overnight before transfection. Then, cells were replenished with fresh media containing Au NR@PAMAM-GX1/pDNA complexes with different ratios (N/P ratio =15,20,30,40 and 50). After 24h incubation, the cells were tested for green fluorescent protein (GFP) expression with a fluorescence microscope (Zeiss, German). Then, cells were digested by trypsinized and resuspended in 0.5 μL PBS solution. the transfection efficiency was recorded using flow cytometry (BD Accuri C6). In this experiment, the cells were treated with PBS and Au NR@PAMAM-GX1 were set as the negative control, where PEI-25k/pDNA was used as the positive control.
PTT and gene therapy in vitro
We first studied the potential of Au NR@PAMAM-GX1 to ablate cancer cells by photothermal ablation in vitro. Briefly, HCT-8 cells were sown in 96-well plates at a density of 1×10⁴ cells/100 μL DMEM and cultured at 37 °C with 5% carbon dioxide overnight. After incubated with Au NR@PAMAM-GX1 at different Au concentrations for 24 h, these cells were washed 3 times with PBS and treated with 100μL fresh medium, followed by irradiation with near-infrared laser (808 nm, 1 W/cm2) for 5 minutes. Finally, the CCK-8 assay was used to evaluate cell viability.
In addition, we also used the CCK-8 method to explore the in vitro experiments of PTT combined with gene therapy for tumor cells. HCT-8 cells were seeded and cultured as described above, after treated with Au NR@PAMAM-GX1 or Au NR@PAMAM-GX1/FAM172A polyplexes (N/P = 40: 1, 1 μg DNA) for 24 h, the cells were washed 3 times with PBS and incubated with 100 μL FBS-free medium, followed by irradiation with near-infrared laser (808 nm, 1 W/cm2) for 5 minutes. Finally, the CCK-8 method and Zeiss inverted fluorescence microscope were used to observe calmodulin am stained cells to evaluate cell viability.
Apoptosis assay
HCT-8 cells were seeded in a 24-well plate at a density of 5×10⁴ cells/well and incubated overnight. Then the culture medium was renewed by RPMI 1640 medium containing Au NR@PAMAM-GX1 or Au NR@PAMAM-GX1/FAM172A complexes with N/P ratio of 40. After 6h incubation, the cells were irradiated with 808 nm laster (1 W/cm2,5 min). Cells untreated and only treated with laser irradiation or Au NR@PAMAM-GX1 was tested as the control. After further incubation 18 h, cells were digested by trypsinized and resuspended in 200 μL binding buffer. Then, the cells were stained with 5 μL V-PE and 5 μL 7-AAD and incubated for 15 min in the dark at room temperature. Finally, the apoptotic cells were analyzed using flow cytometry.
CT image
X-ray attention property of Au NR@PAMAM-GX1 was performed using a GE LightSpeed VCT imaging system (GE Medical Systems, Milwaukee, WI). Each CT scan was captured at 100 kV, 80 mA and a slice thickness of 0.625 nm. Au NR@PAMAM-GX1 dispersion under series of Au concentration was prepared in 0.2 mL Eppendorf tubes and all tubes were placed in the CT imaging system for scanning. CT images were recorded and Hounsfield units (HU) were measured using the built-in software.
Photothermal property of the AuNR@PAMAM-GX1
The photothermal property and stability of the Au NR@PAMAM-GX1 were examined. The aqueous suspension of Au NR@PAMAM-GX1solution with different Au concentrations (10, 20 and 40 μg/mL) were added into a cuvette, followed by irradiating with an 808 nm NIR laser (Changchun Lei Rui Optoelectronics Technology Co., Ltd.) at a power density of 1.5 W/cm2 for 300 s. The temperature of different samples was recorded using a thermocouple probe every 10 s. The photothermal images were of Au NR@PAMAM-GX1 were captured using an infrared thermal imaging camera (Fotric 226). Next, the Au NR@PAMAM-GX1 with an equivalent concentration of 40 μg/mL were exposed to irradiation with a NIR laser for 300 s, with the laser density set at 0.5, 1, 1.5and 2.0 W/cm2. In addition, we tested the photothermal stability of Au NR@PAMAM-GX1 by illuminating the Au NR@PAMAM-GX1 aqueous solution (40 μg/mL) using an 808 nm laser for 300s (1.5W/cm2), and the suspension was cooled down to room temperature for 300 s. The irradiation and cooling process was carried out four times.
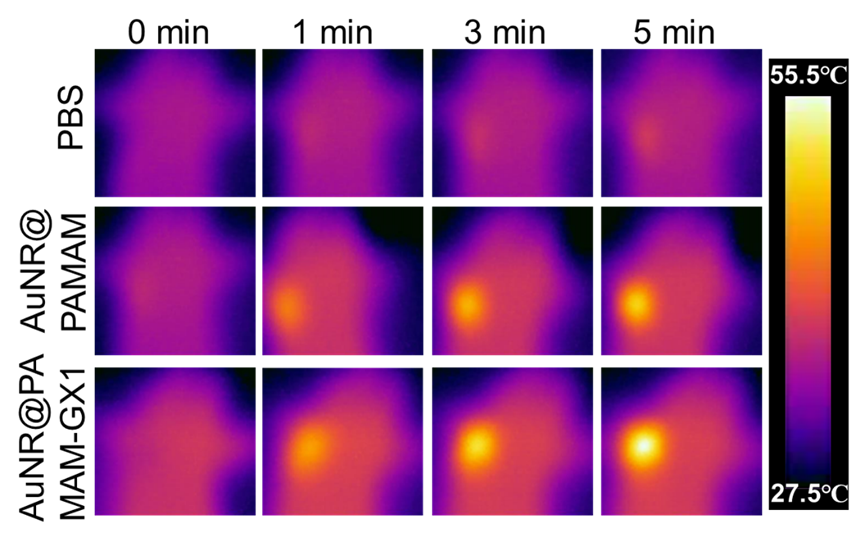
In Vivo Infrared Thermal Imaging Studies
In vivo infrared thermal imaging was captured using an infrared thermal imaging camera. HCT-8 tumor-bearing nude mice were narcotized with trichloroacetaldehyde hydrate (4%, 0.1 mL/10g) first while maintaining normal vital signs.100 μL of Au NR@PAMAM or 100 μL of Au NR@PAMAM-GX1 or 100 μL of PBS was then injected into the tumor-bearing mice through tail intravenous injection. Six hours after injection, the mice were irradiated with laser (808 nm, 1 W/cm2), and the thermal image of the mouse and the temperature distributions of the mouse body were recorded using an infrared thermal imager.
Tumor Inhibition Assay
HCT-8 tumor-bearing nude mice were randomly divided into five groups with 3 mice per group: PBS (injected with PBS), NIR (injected with PBS and irradiated by NIR laser), Au NR@PAMAM-GX1 ([Au] =0.5mg/kg), Au NR@PAMAM-GX1+NIR (injected with Au NR@PAMAM-GX1 and irradiated by NIR laser, [Au] = 0.5mg/kg), injected with Au NR@PAMAM-GX1/FAM172 (injected with injected with Au NR@PAMAM-GX1/FAM172, [Au] = 0.5mg/kg FAM172=10mg/kg), Au NR@PAMAM-GX1/FAM172+NIR, (injected with Au NR@PAMAM-GX1/FAM172 and irradiated by NIR laser, [Au] = 0.5mg/kg, FAM172=10mg/kg). Herein, the NIR means light irradiation by an 808 nm-laser at a power density of 1 W/cm2 for 5 min. After the treatment, the size of the tumors was measured using an electronic caliper every two days. The volumes of the tumors were calculated as 1/2×shortest diameter2×longest diameter. The weight of mice was recorded at the same time. After 14 days of feeding, the tumors were photographed and weighted.
Histologic and Immunohistochemical Analysis
The mice of all groups were killed after the treatment. The tumors were removed, embedded in paraffin, and cryosectioned into 4 µm slices. Then, the sections were stained with H & E. For immunohistochemical analysis, the level of tumor apoptosis was examined using the terminal deoxynucleotidyl transferase deoxyuridine triphosphate nick-end labeling (TUNEL) assay. In addition, the expression of Ki67 in tumor sections was also detected.
Statistical analysis
The data were expressed as the mean standard deviation or standard error. Student’s t-test was used for comparison between groups, and analysis of variance was used for more than two groups. P value <0.05 was considered statistically significant.