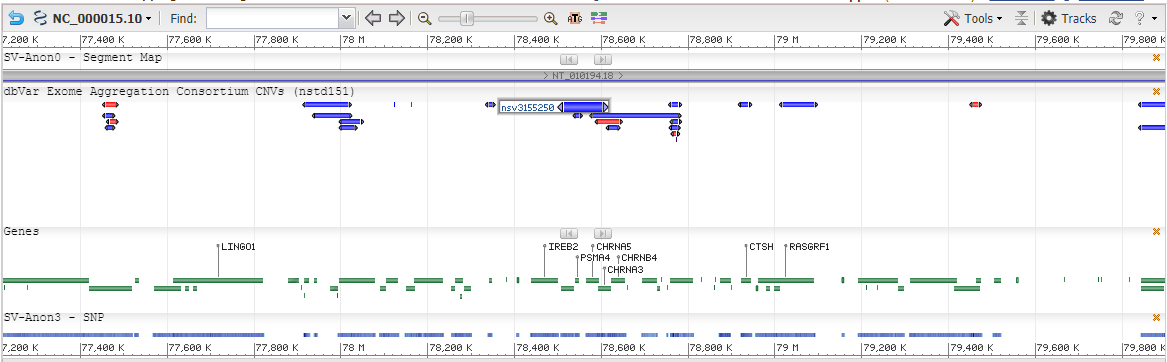
The mutation of IREB2, CHRNA5, CHRNA3, CHRNB4, HYKK and PSMA4 in LAC based on the TCGA database.
In total, 576 patients with a histological confirmed diagnosis of LAC were collected by TCGA in the present study, the main data of which contain the whole exome sequencing, RNA-seq, copy number, gene expression and CNA data. The individual mutation frequencies of Privisional cohort are illustrated in Fig. 1. IREB2 was mutated in 7% of tumors, 41 of the 576 sequenced patients had IREB2 mutations; CHRNA5 was mutated in 5% of tumors, 30 of the 576 sequenced patients had CHRNA5 mutations; CHRNA3 was mutated in 5% of tumors, 30 of the 576 sequenced patients had CHRNA3 mutations; CHRNB4 was mutated in 7% of tumors, 41 of the 576 sequenced patients had CHRNB4 mutations; As well as HYKK in 6% and PSMA4 with a mutation rate of 9%, altered in 35 and 53 of 576 sequenced patients.
Association between the expression of IREB2, CHRNA5, CHRNA3, CHRNB4, HYKK and PSMA4 and clinical pathological features based on the TCGA database.
To understand the role of IREB2, CHRNA5, CHRNA3, CHRNB4, HYKK and PSMA4 in the tumorigenesis and progression in LAC, the study analyzed the association between the expression of IREB2, CHRNA5, CHRNA3, CHRNB4, HYKK and PSMA4 and clinicopathological features. The LAC patients were divided into two groups by the expression of IREB2, CHRNA5, CHRNA3, CHRNB 4, HYKK and PSMA4, based on the median value, namely, low expression group and high expression group. In this reseach, there was a significant association between a high expression of CHRNA5 and PSMA4 and Gender (P = 0.000, P = 0.005), overall survival status (P = 0.050, P = 0.006) and recurrence free survival status (P = 0.019, P = 0.049). High expression of CHRNA5 and Smoking (P = 0.002), as shown in Table 1. However, the expression of CHRNA5 and PSMA4 was not associated with age (P = 0.855), race (P = 0.752), TNM Stage (P = 0.725) or Disease Stage (P = 0.971) in the cohort (P > 0.05).
Table 1
The association between the expression of IREB2, CHRNA5, CHRNA3, CHRNB4, HYKK and PSMA4 and clinical pathological features based on the TCGA database.
| Characteristics | n | IREB 2 | X2 | P | CHRNA5 | X2 | P | CHRNA3 | X2 | P | CHRNB4 | X2 | P | HYKK | X2 | P | PSMA4 | X2 | P |
| Low[288] | High[288] | Low[281] | High[286] | Low[275] | High[282] | Low[279] | High[278] | Low[249] | High[318] | Low[283] | High[284] |
| Gender | | | | | | | | | | | | | | | | | | | | | | | | | |
| Female | 310 | 163 | 147 | 1.788 | 0.`105 | 176 | 112 | 12.322 | 0.000 | 156 | 132 | 0.028 | 0.467 | 157 | 131 | 0.112 | 0.401 | 142 | 113 | 0.642 | 0.237 | 171 | 117 | 7.153 | 0.005 |
| Male | 266 | 125 | 141 | | | 134 | 154 | | | 154 | 134 | | | 153 | 135 | | | 168 | 153 | | | 139 | 149 | | |
| Age | | | | | | | | | | | | | | | | | | | | | | | | | |
| < 40 | 177 | 98 | 79 | 3.622 | 0.164 | 95 | 82 | 1.797 | 0.407 | 93 | 84 | 1.054 | 0.590 | 92 | 85 | 0.439 | 0.803 | 81 | 96 | 2.095 | 0.351 | 84 | 93 | 1.561 | 0.458 |
| 40–60 | 346 | 163 | 183 | | | 167 | 179 | | | 166 | 180 | | | 171 | 175 | | | 144 | 202 | | | 175 | 171 | | |
| > 60 | 34 | 15 | 19 | | | 19 | 15 | | | 16 | 18 | | | 16 | `8 | | | 18 | 16 | | | 20 | 14 | | |
| smoking | | | | | | | | | | | | | | | | | | | | | | | | | |
| Yes | 383 | 191 | 192 | 0.004 | 0.519 | 65 | 177 | 9.265 | 0.002 | 54 | 189 | 0.308 | 0.329 | 48 | 193 | 0.466 | 0.284 | 51 | 161 | 1.846 | 0.106 | 53 | 188 | 0.182 | 0.376 |
| No | 103 | 51 | 52 | | | 38 | 206 | | | 49 | 194 | | | 55 | 190 | | | 52 | 222 | | | 50 | 195 | | |
| T stage | | | | | | | | | | | | | | | | | | | | | | | | | |
| 1 | 189 | 98 | 91 | 0.493 | 0.921 | 106 | 83 | 5.764 | 0.124 | 99 | 90 | 2.994 | 0.393 | 98 | 91 | 3.670 | 0.299 | 85 | 104 | 0.106 | 0.991 | 107 | 82 | 5.310 | 0.150 |
| 2 | 315 | 156 | 159 | | | 148 | 167 | | | 150 | 165 | | | 159 | 156 | | | 138 | 177 | | | 145 | 170 | | |
| 3 | 49 | 25 | 24 | | | 25 | 24 | | | 29 | 20 | | | 23 | 26 | | | 21 | 28 | | | 24 | 25 | | |
| 4 | 20 | 9 | 11 | | | 7 | 13 | | | 9 | 11 | | | 6 | 14 | | | 9 | 11 | | | 10 | 10 | | |
| N stage | | | | | | | | | | | | | | | | | | | | | | | | | |
| 1 | 364 | 177 | 187 | 5.822 | 0.121 | 179 | 185 | 2.004 | 0.572 | 180 | 184 | 1.057 | 0.787 | 192 | 172 | 7.576 | 0.056 | 148 | 215 | 3.495 | 0.321 | 181 | 183 | 2.953 | 0.399 |
| 2 | 108 | 63 | 45 | | | 53 | 55 | | | 59 | 49 | | | 43 | 65 | | | 55 | 53 | | | 49 | 59 | | |
| 3 | 87 | 40 | 47 | | | 44 | 43 | | | 42 | 45 | | | 42 | 43 | | | 39 | 48 | | | 45 | 42 | | |
| 4 | 2 | 2 | 0 | | | 0 | 2 | | | 1 | 1 | | | 0 | 2 | | | 1 | 1 | | | 2 | 0 | | |
| M stage | | | | | | | | | | | | | | | | | | | | | | | | | |
| 0 | 387 | 195 | 192 | 1.501 | 0.155 | 187 | 10 | 0.401 | 0.337 | 193 | 12 | 0.000 | 0,578 | 195 | 9 | 1.501 | 0.155 | 168 | 10 | 0.028 | 0.521 | 187 | 10 | 0.401 | 0.337 |
| 1 | 24 | 9 | 15 | | | 200 | 14 | | | 194 | 12 | | | 192 | 15 | | | 219 | 14 | | | 200 | 14 | | |
| Disease stage | | | | | | | | | | | | | | | | | | | | | | | | | |
| I | 308 | 151 | 157 | 2.956 | 0.398 | 156 | 152 | 0.843 | 0.839 | 152 | 156 | 1.176 | 0.759 | 164 | 144 | 4.668 | 0.198 | 127 | 181 | 3.466 | 0.325 | 157 | 151 | 0.537 | 0.911 |
| II | 134 | 74 | 60 | | | 67 | 67 | | | 71 | 63 | | | 61 | 73 | | | 68 | 66 | | | 64 | 70 | | |
| III | 97 | 47 | 50 | | | 44 | 53 | | | 45 | 52 | | | 48 | 49 | | | 42 | 55 | | | 49 | 48 | | |
| IV | 28 | 11 | 17 | | | 14 | 14 | | | 15 | 13 | | | 10 | 18 | | | 12 | 16 | | | 13 | 15 | | |
| Overall Survival Status | | | | | | | | | | | | | | | | | | | | | | | | | |
| 0 | 355 | 180 | 175 | 0.430 | 0.258 | 188 | 95 | 2.962 | 0.050 | 182 | 99 | 0.800 | 0.210 | 188 | 93 | 3.766 | 0.032 | 158 | 90 | 0.042 | 0.454 | 191 | 89 | 6.624 | 0.006 |
| 1 | 209 | 100 | 109 | | | 167 | 114 | | | 173 | 110 | | | 167 | 116 | | | 199 | 119 | | | 164 | 120 | | |
| Recurrence Free Survival Status | | | | | | | | | | | | | | | | | | | | | | | | | |
| 0 | 312 | 156 | 75 | 1.669 | 0.116 | 169 | 75 | 4.694 | 0.019 | 164 | 82 | 0.940 | 0.191 | 156 | 90 | 0.306 | 0.324 | 151 | 68 | 3.321 | 0.042 | 173 | 82 | 2.490 | 0.049 |
| 1 | 171 | 156 | 96 | | | 143 | 96 | | | 148 | 89 | | | 156 | 81 | | | 161 | 103 | | | 139 | 89 | | |
Evaluation of IREB2, CHRNA5, CHRNA3, CHRNB4, HYKK and PSMA4 gene expression in LAC tissues based on the TCGA database.
We examined the lung expression of IREB2, CHRNA5, CHRNA3, CHRNB4, HYKK and PSMA4 in normal and carcinoma tissues two experiment groups based on the TCGA database. The result showed that CHRNA5, CHRNB4, HYKK, and PSMA4 were highly expressed in lung adenocarcinoma tissues, and IREB2 and CHRNA3 were lowly expressed in the cancer tissues (Fig. 2). In addition, the expression of IREB2, CHRNA5, CHRNA3, CHRNB4, HYKK and PSMA4 were significant different between normal and lung adenocarcinoma tissues (P < 0.001, P < 0.001, P = 0.021, P < 0.001, P < 0.001, P < 0.001) (Table 2).
Table 2
The expression difference of IREB2, CHRNA5, CHRNA3, CHRNB4, HYKK,and PSMA4 genes between normal and lung adenocarcinoma tissues based on the TCGA database.
| | IREB2 | CHRNA5 | CHRNA3 | CHRNB4 | HYKK | PSMA4 |
| Normal | LAD | Normal | LAD | Normal | LAD | Normal | LAD | Normal | LAD | Normal | LAD |
| Mean value | 10.211 | 10.055 | 3.653 | 6.383 | 3.315 | 2.989 | 0.699 | 2.427 | 10.789 | 11.132 | 4.716 | 5.120 |
| 95% confidence interval of the difference | Lower | 0.087 | -3.029 | 0.051 | -1.942 | -0.451 | -0.540 |
| Upper | 0.225 | -2.431 | 0.600 | -1.514 | -0.235 | -0.268 |
| T value | 4.446 | -18.106 | 2.359 | -15.968 | -6.312 | -5.871 |
| P value | 0.000 | 0.000 | 0.021 | 0.000 | 0.000 | 0.000 |
Association between the expression of CHRNA5, PSMA4 and survival based on the TCGA database.
The research used TCGA datasets and Kaplan-Meier Plotter online data respectively for survival analysis. Results showed that the expression level of CHRNA5 and PSMA4 was significantly correlated with the prognosis. There was a significant correlation between CHRNA5 and PSMA4 expression level and prognosis. There were significant differences in OS/RFS between the high and low CHRNA5, PSMA4 expression groups (P < 0.05). The higher the expression, the worse the prognosis. Further utilization Kaplan-Meier Plotter online data analysis was shown in Fig. 3. But there were no difference in OS/RFS between the high and low IREB2 CHRNA3, CHRNB4, HYKK expression groups (shown in supplement Fig. 2). The above results suggest that CHRNA5 and PSMA4 is an adverse prognostic factor and high expression was significantly associated with shorter survival.
The expression of CHRNA5 and PSMA4 in Beas-2b, A549 and H1299 cells.
To further demonstrate the role of CHRNA5 and PSMA4 expression in the development and progression of lung adenocarcinoma, we conducted a cell experiment to compare the expression of CHRNA5 and PSMA4 in normal and cancer cells. The result showed that the expression of CHRNA5 and PSMA4 in A549 and H1299 cells were obviously higher than beas-2b cell(Fig. 4).
The expression of CHRNA5 and PSMA4 in tissue microarray of lung adenocarcinoma
Immunohistochemical staining revealed that the level of CHRNA5 and PSMA4 in the lung tissues of the carcinoma group was considerably higher than those in the normal group, the positive expression products were brown-yellow granules, which were located in nucleus and cytoplasm respectively (as shown in Fig. 5).
The relationship between the expression levels of CHRNA5 and PSMA4 and the clinical characteristic of patients with lung adenocarcinoma.
In order to further explore the effect of CHRNA5 and PSMA4 in the clinical pathology of lung adenocarcinoma, the study analyzed the association between the expression of CHRNA5 and PSMA4 and clinicopathological features. The LAC patients were divided into two groups by the expression of CHRNA5 and PSMA4, based on the median value, namely, low expression group and high expression group. In this reseach, there was a significant association between a high expression of CHRNA5 and T stage (P = 0.026), overall survival status (P = 0.007) and progressive free survival status (P = 0.013). And there was a significant association between a high expression of PSMA4 and overall survival status (P = 0.006) and progressive free survival status (P = 0.007), as shown in Table 3. However, the expression of CHRNA5 and PSMA4 was not associated with age, race, TM Stage or Disease Stage in the cohort (P > 0.05).
Table 3
The association between the expression of CHRNA5 and PSMA4 and clinical pathological features.
| Characteristics | n | CHRNA5 | X2 | P | PSMA4 | X2 | P |
| | Low(53) | High(69) | Low(50) | High(72) |
| Gender | | | | | | | | | |
| Female | 65 | 32 | 33 | 1.897 | 0.116 | 27 | 38 | 0.018 | 0.521 |
| Male | 57 | 21 | 36 | | | 23 | 34 | | |
| Age | | | | | | | | | |
| < 60 | 44 | 21 | 23 | 0.589 | 0.745 | 18 | 26 | 0.848 | 0.654 |
| 60–80 | 75 | 31 | 44 | | | 30 | 45 | | |
| > 80 | 3 | 1 | 2 | | | 2 | 1 | | |
| smoking | | | | | | | | | |
| Yes | 40 | 18 | 22 | 0.030 | 0.510 | 15 | 25 | 0.346 | 0.351 |
| No | 67 | 29 | 38 | | | 29 | 38 | | |
| T stage | | | | | | | | | |
| 1 | 62 | 31 | 31 | 9.293 | 0.026 | 26 | 36 | 0.923 | 0.820 |
| 2 | 40 | 10 | 30 | | | 16 | 24 | | |
| 3 | 11 | 4 | 7 | | | 3 | 8 | | |
| 4 | 2 | 2 | 0 | | | 1 | 1 | | |
| N stage | | | | | | | | | |
| 1 | 81 | 35 | 46 | 2.282 | 0.320 | 32 | 49 | 0.671 | 0.715 |
| 2 | 22 | 7 | 15 | | | 9 | 13 | | |
| 3 | 18 | 10 | 8 | | | 9 | 9 | | |
| 4 | 0 | 0 | 0 | | | 0 | 0 | | |
| M stage | | | | | | | | | |
| 0 | 118 | 52 | 66 | 2.318 | 0.182 | 50 | 68 | 2.166 | 0.198 |
| 1 | 3 | 0 | 3 | | | 0 | 3 | | |
| Disease stage | | | | | | | | | |
| I | 1 | 1 | 0 | 3.817 | 0.421 | 0 | 1 | 1.360 | 0.715 |
| II | 71 | 28 | 43 | | | 27 | 44 | | |
| III | 25 | 9 | 16 | | | 11 | 14 | | |
| IV | 19 | 10 | 9 | | | 9 | 10 | | |
| Overall Survival Status | | | | | | | | | |
| 0 | 90 | 44 | 46 | 6.807 | 0.007 | 40 | 50 | 7.094 | 0.006 |
| 1 | 22 | 4 | 18 | | | 3 | 19 | | |
| Progress Free Survival Status | | | | | | | | | |
| 0 | 78 | 38 | 40 | 5.744 | 0.013 | 34 | 44 | 6.807 | 0.007 |
| 1 | 30 | 7 | 23 | | | 5 | 25 | | |
Correlation between the expression levels of seven PSMAs and overall Survival (OS)/ recurrence-free survival (PFS)
And then we used the Kaplan-Meier for survival analysis of our clinical data. Results showed that the expression level of CHRNA5 and PSMA4 was significantly correlated with the prognosis. There was a significant correlation between CHRNA5 and PSMA4 expression level and prognosis. There were significant differences in OS/RFS between the high and low CHRNA5, PSMA4 expression groups (P < 0.05). The higher the expression, the worse the prognosis (Fig. 6).
The functional enriched analysis of CHRNA5, HYKK and PSMA4
The results of GSEA method suggested that CHRNA5, HYKK and PSMA4 high expression samples were respectively enriched to cell cycle, base excision repair, oxidative phosphorylation, protein export, aminoacyl tRNA biosynthesis, etc (see Fig. 7).