2.1. Preparation of AR extract
Black cohosh powdered roots and rhizomes (0.5 kg) were obtained from medicinal plant store (Haraz) in Cairo, Egypt and were exhaustively extracted by 70% ethanol (2 × 1.5 L). Solvents were evaporated under vacuum, in a rotary evaporator (Büchi, Switzerland), at 45–55 °C (25). The dried ethanol extract of Actaea racemosa was weighed, and the percentage yields calculated. For pharmacological assays, the dried extracts were dissolved in 0.5% Carboxy Methyl Cellulose (CMC), which was found not to interfere with any assay.
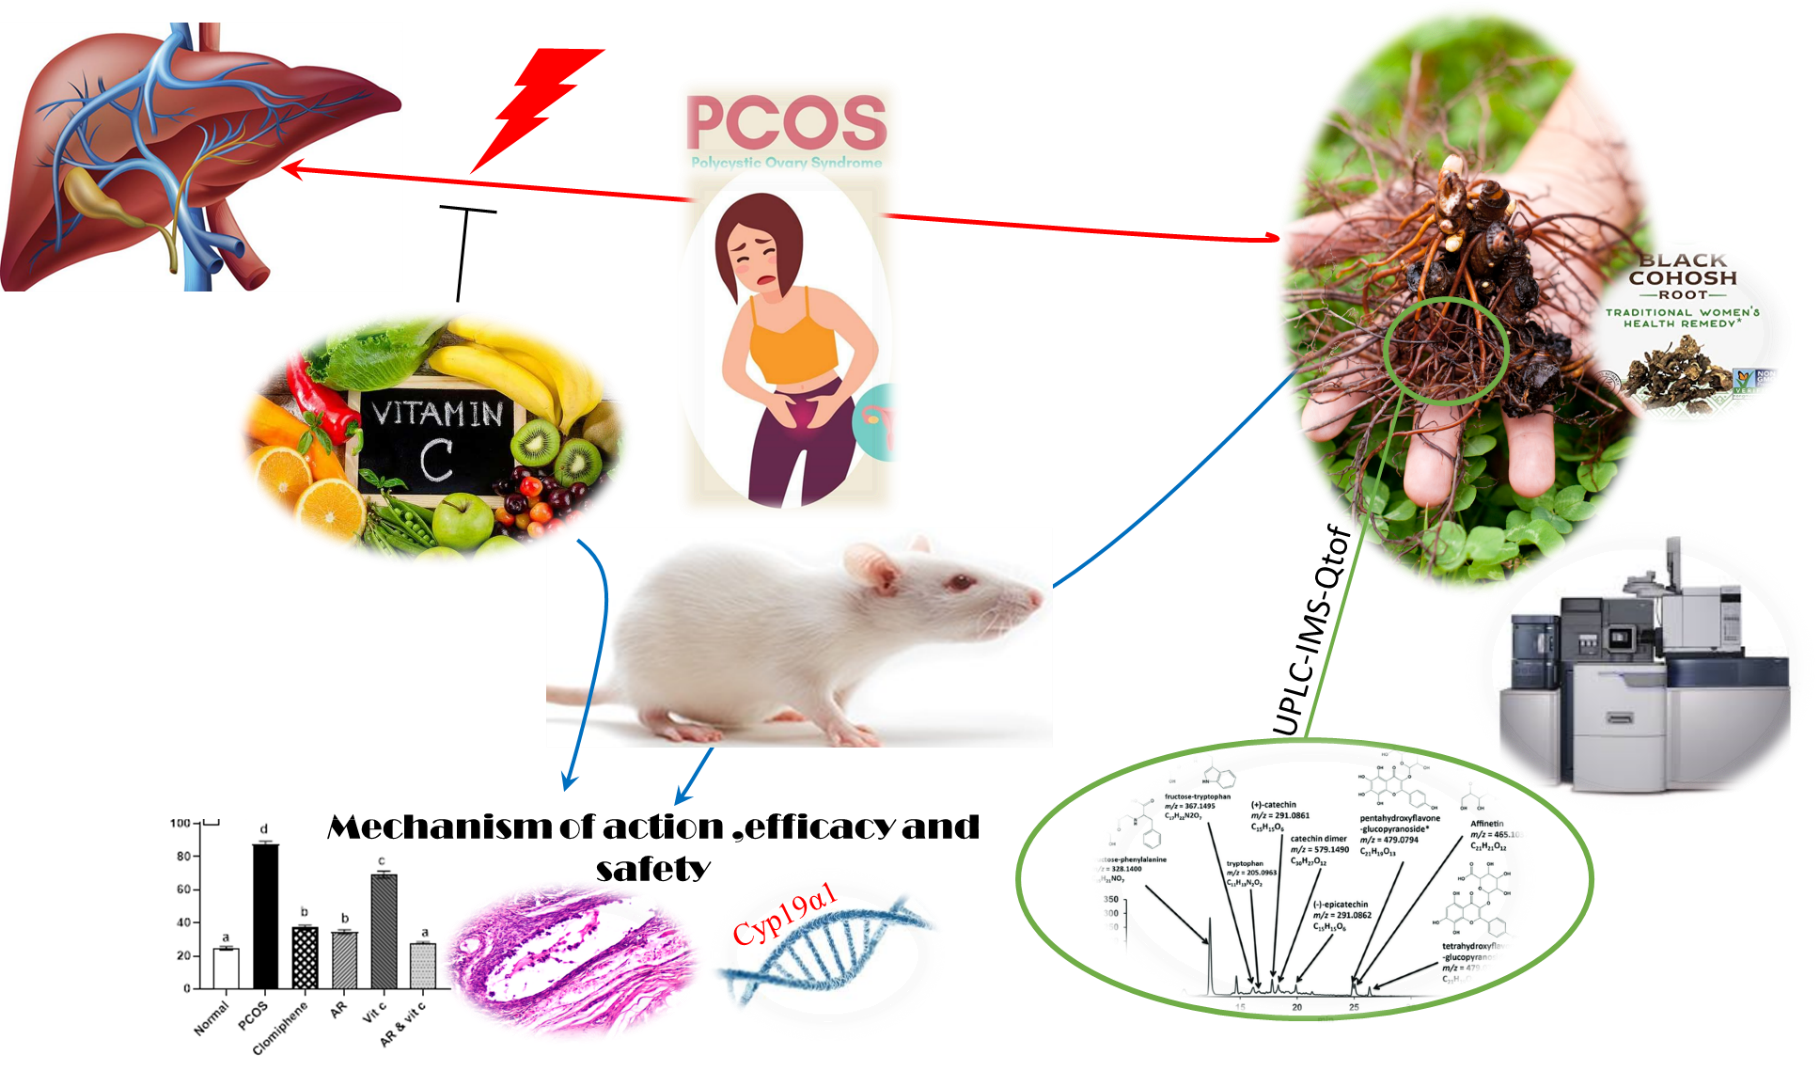
2.2. UPLC-MS fingerprinting of the AR extract
The AR extract was dissolved in acetonitrile and centrifuged at 13,000 g for 15 min at 4 °C. The supernatant was filtered through a 0.2 μm PTFE filter. The metabolomic analysis was performed in Acquity UPLC (Waters, USA) coupled with SYNAPT G2-S (Waters, USA) mass spectrophotometer. The sample injection volume was 5 µL, and the flow rate was set at 400 µL/ min. Chromatographic separation was achieved using ACQUITY UPLC HSS T3 Column (1.8 μm, 2.1 X 150 mm, Waters Corporation, Milford, USA). The column temperature was kept at 45 °C and gradient elution was implemented utilizing water with 0.1 % formic acid (A), and acetonitrile with 0.1% formic acid (B). Initially, 1% of the mobile phase B was used for 2 mins, and linearly inclined as the following gradient: 35-60% B (2-4 min), 60-80% B (4-8 min), and 99% B (8-8.5min) and finally declined to 10% B till reach 11.5 min.
G2-S high definition mass spectrometer (HDMS) (Waters Corp, Manchester, England) equipped with Z-spray source controlled by MassLynx v4.1 was used for mass spectrometry analysis in both positive and negative ESI ionization modes using HDMS mode of operation. The scanning mode parameters were: source temperature; 120 °C, desolvation temperature; 500 °C, cone gas flow; 50 L/h, desolvation gas flow; 1000 L/h, collision energy ramp; 20-50 eV, capillary voltage; 2.5kV, and acquisition mass range; 50-1200 m/z (26). Data acquired in a profile mode and corrected with separate lock mass spray switching between the injected samples and external reference permitting the MassLynx to continuously ensure mass analysis accuracy. Leucine enkephaline (1 ng/μL) was used as an external reference in 1:1 acetonitrile-water containing 0.1% formic acid at flow rate 5 ul/min via a lock-Spray interface, generating a reference ion for positive ion mode [M-H]+ and negative ion mode [M-H]− of 556.2771 and 554.261 m/z, respectively (27).
Three technical replicates were implemented in a randomized batch sequence. To enable proper column equilibration and conditioning, the mobile phase run for 1.5 h, followed by six quality control (QC) samples before each batch analysis. In line with the published guidelines and to overcome the UPLC-MS analytical drifts, QC samples were injected at regular intervals during the experimental sequence (28). Features were considered reproducible if their coefficient of variation (CV) among the samples were < 25%, and the fold change (FC) > 2, ANOVA p-value and Q value < 0.01 against blank samples.
Progenesis QI software (Waters Corp., USA) was used for data processing and putative identification of metabolites of interest by comparison with metabolomic profiling CCS library, LipidBlast and Progenesis Metascape imported databases including HMDB, MONA, and GNPS.
2.3. In vivo experiments
Virgin, cyclic, adult female Wistar Albino rats (160–200 g) were employed for the study. Animals were acquired from Laboratory Animal Colony, Helwan, Egypt and housed in the animal house of faculty of veterinary medicine, Cairo University, and allowed to acclimatize for two weeks. During the study, all animals were caged in standard polypropylene cages and maintained in a controlled environment of (22 ± 3) °C temperature, (55 ± 5) % humidity and a 12 h light/ dark cycle. Rats were provided with standard diet and water ad libitum.
2.4. Experimental protocol
Forty-eight female rats were randomly allocated into six groups of 8 each. Animals of group one served as negative control and received a daily oral dose of (1ml) the vehicle (0.5% CMC) for 49 days. The induction of PCOS was done guided by an established rat model described by (29). Animals of groups 2 to 6 received letrozole (LTZ) (Natco Pharma Limited Hyderabad) at a dose of 1 mg/kg dissolved in 0.5% CMC once daily for 21 days for induction of PCOS. Then, received orally the different samples (vehicle, standard and extracts) for 28 days, Group 2 (positive control) received only the vehicle; Group 3 received Clomiphene Citrate in 0.5% of CMC with a dosage of 1 mg/kg (Fertyl-Super tablets was procured from Ar-Ex Laboratories Private Limited, Goregaon (E), Mumbai) as a standard ovulation induction drug (30). Groups (4-6) were treated for 28 days with AR extract; 7.14 mg/kg (31), vitamin C; 500 mg/kg (32) and AR extract with vitamin C, respectively. From the Day 6 of the treatment, daily vaginal smears of all rats were observed to test ovulation where, indiscriminate estrous cycle with prolonged diestrus phase indicated PCOS (33, 34). On the 50th day of the study, all the rats were anesthetized with ketamine 91 mg/kg, i.p. Duplicate blood samples were collected into sodium heparin tubes for separation of plasma and into gel separator tubes for collection of serum samples. The serum was separated by blood centrifugation at 3000 g at 4º C for 10 min and used for different biochemical assays. The animals were then sacrificed, ovaries and uteruses excised, cleaned of fat and weighed and divided into triplicates; two sets; stored at –80º C to be used for real-time reverse transcriptase-PCR and antioxidant assays. Other sets of the ovaries in addition to liver tissue were fixed in 10% neutral buffered formalin for histopathological examination. After weighing the body and ovaries of each animal at the day of scarification, the relative weight of ovary was calculated as the ratio of the ovary (wet weight, mg) to body weight (g).
2.5. Hormonal profile
The serum total testosterone was measured using a commercial ELISA kit (chemux bioscience Inc, USA) and beta subunit chain of luteinising hormone (LH) level were measured using rat lutropin subunit beta ELISA kit (EIAab, China) following the instructions of the manufacturer.
2.6. Malondialdehyde (MDA) and antioxidants biomarkers determinations
Ovarian and liver tissue were separately homogenized in 10 ml cold buffer (50 mM potassium phosphate, pH 7.5 for MDA and 50 mM potassium phosphate, pH 7.5. 1 mM EDTA for reduced glutathione (GSH)) per gram tissue using glass homogenizer then tissue homogenate was centrifuged at 15000 rpm for 15 min. The supernatant was used to measure reduced glutathione (GSH) and MDA concentrations according to the standard protocols (35, 36).
2.7. Biochemical parameters
Serum glucose level, lipid profile (Cholesterol, triglycerides, and HDL cholesterol) and liver enzymes (ALT and AST) were measured using commercial kits (spectrum, Egypt), where;
VLDL cholesterol concentration = Triglycerides/5
LDL cholesterol concentration = Total cholesterol – (HDL + VLDL)
2.8. Histopathological examination
Ovaries and liver from the different groups were collected and fixed in 10% neutral-buffered formalin and processed to obtain 3-4 µm paraffin-embedded sections. The sections were stained with hematoxylin and eosin (H&E) and the morphometric analysis of the ovaries was performed (37, 38). The number of follicular cysts, average follicular cyst (mean), diameter, the thickness of the follicular wall, the thickness of granulosa cell layer and thickness of theca cell layer were measured.
2.9. Immunohistochemical analysis
The tissue sections deparaffinized, rehydrated and pre-treated with 10 mM citrate buffer for antigenic retrieval. Sections were incubated overnight at 4° C in a humidified chamber with the following primary antibody: rabbit monoclonal anti-Ki 67 antibody (Dako, Denmark) in 1:25 dilution. The tissue sections were incubated with a biotinylated goat anti-rabbit and mouse antibody (Thermo Scientific, USA), Streptavidin peroxidase (Thermo scientific, USA) and 3,3’-diaminobenzidine tetrahydrochloride (DAB, Sigma). The slides were counterstained with Mayer’s hematoxylin then dehydrated and mounted. The primary antibody was replaced by PBS for negative controls. The stained sections were analysed by Leica Qwin 500 Image Analyzer (Leica, Cambridge, England). In each field, the immunolabeled area (dark brown) was recorded. The percentage of positively stained area in the granulosa cell layer, theca cell layers and interstitial stromal cell layer was calculated (39).
2.10. Quantitative real-time PCR for Aromatase (Cyp19α1) gene
Total RNA was extracted from the female rat ovarian tissue samples using RNeasy mini kit (Qiagen, Hilden, Germany). The quantity and purity of total RNA were measured by the NanoDrop Spectrophotometer. The cDNA synthesis was carried out using reverse transcriptase (Invitrogen, California, USA) and oligo-dT following the manufacturer protocol. The cDNA samples were then submitted to qPCR using the following primer pairs for Cyp19α1 gene forward CTGCTGATCATGGGCCTCCT and reverse (5′-CTCCACAGGCTCGGGTTGTT -3′). The cDNA was amplified by 40 cycles of denaturation at 95° C for 45 s, annealing at 59° C for 45 s and extension at 72° C for 45 s. The 95° C step was extended to 4 min along the first cycle. The amplicon size was confirmed by 2% agarose gel electrophoresis stained with SYBR Safe DNA gel stain (Invitrogen). The β-actin gene was furtherly amplified in the same reaction to serve as the reference gene (40). Each measurement was repeated 3 times, and the values were used to calculate the gene/β-actin ratio, with a value of 1.0 used as the control (calibrator) and the normalized expression ratio was calculated (41).
2.11. Statistical analysis
The different analytical measurements in the biological samples were carried out in tripclicate and results are expressed as the mean ± SD. Data for multiple variable comparisons were analysed by one-way analysis of variance (ANOVA) test to analyse the significant differences (P < 0.05) between groups using SPSS version 24 package for Windows.