Bioinformation Analysis
The expression profiles of RND2 in different human cancers were downloaded from the TCGA database, while the profiles in normal human tissues were based on information from the HPA database (https://www.proteinatlas.org). RND2 expression profiles in different glioma subtypes were analysed based on the GlioVis portal (http://gliovis.bioinfo.cnio.es) (16).
Human GBM and control brain tissues
Human control brain tissues and GBM tissues were acquired from the Department of Neurosurgery, Renmin Hospital of Wuhan University. GBM tissues were sampled during surgeries and stored at -80℃. Control brain tissues were collected from patients during emergency surgeries for traumatic brain injury. The procurement and use of tissue in this study was approved by the Renmin Hospital of Wuhan University’s Institutional Ethics Committee of the Faculty of Medicine (approval number: 2012LKSZ (010) H). The histological diagnosis of glioma was confirmed by the pathologists of the Department of Pathology at the Renmin Hospital of Wuhan University. All tumour samples were subjected to pathological examination and related molecular testing (MGMT, 1p19q, and IDH1/IDH2), and all were defined according to the 2016 WHO classification (17). All clinical information for the patients is listed and presented in Supplemental Table S1.
Cell Culture
The human renal epithelial cell line (293T) and human GBM cell lines (U87 and U251) were from the Cell Bank of the Shanghai Institute of Biochemistry and Cell Biology (Shanghai, China). Information detailing the U251 and U87 cell lines, the generation of the U87 stable cell line, and cell culture methods was described in our previous study (18). Cells were cultivated in DMEM along with 1% penicillin/streptomycin and 10% foetal bovine serum, and the incubating temperature was 37℃, with 5% CO2. The STR Authentication is listed in the supplemental materials.
Reagents and Antibodies
Antibodies used in these experiments included the following: anti-RND2 (13844-1-AP, Proteintech, USA), anti-Rho7/Rnd2 (GXT56070, GeneTex, USA), anti-p-p38 (#4511, Cell Signaling Technology, USA), anti-p38 (#9212, Cell Signaling Technology, USA), anti-cleaved-caspase3 (ab32042, Abcam, UK), anti-caspase3 (NB100-56708SS, Novus, USA), anti-BAX (50599-2-Ig, Proteintech, USA), anti-GAPDH (#5174, Cell Signaling Technology), anti-P62 (M162-3, Medical Biological Laboratories, Japan), anti-Beclin1 (11306-1-AP, Proteintech, USA), anti-LC3B (GB11124, Servicebio, China), anti-DYKDDDK/Flag-tag (ANT102, Antgene, China), and anti-His-tag (D291-3, Medical Biological Laboratories, Japan). The autophagy inhibitor wortmannin (3-MA) and the autophagy activator rapamycin (Sirolimus) (S1039, USA) were purchased from Selleck (S2758, USA).
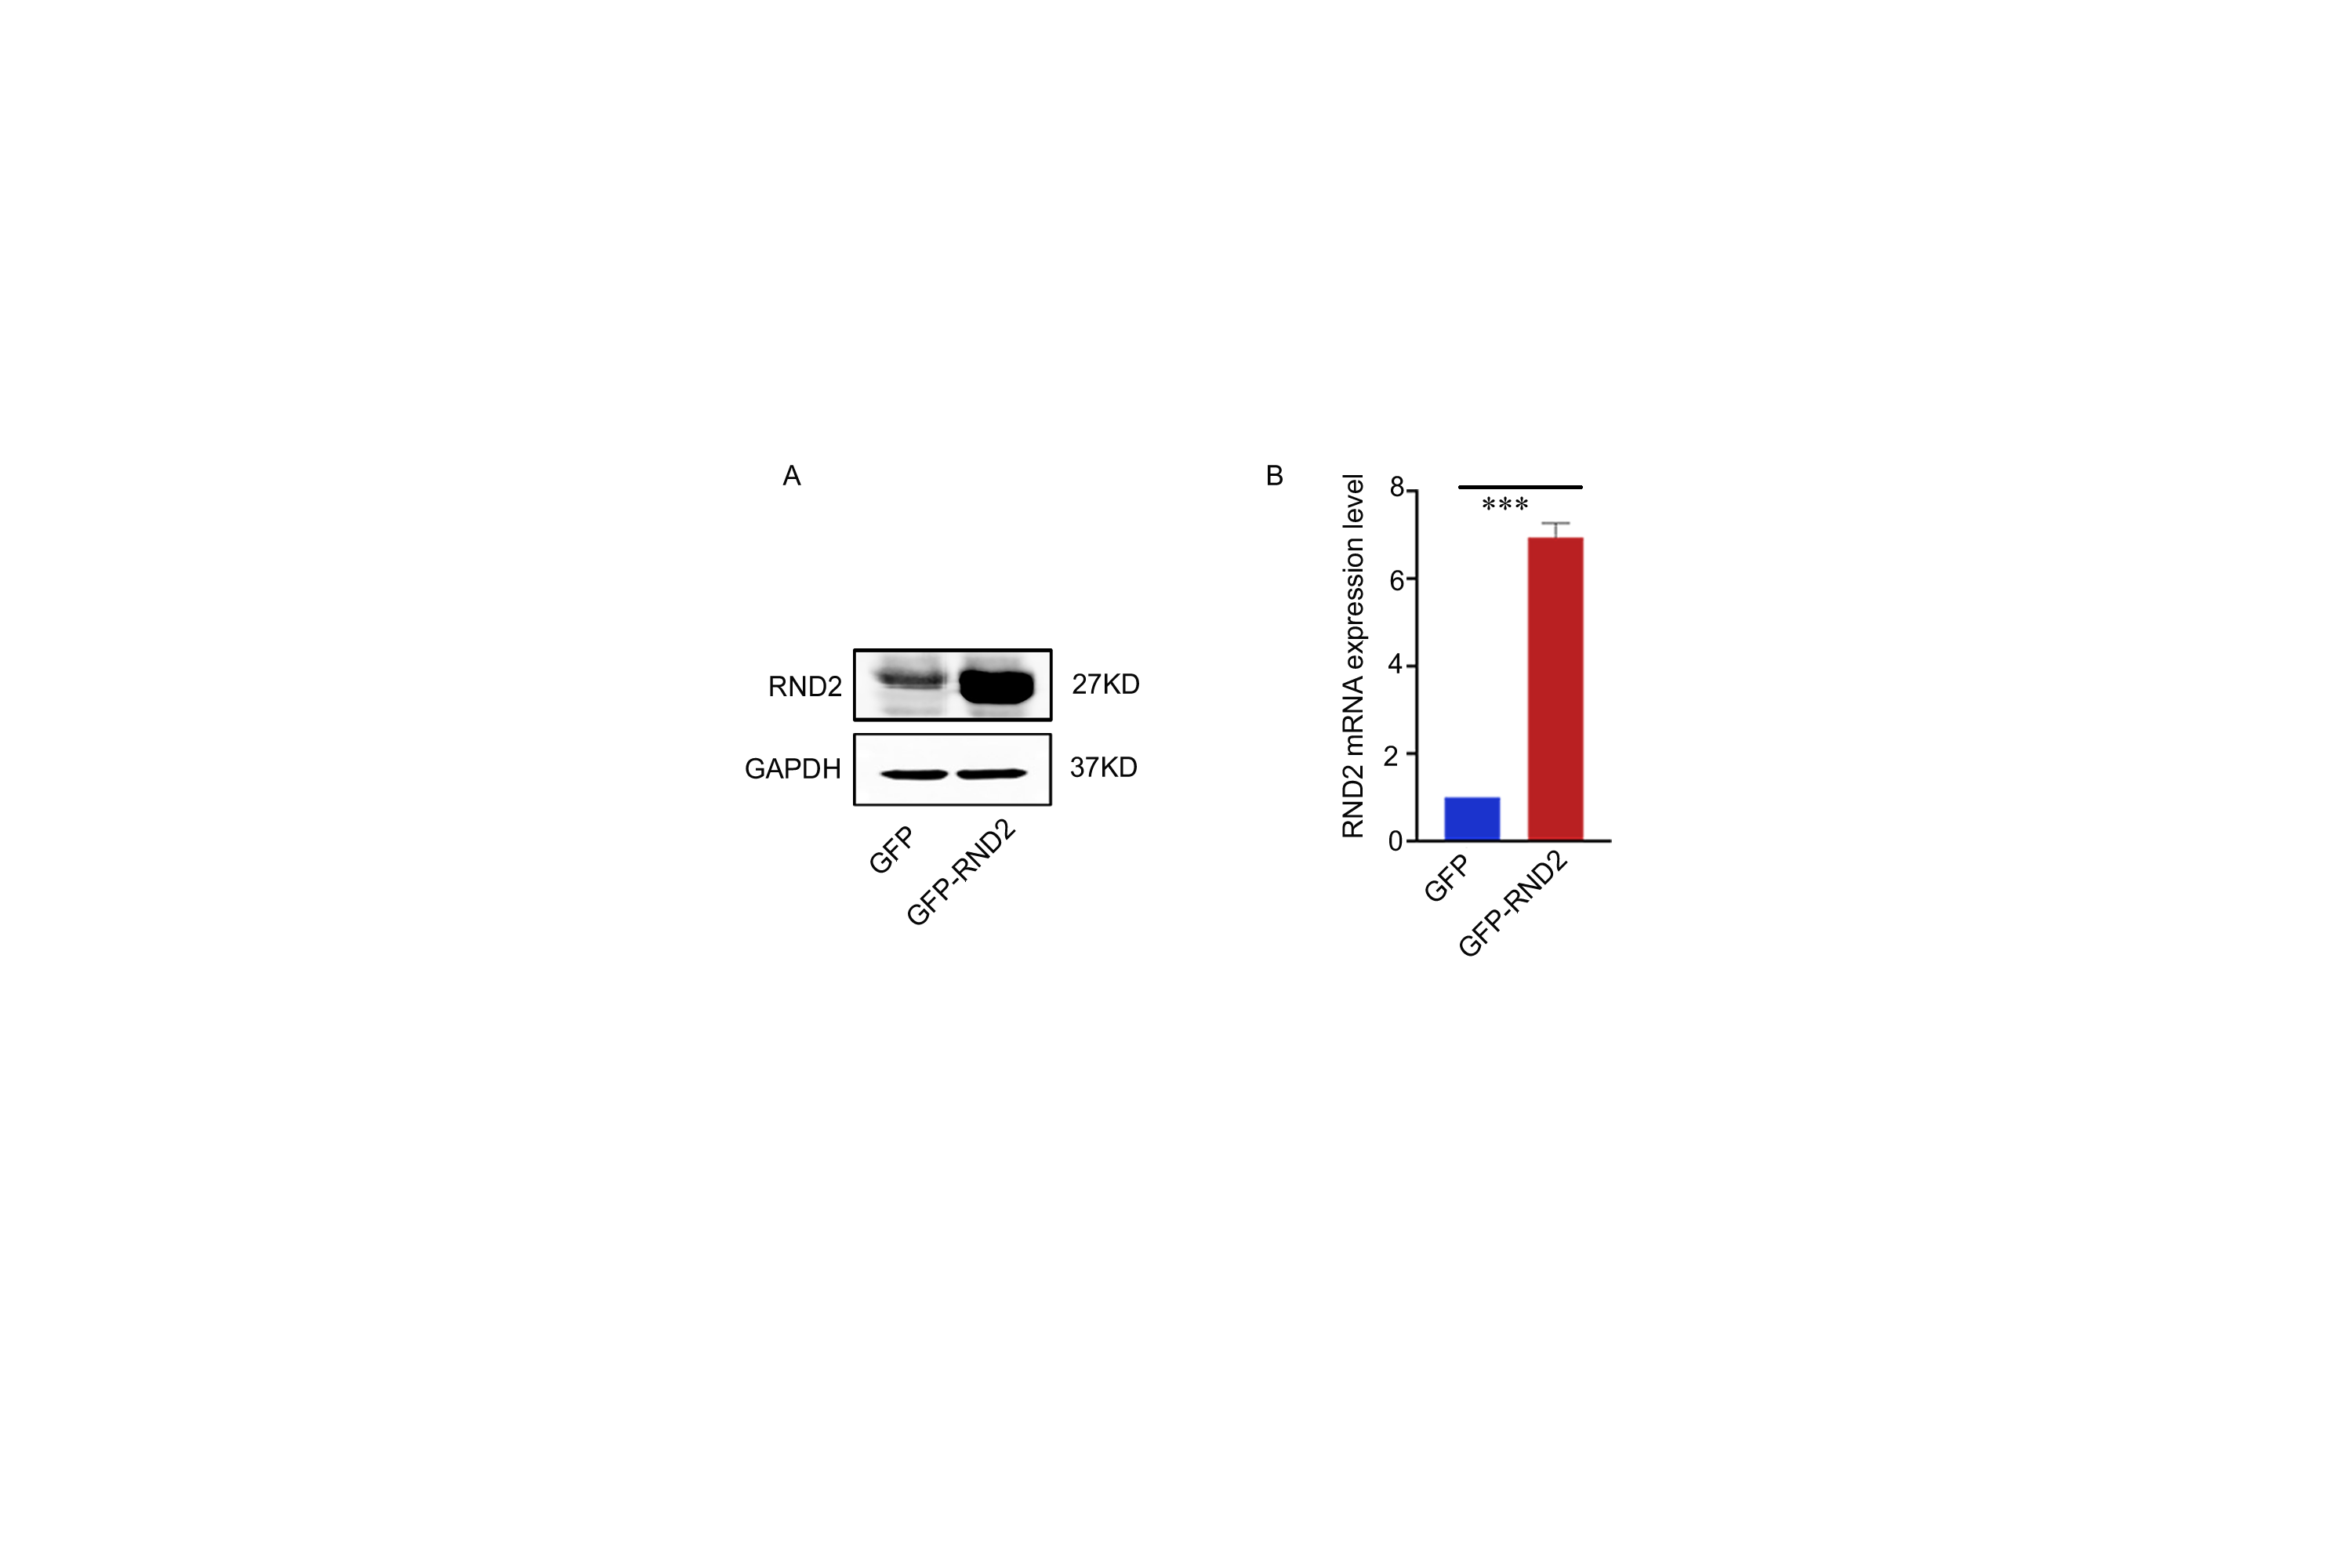
Quantitative Real-Time PCR (qPCR) and RNA Extraction
The extraction of total RNA from tissues and cells was carried out using the Trizol reagent (Invitrogen, USA). For the reverse transcription of RNA, the PrimeScript RT Reagent Kit (RR047A, Takara, Japan) was used to synthesize cDNA. Using SYBR Premix Ex Taq II (RR820A, Takara), we performed qPCR to detect mRNA levels following the specifications provided by the manufacturers. qPCR was performed on a 2.1 Real-Time PCR System using Bio-Rad CFX Manager (Bio-Rad, USA). The relative Ct method was adopted to compare the data of the experimental group and the control group, and GAPDH was set as internal control. The primer sequences are listed in Supplemental Table S3. The clinical information of the GBM patients who provided samples is listed in Supplemental Table S2.
shRNA Transfection
Specific shRNA targeting of human RND2 (shRND2) and negative control shRNA (shNC) were purchased from RiboBio Corporation (Guangzhou, China). Referring to the specifications, Lipofectamine 3000 transfection reagent (L3000015, Thermo Fisher Scientific) was used in the transfection. The sequences of the different shRND2 constructs are provided in Supplemental Table S3.
DNA Construction and Transfection
RND2 cDNA was subcloned with a Flag tag (Flag-RND2) into the pcDNA3.1 vector. Full-length p38 cDNA was subcloned with a 6x His tag (His-p38) into the pcDNA3.1 vector. Transfections were carried out with the help of the transfection reagent Lipofectamine 3000 (L3000015, Thermo Fisher Scientific) in accordance with the specifications.
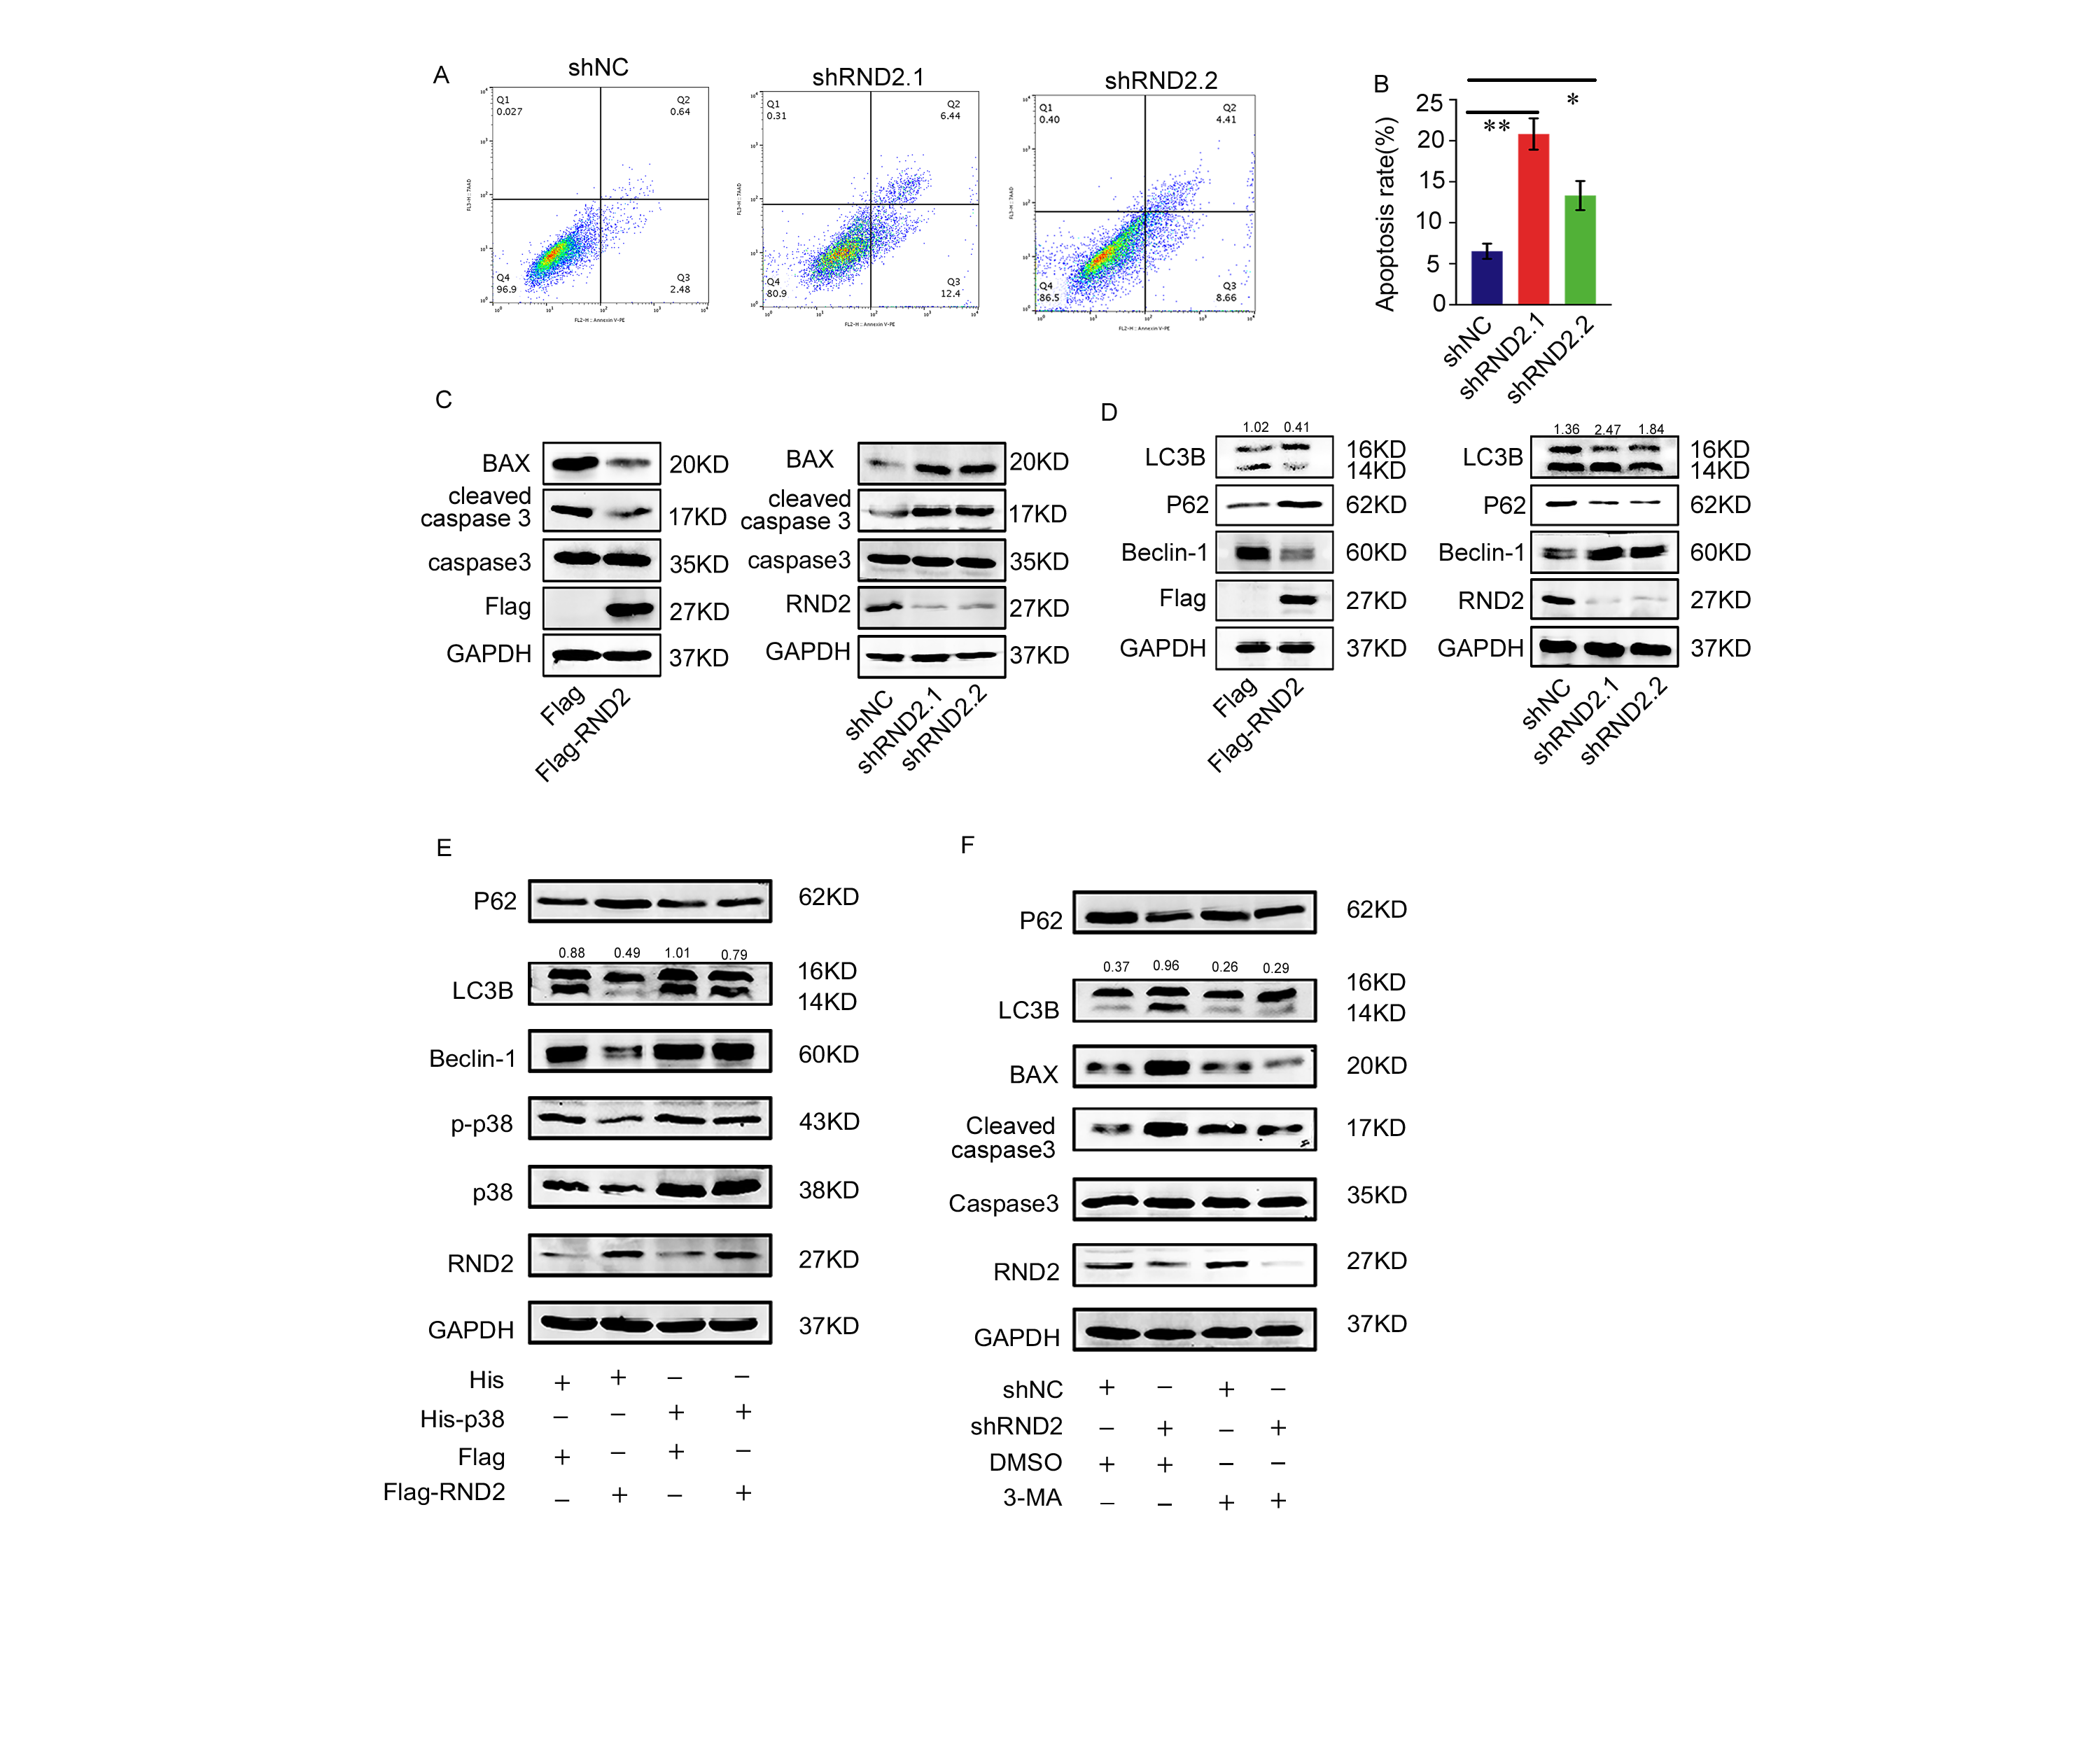
Flow Cytometric Analysis
An Annexin V-PE/7-AAD kit (Becton Dickinson, New Jersey, USA) was used to measure the apoptosis rate of GBM cells. GBM cells were collected and then washed with PBS three times. Then, samples were stained with Annexin V-PE/7-AAD for 15 minutes in the dark. One hour after staining, the specific apoptosis of GBM cells was analysed using a FACSCalibur flow cytometer (Becton Dickinson). Negative staining for both 7-AAD and Annexin V-PE suggested that the cells were still viable with no apoptosis. Cells in the early stage of apoptosis were positive for Annexin V-PE and negative for 7-AAD. Positive staining for both 7-AAD and Annexin V-PE meant that the cells were in the late stage of apoptosis, or were already dead. To calculate the total apoptosis rate and carry out statistical analysis, the sum of the upper and lower right quadrants was calculated.
Mitochondrial membrane potential (ΔΨm) assay
For early stage apoptosis, the collapse of Δψm function is a hallmark event. Δψm variations were detected by capturing the images of cells after JC-1 staining (Yeasen, Shanghai, China) using an Olympus BX51 microscope (Olympus, Japan) operated followed the manufacturer's specifications. We also recorded the ratio of aggregated JC-1 (red fluorescence) to monomeric JC-1 (green fluorescence). ImageJ software was used to detect the fluorescence intensity. A drop in the red/green fluorescence intensity ratio indicated the loss of ΔΨm.
TUNEL Assay
A feature of apoptotic cells is the fragmentation of DNA, which can be measured using a TUNEL kit. We followed the protocol offered by the manufacturer of the TUNEL kit (Roche Diagnostics, Mannheim, Germany). Images of stained cells were collected using the Olympus BX51 microscope (Olympus, Japan). ImageJ software was used to count TUNEL positive cells.
Western Blotting
Cells or tissues were lysed in RIPA buffer with protease and phosphatase inhibitors (cocktails from Roche and PMSF from Beyotime) for 30 minutes at 4℃. The protein concentration was detected using a BCA kit (Biosharp, China). Proteins were separated by SDS-PAGE and then transferred onto a PVDF membrane, which was incubated with primary antibodies (including anti-GAPDH, anti-Flag, anti-β-actin, anti-p-p38, anti-Rnd2, anti-p38, anti-His, anti- p62, anti-caspase3, anti-LC3B, anti-Beclin1, anti-BAX, and anti-cleaved-caspase3) overnight and secondary antibodies for an hour. The proteins were delineated with a LI-COR Odyssey Infrared imaging system (LI-COR Bioscience, USA). ImageJ software was used to detect the grey value of the blots. The relative protein quantity was normalized to GAPDH.
Immunoprecipitation assays
Cell lines U87 and U251 were co-transfected with the Flag-Rnd2 (Miaoling Biology, China) and His-p38 (Miaoling Biology, China) plasmids. Cells were lysed in IP buffer containing 1% NP-40, 50 mM NaF, 2 mM Na3VO4, 4 mM Na pyrophosphate and protease inhibitors 48 hours after transfection. A total of 3 μg of antibodies (anti-Flag, anti-His or IgG; Beyotime) were added to the cell lysates, and the samples were incubated with 30 μL Protein A/G (Santa Cruz Biotechnology) at 4℃ overnight. The precipitates were washed 5 times or more with IP buffer and were boiled for 5 minutes in 40 μL 1.5x loading buffer (Beyotime), followed by western blot.
Immunofluorescence assays
Cells were fixed in 4% paraformaldehyde for 15 minutes, treated with 0.1% Triton-X for 10 minutes and blocked with 1% BSA for 1 hour. The samples were then incubated with primary antibodies (anti-p38, anti-Rnd2, anti-pp38, anti-Lc3B, anti-Cleaved-Caspase3) overnight, followed by Alexa Fluor-labelled secondary antibodies (Antgene, China). The nuclei were stained by DAPI (ANT046, Antgene, China). The Olympus BX51 microscope (Olympus) and a FV1200 confocal microscope (Olympus) were used to take pictures. ImageJ software was used to count positive cells.
Immunohistochemistry
The tissues were embedded in paraffin after being fixed in 4% paraformaldehyde and cut into slices. After being hydrated, the slices were treated with 3% H2O2 for 10 minutes and blocked with 1% BSA for 1 hour. The samples were then incubated with primary antibodies (anti-LC3B, anti-cleaved-Caspase, anti-p-p38, anti-BAX, anti-Rnd2) overnight, followed by HRP-labelled secondary antibodies (Servicebio, China). DAB (Servicebio, China) was used for dyeing and haematoxylin was used to stain the nuclei. Pictures were taken with the Olympus BX51 microscope (Olympus). A semiquantitative score was applied to describe the distribution and intensity of RND2 staining (0 = negative, 1 = weak, 2 = moderate, 3 = strong, and 4 = strong and widely distributed).
Assay of Green Fluorescent Protein-LC3 Puncta
RND2 plasmids were transfected into GBM cells that stably expressed green fluorescent protein (GFP)-LC3. After 2 days, transfected cells were fixed with 4% paraformaldehyde, and then a confocal laser scanning microscope (Olympus, Japan) was used to visualize GFP-LC3 puncta in the cells. The number of GFP-LC3 puncta was calculated from at least 100 cells.
Transmission Electron Microscopy (TEM)
Cells transfected with CTRL or RND2 plasmids were fixed with an electron fixation solution containing 2.5% glutaraldehyde. The cells were then post-fixed in 1% osmic acid. Next, a graded series of ethanol was used to dehydrate the specimens. They were then placed in capsules contained embedding medium and heated at 70℃ for approximately 9 hours. The specimen sections were stained by uranyl acetate and alkaline lead citrate. Finally, the stained sections were observed using a TEM (Hitachi HT7700, Tokyo, Japan).
Intracranial Xenograft Model
PBS was used to suspend U87-MG cells, which stably expressed lentivirus RND2 or CTRL plasmids, at a concentration of 1×10⁵ cells/μL, and the cells were then injected into the right striatum of 6 week old Balb/c nude mice by stereotactic implantation; a blank control group that only received PBS was included. For the analysis of survival, the mice were under periodic monitoring and they were sacrificed when serious neurological symptoms appeared and/or an evident loss of weight (more than 20% of their body weight) occurred. We removed and weighed the whole mouse brains. The values (weight of control group/RND2 overexpression group - blank control group) were calculated and statistically analysed. All samples were then fixed in 4% paraformaldehyde. The brains were kept for further analysis and were embedded in paraffin. The Institutional Animal Care and Use Committee of the Renmin Hospital of Wuhan University approved all animal experiments mentioned above.
Statistical Analysis
All experiments were done in triplicate and were replicated at least once. All data are expressed as the means ± standard deviations. Statistical analyses were carried out with GraphPad Prism 7 and SPSS version 19.0. Unpaired Student t tests were used in the comparison of means between two groups. p values less than 0.05 were considered to be statistically significant. One-way analysis of variance (ANOVA) was performed to determine the differences between groups. When the analysis showed significance, post hoc testing that targeted the differences between groups was carried out using the Student-Newman-Keuls test. The Pearson correlation coefficient was used to analyse the correlation between RND2 and other genes. *P < 0.05, **P < 0.01, ***P < 0.001 was considered significant statistics.