3. Results And Discussion
The effect levels of the factors on purchase decision of furniture, without considering any socio-demographic characteristics, are given in Table 3.
| Factors | Frequency | Min. | Max. | Effect Value | Standard Deviation |
|---|---|---|---|---|---|
| Material | 1218 | 1 | 9 | 7.61 | 1.850 |
| Brand Value | 1218 | 1 | 9 | 6.82 | 2.182 |
| Quality Certification | 1218 | 1 | 9 | 7.22 | 2.190 |
| Lifetime | 1218 | 1 | 9 | 8.26 | 1.418 |
| Reliability | 1218 | 1 | 9 | 7.85 | 1.752 |
| Aesthetics | 1218 | 1 | 9 | 8.14 | 1.445 |
| Size | 1218 | 1 | 9 | 7.53 | 1.753 |
| Functionality | 1217 | 1 | 9 | 8.29 | 1.318 |
| Price | 1218 | 1 | 9 | 7.66 | 1.853 |
| Ease of Assembly | 1218 | 1 | 9 | 6.95 | 2.319 |
| Durability | 1218 | 1 | 9 | 7.78 | 1.866 |
| Delivery time | 1218 | 1 | 9 | 7.30 | 2.162 |
| Warranty | 1218 | 1 | 9 | 7.80 | 1.993 |
| After Sales Service | 1218 | 1 | 9 | 7.89 | 1.939 |
As can be seen in Table 3, "Functionality (8.29)" was the most effective factor in furniture purchasing, followed by "Lifetime (8.26)" and "Aesthetics (8.14)". The least effective factor was “Brand Image (6.82)”.
3.1. Effects of the factors on purchasing decision by gender
Some descriptive statistical values for the effect values of purchasing decision factors for each gender group are given in Table 4.
| Factors | Gender | Effect Value | Standard Deviation | Coefficient of Variation | Min. | Max. |
|---|---|---|---|---|---|---|
| Material | Male | 7.65 | 1.715 | 0.224 | 1 | 9 |
| Female | 7.58 | 1.920 | 0.253 | 1 | 9 | |
| Brand Value | Male | 6.79 | 2.134 | 0.315 | 1 | 9 |
| Female | 6.82 | 2.210 | 0.324 | 1 | 9 | |
| Quality Certification | Male | 6.90 | 2.357 | 0.342 | 1 | 9 |
| Female | 7.37 | 2.075 | 0.282 | 1 | 9 | |
| Lifetime | Male | 8.13 | 1.443 | 0.177 | 1 | 9 |
| Female | 8.33 | 1.401 | 0.168 | 1 | 9 | |
| Reliability | Male | 7.59 | 1.924 | 0.253 | 1 | 9 |
| Female | 7.99 | 1.630 | 0.204 | 1 | 9 | |
| Aesthetic | Male | 8.09 | 1.399 | 0.173 | 1 | 9 |
| Female | 8.16 | 1.470 | 0.180 | 1 | 9 | |
| Size | Male | 7.36 | 1.721 | 0.234 | 1 | 9 |
| Female | 7.62 | 1.764 | 0.231 | 1 | 9 | |
| Functionality | Male | 8.16 | 1.314 | 0.161 | 1 | 9 |
| Female | 8.36 | 1.316 | 0.157 | 1 | 9 | |
| Price | Male | 7.73 | 1.642 | 0.212 | 1 | 9 |
| Female | 7.60 | 1.959 | 0.258 | 1 | 9 | |
| Ease of Assembly | Male | 6.80 | 2.335 | 0.343 | 1 | 9 |
| Female | 7.00 | 2.310 | 0.330 | 1 | 9 | |
| Durability | Male | 7.58 | 1.959 | 0.258 | 1 | 9 |
| Female | 7.88 | 1.808 | 0.229 | 1 | 9 |
| Factors | Gender | Effect Value | Standard Deviation | Coefficient of Variation | Min. | Max. |
|---|---|---|---|---|---|---|
| Delivery time | Male | 7.25 | 2.214 | 0.305 | 1 | 9 |
| Female | 7.31 | 2.135 | 0.292 | 1 | 9 | |
| Warranty | Male | 7.51 | 2.177 | 0.290 | 1 | 9 |
| Female | 7.94 | 1.870 | 0.236 | 1 | 9 | |
| After Sales Service | Male | 7.67 | 2.041 | 0.266 | 1 | 9 |
| Female | 7.98 | 1.873 | 0.235 | 1 | 9 |
Results of the Mann-Whitney U and independent sample t-test, which were conducted to determine whether there was a significant difference between the purchasing decision effect values of the factors according to the gender, are given in Table 5.
| Factors | Gender | Frequency | Mean Rank | F Value | Effect Value | Significance Value |
|---|---|---|---|---|---|---|
| Material | Male | 431 | 605.04 | - | 7.65 | 0.727 |
| Female | 787 | 611.94 | 7.58 | |||
| Brand Values | Male | 431 | - | 1.116 | 6.80 | 0.291 |
| Female | 787 | 6.83 | ||||
| Quality Certification | Male | 431 | - | 8.291 | 6.92 | 0.004 |
| Female | 787 | 7.38 | ||||
| Lifetime | Male | 431 | 572.29 | - | 8.13 | 0.001 |
| Female | 787 | 629.88 | 8.33 | |||
| Reliability | Male | 431 | 560.81 | - | 7.59 | 0.000 |
| Female | 787 | 636.16 | 7.99 | |||
| Aesthetic | Male | 431 | 584.46 | - | 8.09 | 0.036 |
| Female | 787 | 623.21 | 8.16 | |||
| Size | Male | 431 | - | 0.564 | 7.36 | 0.453 |
| Female | 787 | 7.63 | ||||
| Functionality | Male | 430 | 564.61 | - | 8.15 | 0.000 |
| Female | 787 | 633.25 | 8.36 | |||
| Price | Male | 431 | - | 18.192 | 7.74 | 0.000 |
| Female | 787 | 7.61 | ||||
| Ease of Assembly | Male | 431 | - | 0.081 | 6.82 | 0.776 |
| Female | 787 | 7.02 | ||||
| Durability | Male | 431 | 569.40 | - | 7.58 | 0.001 |
| Female | 787 | 631.46 | 7.88 | |||
| Delivery time | Male | 431 | - | 0.026 | 7.27 | 0.871 |
| Female | 787 | 7.32 | ||||
| Warranty | Male | 431 | 567.21 | - | 7.53 | 0.000 |
| Female | 787 | 632.66 | 7.95 | |||
| After Sales Service | Male | 431 | 568.53 | - | 7.69 | 0.001 |
| Female | 787 | 631.94 | 8.00 | |||
| *Significance level for difference between means 0.05 | ||||||
As can be seen from Table 5, since significance values of Mann-Whitney U and independent sample t-test are greater than 0.05; the factors of material type, brand value, size, ease of assembly and delivery time have no effect on purchasing decisions of the individuals in different gender groups. Nevertheless, other factors are effective.
The effects of the factors of quality certification (7.38; 6.92), lifetime (8.33; 8.13), safety (7.99; 7.59), aesthetics (8.16; 8.09), usability (8.36; 8.15), price (7.61; 7.74), durability (7.88; 7.58), warranty (7.95; 7.53) and after sales service (8.00; 7.69) on purchasing decision are higher in women compared to men.
3.2. Effects of the factors on purchasing decision by Marital Status
Some descriptive statistical values for the effect values of the factors for each marital status group are given in Table 6.
| Factors | Marital Status | Effect Value | Std. Deviation | Coefficient of Variation | Min. | Max. |
|---|---|---|---|---|---|---|
| Material | Married | 7.61 | 1.913 | 0.252 | 1 | 9 |
| Single | 7.61 | 1.599 | 0.210 | 1 | 9 | |
| Other | 7.38 | 2.174 | 0.294 | 1 | 9 | |
| Brand Value | Married | 6.88 | 2.208 | 0.321 | 1 | 9 |
| Single | 6.60 | 2.080 | 0.315 | 1 | 9 | |
| Other | 6.58 | 2.266 | 0.345 | 3 | 9 | |
| Quality Certification | Married | 7.34 | 2.099 | 0.286 | 1 | 9 |
| Single | 6.79 | 2.390 | 0.352 | 1 | 9 | |
| Other | 6.85 | 2.461 | 0.359 | 2 | 9 | |
| Lifetime | Married | 8.25 | 1.457 | 0.176 | 1 | 9 |
| Single | 8.26 | 1.317 | 0.159 | 2 | 9 | |
| Other | 8.35 | 1.129 | 0.135 | 5 | 9 | |
| Reliability | Married | 7.97 | 1.692 | 0.212 | 1 | 9 |
| Single | 7.46 | 1.873 | 0.251 | 1 | 9 | |
| Other | 7.73 | 1.888 | 0.244 | 2 | 9 | |
| Aesthetic | Married | 8.15 | 1.455 | 0.179 | 1 | 9 |
| Single | 8.08 | 1.412 | 0.175 | 1 | 9 | |
| Other | 8.12 | 1.479 | 0.182 | 4 | 9 | |
| Size | Married | 7.57 | 1.777 | 0.235 | 1 | 9 |
| Single | 7.41 | 1.691 | 0.228 | 1 | 9 | |
| Other | 7.46 | 1.581 | 0.212 | 3 | 9 | |
| Functionality | Married | 8.33 | 1.308 | 0.157 | 1 | 9 |
| Single | 8.20 | 1.299 | 0.158 | 1 | 9 | |
| Other | 8.15 | 1.804 | 0.221 | 2 | 9 | |
| Price | Married | 7.60 | 1.900 | 0.250 | 1 | 9 |
| Single | 7.84 | 1.648 | 0.210 | 1 | 9 | |
| Other | 7.27 | 2.201 | 0.303 | 1 | 9 | |
| Ease of Assembly | Married | 7.04 | 2.296 | 0.326 | 1 | 9 |
| Single | 6.65 | 2.294 | 0.345 | 1 | 9 | |
| Other | 6.15 | 3.003 | 0.488 | 1 | 9 | |
| Durability | Married | 7.84 | 1.859 | 0.237 | 1 | 9 |
| Single | 7.57 | 1.793 | 0.237 | 1 | 9 | |
| Other | 7.62 | 2.684 | 0.353 | 1 | 9 | |
| Delivery Time | Married | 7.37 | 2.135 | 0.290 | 1 | 9 |
| Single | 7.00 | 2.256 | 0.322 | 1 | 9 | |
| Other | 7.73 | 1.756 | 0.227 | 3 | 9 | |
| Warranty | Married | 7.89 | 1.958 | 0.248 | 1 | 9 |
| Single | 7.46 | 2.112 | 0.283 | 1 | 9 | |
| Other | 7.85 | 1.488 | 0.190 | 5 | 9 | |
| After Sales Service | Married | 7.95 | 1.918 | 0.241 | 1 | 9 |
| Single | 7.62 | 2.024 | 0.266 | 1 | 9 | |
| Other | 7.88 | 1.479 | 0.188 | 4 | 9 |
Results of the Kruskal Wallis-H and ANOVA test, which were conducted to determine whether there was a significant difference between the purchasing decision effect values of the factors according to marital status, are given in Table 7.
| Factors | Gender | Frequency | Mean Rank | F Value | Effect Value | Significance Value |
|---|---|---|---|---|---|---|
| Material | Married | 908 | - | 0.190 | 7.61 | 0.827 |
| Single | 284 | 7.61 | ||||
| Other | 26 | 7.38 | ||||
| Brand Value | Married | 908 | - | 2.058 | 6.89 | 0.128 |
| Single | 284 | 6.61 | ||||
| Other | 26 | 6.58 | ||||
| Quality Certification | Married | 908 | - | 7.782 | 7.36 | 0.000 |
| Single | 284 | 6.81 | ||||
| Other | 26 | 6.85 | ||||
| Lifetime | Married | 908 | 612.57 | - | 8.26 | 0.819 |
| Single | 284 | 600.24 | 8.26 | |||
| Other | 26 | 603.38 | 8.35 | |||
| Reliability | Married | 908 | 635.82 | - | 7.97 | 0.000 |
| Single | 284 | 527.99 | 7.46 | |||
| Other | 26 | 580.60 | 7.73 | |||
| Aesthetic | Married | 908 | 616.54 | - | 8.15 | 0.368 |
| Single | 284 | 586.91 | 8.08 | |||
| Other | 26 | 610.29 | 8.12 | |||
| Size | Married | 908 | - | 0.864 | 7.57 | 0.422 |
| Single | 284 | 7.42 | ||||
| Other | 26 | 7.46 | ||||
| Functionality | Married | 908 | 622.49 | - | 8.32 | 0.016 |
| Single | 284 | 565.93 | 8.20 | |||
| Other | 26 | 631.71 | 8.15 | |||
| Price | Married | 908 | 603.58 | - | 7.60 | 0.259 |
| Single | 284 | 633.66 | 7.84 | |||
| Other | 26 | 552.48 | 7.27 | |||
| Ease of Assembly | Married | 908 | - | 4.670 | 7.06 | 0.010 |
| Single | 284 | 6.67 | ||||
| Other | 26 | 6.19 | ||||
| Durability | Married | 908 | 626.17 | - | 7.84 | 0.002 |
| Single | 284 | 552.35 | 7.57 | |||
| Other | 26 | 651.67 | 7.62 | |||
| Delivery Time | Married | 908 | - | 3.827 | 7.38 | 0.022 |
| Single | 284 | 7.01 | ||||
| Other | 26 | 7.73 | ||||
| Warranty | Married | 908 | 631.96 | - | 7.90 | 0.000 |
| Single | 284 | 539.47 | 7.48 | |||
| Other | 26 | 589.94 | 7.85 | |||
| After Sales Service | Married | 908 | 630.19 | - | 7.95 | 0.000 |
| Single | 284 | 547.07 | 7.62 | |||
| Other | 26 | 568.79 | 7.88 |
As can be seen in Table 7, since Kruskal Wallis-H and ANOVA test significance values are greater than 0.05; material type, brand value, lifetime, aesthetics, size and price factors are not effective on purchasing decisions of the individuals in different marital status groups, while other factors are effective.
The comparison analysis made to determine in which marital status groups the difference between the effect values of the factors that affect the purchasing decision, is given in Table 8.
| Factors | Effect Value | (I) Marital Status | (J) Marital Status | Mean Difference (I-J) | Standart Error | Significance Value |
|---|---|---|---|---|---|---|
| Quality Certification | 7.36 | Married | Single | 0.554* | 0.154 | 0.001 |
| Other | 0.514 | 0.487 | 0.659 | |||
| 6.81 | Single | Married | -0.554* | 0.154 | 0.001 | |
| Other | -0.040 | 0.502 | 1.000 | |||
| 6.85 | Other | Married | -0.514 | 0.487 | 0.659 | |
| Single | 0.040 | 0.502 | 1.000 | |||
| Reliability | 7.97 | Married | Single | 0.506* | 0.125 | 0.000 |
| Other | 0.236 | 0.375 | 0.899 | |||
| 7.46 | Single | Married | -0.506* | 0.125 | 0.000 | |
| Other | 0-.270 | 0.387 | 0.868 | |||
| 7.73 | Other | Married | -0.236 | 0.375 | 0.899 | |
| Single | 0.270 | 0.387 | 0.868 | |||
| Functionality | 8.32 | Married | Single | 0.114 | 0.088 | 0.476 |
| Other | 0.164 | 0.357 | 0.957 | |||
| 8.20 | Single | Married | -0.114 | 0.088 | 0.476 | |
| Other | 0.050 | 0.362 | 0.999 | |||
| 8.15 | Other | Married | -0.164 | 0.357 | 0.957 | |
| Single | -0.050 | 0.362 | 0.999 | |||
| Ease of Assembly | 7.06 | Married | Single | 0.387* | 0.152 | 0.033 |
| Other | 0.864 | 0.579 | 0.381 | |||
| 6.67 | Single | Married | -0.387* | 0.152 | 0.033 | |
| Other | 0.477 | 0.589 | 0.810 | |||
| 6.19 | Other | Married | -0.864 | 0.579 | 0.381 | |
| Single | -0.477 | 0.589 | 0.810 | |||
| Durability | 7.84 | Married | Single | 0.269 | 0.121 | 0.077 |
| Other | 0.158 | 0.487 | 0.984 | |||
| 7.57 | Single | Married | -0.269 | 0.121 | 0.077 | |
| Other | -0.111 | 0.494 | 0.994 | |||
| 7.62 | Other | Married | -0.158 | 0.487 | 0.984 | |
| Single | 0.111 | 0.494 | 0.994 | |||
| Delivery Time | 7.38 | Married | Single | 0.370* | 0.149 | 0.040 |
| Other | -0.350 | 0.351 | 0.697 | |||
| 7.01 | Single | Married | -0.370* | 0.149 | 0.040 | |
| Other | -0.720 | 0.369 | 0.168 | |||
| 7.73 | Other | Married | 0.350 | 0.351 | 0.697 | |
| Single | 0.720 | 0.369 | 0.168 | |||
| Warranty | 7.90 | Married | Single | 0.414* | 0.137 | 0.008 |
| Other | 0.050 | 0.299 | 0.998 | |||
| 7.48 | Single | Married | -0.414* | 0.137 | 0.008 | |
| Other | -0.364 | 0.316 | 0.592 | |||
| 7.85 | Other | Married | -0.050 | 0.299 | 0.998 | |
| Single | 0.364 | 0.316 | 0.592 | |||
| After Sales Service | 7.95 | Married | Single | 0.330* | 0.132 | 0.038 |
| Other | 0.082 | 0.296 | 0.990 | |||
| 7.62 | Single | Married | -0.330* | 0.132 | 0.038 | |
| Other | -0.247 | 0.312 | 0.819 | |||
| 7.88 | Other | Married | -0.082 | 0.296 | 0.990 | |
| Single | 0.247 | 0.312 | 0.819 | |||
| *Significance level for difference between means 0.05 | ||||||
As can be seen in Table 8, since all significance values are greater than 0.05 in pairwise comparison tests, no difference was found between the effect values of usability, durability and after sales service factors for marital status subgroups.
The differences between the effect values of quality certification, safety, ease of assembly, delivery time and warranty factors belonging to married and single marital status groups is significant, and the differences between the effect values of these two groups and the effect value of the other marital status group are insignificant.
In relation to all factors, since the effect values of married people are higher than those of singles, these factors are more effective in the purchasing decisions of married people compared to the singles.
3.3. Effects of the factors on purchasing decision by Age
Some descriptive statistical values for the effect values of the factors for each age group are given in Table 9.
| Factors | Age Groups | Effect Value | Std. Deviation | Coefficient of Variation | Min. | Max. |
|---|---|---|---|---|---|---|
| Material | 15–24 | 7.14 | 2.019 | 0.28 | 1 | 9 |
| 25–34 | 7.69 | 1.778 | 0.23 | 1 | 9 | |
| 35–44 | 7.74 | 1.807 | 0.23 | 1 | 9 | |
| 45–54 | 7.81 | 1.739 | 0.22 | 1 | 9 | |
| 55 + | 7.37 | 2.338 | 0.32 | 2 | 9 | |
| Brand Value | 15–24 | 6.44 | 2.248 | 0.35 | 1 | 9 |
| 25–34 | 6.83 | 2.220 | 0.33 | 1 | 9 | |
| 35–44 | 6.96 | 2.055 | 0.30 | 1 | 9 | |
| 45–54 | 7.16 | 2.097 | 0.29 | 1 | 9 | |
| 55 + | 6.42 | 2.219 | 0.35 | 2 | 9 | |
| Quality Certification | 15–24 | 6.78 | 2.348 | 0.35 | 1 | 9 |
| 25–34 | 7.15 | 2.231 | 0.31 | 1 | 9 | |
| 35–44 | 7.50 | 2.022 | 0.27 | 1 | 9 | |
| 45–54 | 7.62 | 1.965 | 0.26 | 1 | 9 | |
| 55 + | 7.26 | 1.661 | 0.23 | 3 | 9 | |
| Lifetime | 15–24 | 8.07 | 1.672 | 0.21 | 1 | 9 |
| 25–34 | 8.27 | 1.404 | 0.17 | 1 | 9 | |
| 35–44 | 8.33 | 1.343 | 0.16 | 1 | 9 | |
| 45–54 | 8.42 | 1.079 | 0.13 | 3 | 9 | |
| 55 + | 8.32 | .946 | 0.11 | 6 | 9 | |
| Reliability | 15–24 | 7.58 | 1.899 | 0.25 | 1 | 9 |
| 25–34 | 7.79 | 1.795 | 0.23 | 1 | 9 | |
| 35–44 | 8.11 | 1.611 | 0.20 | 1 | 9 | |
| 45–54 | 7.93 | 1.445 | 0.18 | 3 | 9 | |
| 55 + | 8.21 | 1.316 | 0.16 | 4 | 9 | |
| Aesthetic | 15–24 | 7.93 | 1.663 | 0.21 | 1 | 9 |
| 25–34 | 8.13 | 1.452 | 0.18 | 1 | 9 | |
| 35–44 | 8.27 | 1.302 | 0.16 | 1 | 9 | |
| 45–54 | 8.19 | 1.222 | 0.15 | 3 | 9 | |
| 55 + | 8.16 | 1.385 | 0.17 | 4 | 9 | |
| Size | 15–24 | 7.27 | 1.861 | 0.26 | 1 | 9 |
| 25–34 | 7.54 | 1.704 | 0.23 | 1 | 9 | |
| 35–44 | 7.63 | 1.804 | 0.24 | 1 | 9 | |
| 45–54 | 7.80 | 1.585 | 0.20 | 3 | 9 | |
| 55 + | 7.58 | 1.539 | 0.20 | 4 | 9 | |
| Functionality | 15–24 | 8.06 | 1.498 | 0.19 | 1 | 9 |
| 25–34 | 8.29 | 1.275 | 0.15 | 1 | 9 | |
| 35–44 | 8.41 | 1.305 | 0.16 | 1 | 9 | |
| 45–54 | 8.45 | 1.195 | 0.14 | 3 | 9 | |
| 55 + | 8.53 | .612 | 0.07 | 7 | 9 |
| Factors | Age Groups | Effect Value | Std. Deviation | Coefficient of Variation | Min. | Max. |
|---|---|---|---|---|---|---|
| Price | 15–24 | 7.54 | 2.014 | 0.27 | 1 | 9 |
| 25–34 | 7.68 | 1.741 | 0.23 | 1 | 9 | |
| 35–44 | 7.60 | 2.001 | 0.26 | 1 | 9 | |
| 45–54 | 7.92 | 1.603 | 0.20 | 3 | 9 | |
| 55 + | 7.47 | 1.806 | 0.24 | 3 | 9 | |
| Ease of Assembly | 15–24 | 6.68 | 2.245 | 0.34 | 1 | 9 |
| 25–34 | 6.83 | 2.402 | 0.35 | 1 | 9 | |
| 35–44 | 7.22 | 2.226 | 0.31 | 1 | 9 | |
| 45–54 | 7.26 | 2.165 | 0.30 | 1 | 9 | |
| 55 + | 6.84 | 2.433 | 0.36 | 2 | 9 | |
| Durability | 15–24 | 7.47 | 1.981 | 0.27 | 1 | 9 |
| 25–34 | 7.75 | 1.915 | 0.25 | 1 | 9 | |
| 35–44 | 7.94 | 1.756 | 0.22 | 1 | 9 | |
| 45–54 | 8.02 | 1.666 | 0.21 | 1 | 9 | |
| 55 + | 8.16 | 1.015 | 0.12 | 5 | 9 | |
| Delivery Time | 15–24 | 6.88 | 2.300 | 0.33 | 1 | 9 |
| 25–34 | 7.25 | 2.135 | 0.29 | 1 | 9 | |
| 35–44 | 7.59 | 2.075 | 0.27 | 1 | 9 | |
| 45–54 | 7.50 | 2.113 | 0.28 | 1 | 9 | |
| 55 + | 7.53 | 2.220 | 0.29 | 1 | 9 | |
| Warranty | 15–24 | 7.37 | 2.209 | 0.30 | 1 | 9 |
| 25–34 | 7.82 | 2.014 | 0.26 | 1 | 9 | |
| 35–44 | 8.05 | 1.772 | 0.22 | 1 | 9 | |
| 45–54 | 7.66 | 1.968 | 0.26 | 1 | 9 | |
| 55 + | 8.11 | 1.370 | 0.17 | 5 | 9 | |
| After Sales Service | 15–24 | 7.51 | 2.166 | 0.29 | 1 | 9 |
| 25–34 | 7.89 | 1.921 | 0.24 | 1 | 9 | |
| 35–44 | 8.08 | 1.878 | 0.23 | 1 | 9 | |
| 45–54 | 7.93 | 1.593 | 0.20 | 1 | 9 | |
| 55 + | 8.16 | 1.573 | 0.19 | 3 | 9 |
Results of the Kruskal Wallis-H and ANOVA tests, which were conducted to determine whether there was a significant difference between purchasing decision effect values of the factors according to age groups, are given in Table 10.
| Factors | Age Groups | Frequency | Mean Rank | F Value | Effect Value | Significance Value |
|---|---|---|---|---|---|---|
| Material Type | 15–24 | 227 | 519.38 | - | 7.14 | 0,000 |
| 25–34 | 580 | 624.49 | 7.69 | |||
| 35–44 | 306 | 635.41 | 7.74 | |||
| 45–54 | 86 | 654.16 | 7.81 | |||
| 55 + | 19 | 609.03 | 7.37 | |||
| Brand Values | 15–24 | 227 | - | 2.709 | 6.44 | 0,067 |
| 25–34 | 580 | 6.83 | ||||
| 35–44 | 306 | 6.96 | ||||
| 45–54 | 86 | 7.16 | ||||
| 55 + | 19 | 6.42 | ||||
| Quality Certification | 15–24 | 227 | 542.60 | - | 6.78 | 0,001 |
| 25–34 | 580 | 602.11 | 7.15 | |||
| 35–44 | 306 | 656.92 | 7.50 | |||
| 45–54 | 86 | 675.28 | 7.62 | |||
| 55 + | 19 | 572.76 | 7.26 | |||
| Lifetime | 15–24 | 227 | 586.75 | - | 8.07 | 0,614 |
| 25–34 | 580 | 610.79 | 8.27 | |||
| 35–44 | 306 | 623.01 | 8.33 | |||
| 45–54 | 86 | 622.63 | 8.42 | |||
| 55 + | 19 | 565.00 | 8.32 |
| Factors | Age Groups | Frequency | Mean Rank | F Value | Effect Value | Significance Value |
|---|---|---|---|---|---|---|
| Reliability | 15–24 | 227 | 559.16 | - | 7.58 | 0.003 |
| 25–34 | 580 | 599.56 | 7.79 | |||
| 35–44 | 306 | 664.88 | 8.11 | |||
| 45–54 | 86 | 600.44 | 7.93 | |||
| 55 + | 19 | 663.37 | 8.21 | |||
| Aesthetic | 15–24 | 227 | 573.88 | - | 7.93 | 0.231 |
| 25–34 | 580 | 608.96 | 8.13 | |||
| 35–44 | 306 | 637.62 | 8.27 | |||
| 45–54 | 86 | 605.74 | 8.19 | |||
| 55 + | 19 | 615.76 | 8.16 | |||
| Size | 15–24 | 227 | - | 1.956 | 7.27 | 0.099 |
| 25–34 | 580 | 7.54 | ||||
| 35–44 | 306 | 7.63 | ||||
| 45–54 | 86 | 7.80 | ||||
| 55 + | 19 | 7.58 | ||||
| Functionality | 15–24 | 227 | 544.65 | - | 8.06 | 0.001 |
| 25–34 | 579 | 607.34 | 8.29 | |||
| 35–44 | 306 | 646.14 | 8.41 | |||
| 45–54 | 86 | 661.77 | 8.45 | |||
| 55 + | 19 | 591.37 | 8.53 | |||
| Price | 15–24 | 227 | - | 0.776 | 7.54 | 0.540 |
| 25–34 | 580 | 7.68 | ||||
| 35–44 | 306 | 7.60 | ||||
| 45–54 | 86 | 7.92 | ||||
| 55 + | 19 | 7.47 | ||||
| Ease of Installation | 15–24 | 227 | - | 2.605 | 6.68 | 0.182 |
| 25–34 | 580 | 6.83 | ||||
| 35–44 | 306 | 7.22 | ||||
| 45–54 | 86 | 7.26 | ||||
| 55 + | 19 | 6.84 | ||||
| Durability | 15–24 | 227 | 548.46 | - | 7.47 | 0.011 |
| 25–34 | 580 | 611.05 | 7.75 | |||
| 35–44 | 306 | 639.16 | 7.94 | |||
| 45–54 | 86 | 657.25 | 8.02 | |||
| 55 + | 19 | 597.55 | 8.16 | |||
| Delivery Time | 15–24 | 227 | 542.96 | - | 6.88 | 0.001 |
| 25–34 | 580 | 600.63 | 7.25 | |||
| 35–44 | 306 | 664.53 | 7.59 | |||
| 45–54 | 86 | 641.80 | 7.50 | |||
| 55 + | 19 | 642.89 | 7.53 |
As can be seen from Table 10, since the Kruskal Wallis-H and ANOVA test significance values are greater than 0.05, the factors of brand value, lifetime, aesthetics, size, price and ease of assembly have no effect on purchasing decisions of individuals from different age groups. Other factors are effective.
The comparison analysis performed to determine in which age groups the differences between the effect values of the factors that affect purchasing decision, is given in Table 11.
| Factors | Effect Value | (I) Age Groups | (J) Age Groups | Mean Difference (I-J) | Std. Error | Significance Value |
|---|---|---|---|---|---|---|
| Material | 7.14 | 15–24 | 25–34 | -0.549* | 0.153 | 0.004 |
| 35–44 | -0.594* | 0.169 | 0.005 | |||
| 45–54 | -0.673* | 0.230 | 0.039 | |||
| 55 + | -0.227 | 0.553 | 1.000 | |||
| 7.69 | 25–34 | 15–24 | 0.549* | 0.153 | 0.004 | |
| 35–44 | -0.046 | 0.127 | 1.000 | |||
| 45–54 | -0.124 | 0.202 | 1.000 | |||
| 55 + | 0.321 | 0.542 | 1.000 | |||
| 7.74 | 35–44 | 15–24 | 0.594* | 0.169 | 0.005 | |
| 25–34 | 0.046 | 0.127 | 1.000 | |||
| 45–54 | -0.079 | 0.214 | 1.000 | |||
| 55 + | 0.367 | 0.546 | 0.999 | |||
| 7.81 | 45–54 | 15–24 | 0.673* | 0.230 | 0.039 | |
| 25–34 | 0.124 | 0.202 | 1.000 | |||
| 35–44 | 0.079 | 0.214 | 1.000 | |||
| 55 + | 0.446 | 0.568 | 0.997 | |||
| 7.37 | 55 + | 15–24 | 0.227 | 0.553 | 1.000 | |
| 25–34 | -0.321 | 0.542 | 1.000 | |||
| 35–44 | -0.367 | 0.546 | 0.999 | |||
| 45–54 | -0.446 | 0.568 | 0.997 | |||
| Quality Certification | 6.78 | 15–24 | 25–34 | -0.375 | 0.181 | 0.331 |
| 35–44 | -0.721* | 0.194 | 0.002 | |||
| 45–54 | -0.841* | 0.263 | 0.016 | |||
| 55 + | -0.488 | 0.412 | 0.942 | |||
| 7.15 | 25–34 | 15–24 | 0.375 | 0.181 | 0.331 | |
| 35–44 | -0.347 | 0.148 | 0.179 | |||
| 45–54 | -0.466 | 0.231 | 0.376 | |||
| 55 + | -0.113 | 0.392 | 1.000 | |||
| 7.50 | 35–44 | 15–24 | 0.721* | 0.194 | 0.002 | |
| 25–34 | 0.347 | 0.148 | 0.179 | |||
| 45–54 | -0.120 | 0.241 | 1.000 | |||
| 55 + | 0.234 | 0.398 | 1.000 | |||
| 7.62 | 45–54 | 15–24 | 0.841* | 0.263 | 0.016 | |
| 25–34 | 0.466 | 0.231 | 0.376 | |||
| 35–44 | 0.120 | 0.241 | 1.000 | |||
| 55 + | 0.353 | 0.436 | 0.996 | |||
| 7.26 | 55 + | 15–24 | 0.488 | 0.412 | 0.942 | |
| 25–34 | 0.113 | 0.392 | 1.000 | |||
| 35–44 | -0.234 | 0.398 | 1.000 | |||
| 45–54 | -0.353 | 0.436 | 0.996 | |||
| Reliability | 7.58 | 15–24 | 25–34 | -0.207 | 0.147 | 0.821 |
| 35–44 | -0.531* | 0.156 | 0.007 | |||
| 45–54 | -0.353 | 0.200 | 0.564 | |||
| 55 + | -0.633 | 0.327 | 0.486 | |||
| 7.79 | 25–34 | 15–24 | 0.207 | 0.147 | 0.821 | |
| 35–44 | -0.323 | 0.119 | 0.064 | |||
| 45–54 | -0.146 | 0.173 | 0.994 | |||
| 55 + | -0.426 | 0.311 | 0.872 | |||
| 8.11 | 35–44 | 15–24 | 0.531* | 0.156 | 0.007 | |
| 25–34 | 0.323 | 0.119 | 0.064 | |||
| 45–54 | 0.178 | 0.181 | 0.981 | |||
| 55 + | -0.103 | 0.316 | 1.000 | |||
| 7.93 | 45–54 | 15–24 | 0.353 | 0.200 | 0.564 | |
| 25–34 | 0.146 | 0.173 | 0.994 | |||
| 35–44 | -0.178 | 0.181 | 0.981 | |||
| 55 + | -0.280 | 0.340 | 0.995 | |||
| 8.21 | 55 + | 15–24 | 0.633 | 0.327 | 0.486 | |
| 25–34 | 0.426 | 0.311 | 0.872 | |||
| 35–44 | 0.103 | 0.316 | 1.000 | |||
| 45–54 | 0.280 | 0.340 | 0.995 | |||
| 25–34 | -0.028 | 0.344 | 1.000 | |||
| *Significance level for difference between means 0.05 | ||||||
| Factors | Effect Value | (I) Age Groups | (J) Age Groups | Mean Difference (I-J) | Std. Error | Significance Value |
|---|---|---|---|---|---|---|
| Ease of Assembly | 8.06 | 15–24 | 25–34 | -0.230 | 0.113 | 0.347 |
| 35–44 | -0.344 | 0.124 | 0.058 | |||
| 45–54 | -0.392 | 0.163 | 0.158 | |||
| 55 + | -0.465 | 0.172 | 0.096 | |||
| 8.29 | 25–34 | 15–24 | 0.230 | 0.113 | 0.347 | |
| 35–44 | -0.113 | 0.092 | 0.912 | |||
| 45–54 | -0.162 | 0.139 | 0.942 | |||
| 55 + | -0.234 | 0.150 | 0.756 | |||
| 8.41 | 35–44 | 15–24 | 0.344 | 0.124 | 0.058 | |
| 25–34 | 0.113 | 0.092 | 0.912 | |||
| 45–54 | -0.048 | 0.149 | 1.000 | |||
| 55 + | -0.121 | 0.159 | 0.998 | |||
| 8.45 | 45–54 | 15–24 | 0.392 | 0.163 | 0.158 | |
| 25–34 | 0.162 | 0.139 | 0.942 | |||
| 35–44 | 0.048 | 0.149 | 1.000 | |||
| 55 + | -0.073 | 0.191 | 1.000 | |||
| 8.53 | 55 + | 15–24 | 0.465 | 0.172 | 0.096 | |
| 25–34 | 0.234 | 0.150 | 0.756 | |||
| 35–44 | 0.121 | 0.159 | 0.998 | |||
| 45–54 | 0.073 | 0.191 | 1.000 | |||
| Durability | 7.47 | 15–24 | 25–34 | -0.288 | 0.154 | 0.469 |
| 35–44 | -0.477* | 0.165 | 0.040 | |||
| 45–54 | -0.556 | 0.223 | 0.126 | |||
| 55 + | -0.691 | 0.267 | 0.137 | |||
| 7.75 | 25–34 | 15–24 | 0.288 | 0.154 | 0.469 | |
| 35–44 | -0.189 | 0.128 | 0.778 | |||
| 45–54 | -0.268 | 0.196 | 0.854 | |||
| 55 + | -0.403 | 0.246 | 0.707 | |||
| 7.94 | 35–44 | 15–24 | 0.477* | 0.165 | 0.040 | |
| 25–34 | 0.189 | 0.128 | 0.778 | |||
| 45–54 | -0.079 | 0.206 | 1.000 | |||
| 55 + | -0.213 | 0.253 | 0.995 | |||
| 8.02 | 45–54 | 15–24 | 0.556 | 0.223 | 0.126 | |
| 25–34 | 0.268 | 0.196 | 0.854 | |||
| 35–44 | 0.079 | 0.206 | 1.000 | |||
| 55 + | -0.135 | 0.294 | 1.000 | |||
| 8.16 | 55 + | 15–24 | 0.691 | 0.267 | 0.137 | |
| 25–34 | 0.403 | 0.246 | 0.707 | |||
| 35–44 | 0.213 | 0.253 | 0.995 | |||
| 45–54 | 0.135 | 0.294 | 1.000 | |||
| Delivery Time | 6.88 | 15–24 | 25–34 | -0.374 | 0.177 | 0.297 |
| 35–44 | -0.714* | 0.193 | 0.002 | |||
| 45–54 | -0.619 | 0.274 | 0.226 | |||
| 55 + | -0.645 | 0.532 | 0.934 | |||
| 7.25 | 25–34 | 15–24 | 0.374 | 0.177 | 0.297 | |
| 35–44 | -0.340 | 0.148 | 0.201 | |||
| 45–54 | -0.245 | 0.244 | 0.978 | |||
| 55 + | -0.271 | 0.517 | 1.000 | |||
| 7.59 | 35–44 | 15–24 | 0.714* | 0.193 | 0.002 | |
| 25–34 | 0.340 | 0.148 | 0.201 | |||
| 45–54 | 0.095 | 0.257 | 1.000 | |||
| 55 + | 0.068 | 0.523 | 1.000 | |||
| 7.50 | 45–54 | 15–24 | 0.619 | 0.274 | 0.226 | |
| 25–34 | 0.245 | 0.244 | 0.978 | |||
| 35–44 | -0.095 | 0.257 | 1.000 | |||
| 55 + | -0.026 | 0.558 | 1.000 | |||
| 7.53 | 55 + | 15–24 | 0.645 | 0.532 | 0.934 | |
| 25–34 | 0.271 | 0.517 | 1.000 | |||
| 35–44 | -0.068 | 0.523 | 1.000 | |||
| 45–54 | 0.026 | 0.558 | 1.000 | |||
| *Significance level for difference between means 0.05 | ||||||
Table 11. (Continue) Comparison analysis for the differences between age subgroups according to the factors
| Factors | Effect Value | (I) Age Groups | (J) Age Groups | Mean Difference (I-J) | Std. Error | Significance Value |
|---|---|---|---|---|---|---|
| Warranty | 7.37 | 15–24 | 25–34 | -0.452 | 0.169 | 0.074 |
| 35–44 | -0.676* | 0.178 | 0.002 | |||
| 45–54 | -0.293 | 0.258 | 0.949 | |||
| 55 + | -0.735 | 0.347 | 0.359 | |||
| 7.82 | 25–34 | 15–24 | 0.452 | 0.169 | 0.074 | |
| 35–44 | -0.223 | 0.131 | 0.608 | |||
| 45–54 | 0.160 | 0.228 | 0.999 | |||
| 55 + | -0.283 | 0.325 | 0.993 | |||
| 8.05 | 35–44 | 15–24 | 0.676* | 0.178 | 0.002 | |
| 25–34 | 0.223 | 0.131 | 0.608 | |||
| 45–54 | 0.383 | 0.235 | 0.673 | |||
| 55 + | -0.060 | 0.330 | 1.000 | |||
| 7.66 | 45–54 | 15–24 | 0.293 | 0.258 | 0.949 | |
| 25–34 | -0.160 | 0.228 | 0.999 | |||
| 35–44 | -0.383 | 0.235 | 0.673 | |||
| 55 + | -0.442 | 0.379 | 0.944 | |||
| 8.11 | 55 + | 15–24 | 0.735 | 0.347 | 0.359 | |
| 25–34 | 0.283 | 0.325 | 0.993 | |||
| 35–44 | 0.060 | 0.330 | 1.000 | |||
| 45–54 | 0.442 | 0.379 | 0.944 | |||
| After Sales Service | 7.51 | 15–24 | 25–34 | -0.386 | 0.164 | 0.177 |
| 35–44 | -0.569* | 0.179 | 0.016 | |||
| 45–54 | -0.424 | 0.224 | 0.461 | |||
| 55 + | -0.651 | 0.388 | 0.676 | |||
| 7.89 | 25–34 | 15–24 | 0.386 | 0.164 | 0.177 | |
| 35–44 | -0.182 | 0.134 | 0.852 | |||
| 45–54 | -0.037 | 0.189 | 1.000 | |||
| 55 + | -0.265 | 0.370 | 0.999 | |||
| 8.08 | 35–44 | 15–24 | 0.569* | 0.179 | 0.016 | |
| 25–34 | 0.182 | 0.134 | 0.852 | |||
| 45–54 | 0.145 | 0.203 | 0.998 | |||
| 55 + | -0.083 | 0.376 | 1.000 | |||
| 7.93 | 45–54 | 15–24 | 0.424 | 0.224 | 0.461 | |
| 25–34 | 0.037 | 0.189 | 1.000 | |||
| 35–44 | -0.145 | 0.203 | 0.998 | |||
| 55 + | -0.228 | 0.400 | 1.000 | |||
| 8.16 | 55 + | 15–24 | 0.651 | 0.388 | 0.676 | |
| 25–34 | 0.265 | 0.370 | 0.999 | |||
| 35–44 | 0.083 | 0.376 | 1.000 | |||
| 45–54 | 0.228 | 0.400 | 1.000 | |||
| *Significance level for difference between means 0.05 | ||||||
The difference between effect values of material on purchasing decision of 15–24 age group and 25–34, 35–44 and 45–54 age groups is significant, but there is no significant difference between 55 and over age group. Apart from this, the difference between 15–24 age group and 55 and over age group is insignificant. According to this result, in 25–34, 35–44 and 45–54 age groups, the material has the same effect (7.81; 7.74 and 7.69) on purchasing decision of individuals, while it is at a lower level effective (7.37 and 7.14) in 15–24 and 55 and over age groups.
The differences between the effect values of quality certification on purchasing decision of 15–24 age group and 35–44 and 45–54 age groups are significant, while the differences between effect values of 25–34 and 55 and over age groups are insignificant. Except for 15–24 age group, the differences between effect values of pairwise comparison of other age groups are insignificant. According to this data, compared to other age groups, quality certification is more effective in purchasing decisions of 35–44 and 45–54 age groups.
The differences between effect values of usability, durability and delivery time on purchase decision of 15–24 and 35–44 age group are significant; the differences between effect values of other age groups are insignificant. Except for 15–24 age group, the differences between dual comparison effect values of other age groups are insignificant. According to this data; compared to other age groups, usability, durability and delivery time are more effective in purchasing decisions of 35–44, 45–54 and 55 and over age groups.
The differences between effect values of reliability, warranty and after sales service on purchase decision of 15–24 and 35–44 age groups are significant, the differences between effect values of other age groups are insignificant. Except for 15–24 age group, the differences between pairwise comparison effect values of other age groups are insignificant. According to this; compared to other age groups, warranty, reliability and after sales service are more effective in purchasing decisions of 35–44 and 55 and over age groups.
3.4. Effects of the factors on purchasing decision by educational status
Some descriptive statistical values for the effect values of the factors for each educational status group are given in Table 12.
| Factors | Educational Status Groups | Effect Value | Standard Deviation | Coefficient of Variation | Min. | Max. |
|---|---|---|---|---|---|---|
| Material | Primary School and Below | 6.41 | 2.695 | 0.424 | 1 | 9 |
| Elementary and Middle School | 7.04 | 2.536 | 0.360 | 1 | 9 | |
| High School | 7.54 | 1.975 | 0.262 | 1 | 9 | |
| Vocational High School | 7.38 | 1.953 | 0.265 | 1 | 9 | |
| Associate's Degree | 7.70 | 1.641 | 0.213 | 1 | 9 | |
| Bachelor's Degree | 7.87 | 1.518 | 0.193 | 1 | 9 | |
| Postgraduate | 7.87 | 1.352 | 0.172 | 4 | 9 | |
| Brand Value | Primary School and Below | 5.56 | 2.699 | 0.488 | 1 | 9 |
| Elementary and Middle School | 6.84 | 2.484 | 0.365 | 1 | 9 | |
| High School | 6.98 | 2.242 | 0.322 | 1 | 9 | |
| Vocational High School | 6.71 | 2.309 | 0.345 | 1 | 9 | |
| Associate's Degree | 6.96 | 2.226 | 0.321 | 1 | 9 | |
| Bachelor's Degree | 6.90 | 1.900 | 0.276 | 1 | 9 | |
| Postgraduate | 6.23 | 2.142 | 0.344 | 1 | 9 |
| Factors | Educational Status Groups | Effect Value | Std. Deviation | Coefficient of Variation | Min | Max |
|---|---|---|---|---|---|---|
| Quality Certification | Primary School and Below | 6.41 | 2.374 | 0.372 | 1 | 9 |
| Elementary and Middle School | 7.38 | 2.126 | 0.289 | 1 | 9 | |
| High School | 7.58 | 1.914 | 0.253 | 1 | 9 | |
| Vocational High School | 7.51 | 1.978 | 0.264 | 1 | 9 | |
| Associate's Degree | 7.43 | 1.958 | 0.264 | 1 | 9 | |
| Bachelor's Degree | 6.99 | 2.361 | 0.339 | 1 | 9 | |
| Postgraduate | 6.45 | 2.591 | 0.404 | 1 | 9 | |
| Lifetime | Primary School and Below | 7.53 | 2.178 | 0.290 | 1 | 9 |
| Elementary and Middle School | 8.13 | 1.645 | 0.202 | 1 | 9 | |
| High School | 8.39 | 1.331 | 0.159 | 1 | 9 | |
| Vocational High School | 8.30 | 1.497 | 0.181 | 1 | 9 | |
| Associate's Degree | 8.30 | 1.349 | 0.163 | 2 | 9 | |
| Bachelor's Degree | 8.26 | 1.326 | 0.161 | 1 | 9 | |
| Postgraduate | 8.22 | 1.383 | 0.168 | 1 | 9 | |
| Reliability | Primary School and Below | 7.56 | 2.191 | 0.291 | 1 | 9 |
| Elementary and Middle School | 8.11 | 1.824 | 0.225 | 1 | 9 | |
| High School | 7.93 | 1.805 | 0.228 | 1 | 9 | |
| Vocational High School | 7.99 | 1.624 | 0.203 | 2 | 9 | |
| Associate's Degree | 8.03 | 1.489 | 0.185 | 1 | 9 | |
| Bachelor's Degree | 7.69 | 1.762 | 0.229 | 1 | 9 | |
| Postgraduate | 7.46 | 1.978 | 0.265 | 1 | 9 | |
| Aesthetic | Primary School and Below | 7.47 | 1.830 | 0.245 | 3 | 9 |
| Elementary and Middle School | 8.08 | 1.653 | 0.205 | 1 | 9 | |
| High School | 8.20 | 1.527 | 0.186 | 1 | 9 | |
| Vocational High School | 8.06 | 1.660 | 0.206 | 1 | 9 | |
| Associate's Degree | 8.18 | 1.342 | 0.164 | 1 | 9 | |
| Bachelor's Degree | 8.16 | 1.313 | 0.161 | 1 | 9 | |
| Postgraduate | 8.17 | 1.200 | 0.147 | 5 | 9 | |
| Size | Primary School and Below | 6.97 | 2.007 | 0.288 | 3 | 9 |
| Elementary and Middle School | 7.36 | 1.840 | 0.250 | 3 | 9 | |
| High School | 7.55 | 1.891 | 0.251 | 1 | 9 | |
| Vocational High School | 7.52 | 2.011 | 0.268 | 1 | 9 | |
| Associate's Degree | 7.58 | 1.734 | 0.229 | 2 | 9 | |
| Bachelor's Degree | 7.62 | 1.602 | 0.210 | 1 | 9 | |
| Postgraduate | 7.37 | 1.406 | 0.191 | 4 | 9 | |
| Functionality | Primary School and Below | 7.76 | 1.990 | 0.257 | 1 | 9 |
| Elementary and Middle School | 7.83 | 1.692 | 0.216 | 2 | 9 | |
| High School | 8.39 | 1.349 | 0.161 | 1 | 9 | |
| Vocational High School | 8.36 | 1.428 | 0.171 | 1 | 9 | |
| Associate's Degree | 8.34 | 1.201 | 0.144 | 3 | 9 | |
| Bachelor's Degree | 8.35 | 1.126 | 0.135 | 2 | 9 | |
| Postgraduate | 8.29 | 1.175 | 0.142 | 3 | 9 | |
| Price | Primary School and Below | 6.59 | 2.743 | 0.416 | 1 | 9 |
| Elementary and Middle School | 7.07 | 2.430 | 0.345 | 1 | 9 | |
| High School | 7.75 | 1.862 | 0.241 | 1 | 9 | |
| Vocational High School | 7.50 | 2.011 | 0.268 | 1 | 9 | |
| Associate's Degree | 7.76 | 1.702 | 0.219 | 2 | 9 | |
| Bachelor's Degree | 7.83 | 1.576 | 0.201 | 1 | 9 | |
| Postgraduate | 7.67 | 1.601 | 0.209 | 2 | 9 | |
| Ease of Assembly | Primary School and Below | 6.91 | 2.314 | 0.335 | 1 | 9 |
| Elementary and Middle School | 6.90 | 2.532 | 0.368 | 1 | 9 | |
| High School | 7.25 | 2.210 | 0.306 | 1 | 9 | |
| Vocational High School | 7.23 | 2.347 | 0.325 | 1 | 9 | |
| Associate's Degree | 7.03 | 2.250 | 0.320 | 1 | 9 | |
| Bachelor's Degree | 6.77 | 2.337 | 0.347 | 1 | 9 | |
| Postgraduate | 6.36 | 2.261 | 0.356 | 1 | 9 | |
| Durability | Primary School and Below | 7.09 | 2.522 | 0.357 | 1 | 9 |
| Elementary and Middle School | 7.71 | 2.211 | 0.288 | 1 | 9 | |
| High School | 7.90 | 1.848 | 0.234 | 1 | 9 | |
| Vocational High School | 7.98 | 1.727 | 0.217 | 1 | 9 | |
| Associate's Degree | 7.89 | 1.786 | 0.227 | 1 | 9 | |
| Bachelor's Degree | 7.72 | 1.797 | 0.233 | 1 | 9 | |
| Postgraduate | 7.58 | 1.799 | 0.238 | 1 | 9 |
Table 12. (Continue) Some descriptive statistical values for the effect values of purchasing decision factors for each educational status group
| Factors | Educational Status Groups | Effect Value | Std. Deviation | Coefficient of Variation | Min | Max |
|---|---|---|---|---|---|---|
| Delivery Time | Primary School and Below | 6.44 | 2.629 | 0.412 | 1 | 9 |
| Elementary and Middle School | 7.19 | 2.431 | 0.339 | 1 | 9 | |
| High School | 7.44 | 2.248 | 0.302 | 1 | 9 | |
| Vocational High School | 7.86 | 1.897 | 0.242 | 1 | 9 | |
| Associate's Degree | 7.57 | 1.831 | 0.242 | 2 | 9 | |
| Bachelor's Degree | 7.02 | 2.196 | 0.313 | 1 | 9 | |
| Postgraduate | 7.26 | 2.029 | 0.280 | 1 | 9 | |
| Warranty | Primary School and Below | 6.44 | 3.093 | 0.487 | 1 | 9 |
| Elementary and Middle School | 7.41 | 2.440 | 0.330 | 1 | 9 | |
| High School | 7.96 | 1.996 | 0.251 | 1 | 9 | |
| Vocational High School | 8.30 | 1.534 | 0.185 | 1 | 9 | |
| Associate's Degree | 8.03 | 1.686 | 0.210 | 1 | 9 | |
| Bachelor's Degree | 7.71 | 1.920 | 0.249 | 1 | 9 | |
| Postgraduate | 7.49 | 2.094 | 0.280 | 1 | 9 | |
| After Sales Service | Primary School and Below | 6.47 | 3.285 | 0.515 | 1 | 9 |
| Elementary and Middle School | 7.53 | 2.325 | 0.310 | 1 | 9 | |
| High School | 8.12 | 1.898 | 0.234 | 1 | 9 | |
| Vocational High School | 8.14 | 1.721 | 0.212 | 1 | 9 | |
| Associate's Degree | 8.13 | 1.564 | 0.193 | 1 | 9 | |
| Bachelor's Degree | 7.80 | 1.882 | 0.242 | 1 | 9 | |
| Postgraduate | 7.73 | 1.898 | 0.245 | 2 | 9 |
Results of the Kruskal Wallis-H and ANOVA tests, which were conducted to determine whether there was a significant difference between the purchasing decision effect values of the factors according to the educational status groups, are given in Table 13.
| Factors | Educational Status Groups | Frequency | Mean Rank | F Value | Effect Value | Significance Value |
|---|---|---|---|---|---|---|
| Material | Primary School and Below | 34 | 442.54 | - | 6.41 | 0.011 |
| Elementary and Middle School | 112 | 566.02 | 7.04 | |||
| High School | 241 | 609.70 | 7.54 | |||
| Vocational High School | 125 | 568.84 | 7.38 | |||
| Associate's Degree | 216 | 616.04 | 7.70 | |||
| Bachelor's Degree | 412 | 640.58 | 7.87 | |||
| Postgraduate | 78 | 627.01 | 7.87 | |||
| Brand Value | Primary School and Below | 34 | - | 3.499 | 5.56 | 0.002 |
| Elementary and Middle School | 112 | 6.84 | ||||
| High School | 241 | 6.98 | ||||
| Vocational High School | 125 | 6.71 | ||||
| Associate's Degree | 216 | 6.96 | ||||
| Bachelor's Degree | 412 | 6.90 | ||||
| Postgraduate | 78 | 6.23 | ||||
| Quality Certification | Primary School and Below | 34 | - | 5.405 | 6.41 | 0.000 |
| Elementary and Middle School | 112 | 7.38 | ||||
| High School | 241 | 7.58 | ||||
| Vocational High School | 125 | 7.51 | ||||
| Associate's Degree | 216 | 7.43 | ||||
| Bachelor's Degree | 412 | 6.99 | ||||
| Postgraduate | 78 | 6.45 |
| Factors | Educational Status Groups | Frequency | Mean Rank | F Value | Effect Value | Significance Value |
|---|---|---|---|---|---|---|
| Lifetime | Primary School and Below | 34 | 495.00 | - | 7.53 | 0.131 |
| Elementary and Middle School | 112 | 604.92 | 8.13 | |||
| High School | 241 | 638.48 | 8.39 | |||
| Vocational High School | 125 | 629.46 | 8.30 | |||
| Associate's Degree | 216 | 619.09 | 8.30 | |||
| Bachelor's Degree | 412 | 597.10 | 8.26 | |||
| Postgraduate | 78 | 583.41 | 8.22 | |||
| Reliability | Primary School and Below | 34 | - | 2.442 | 7.56 | 0.024 |
| Elementary and Middle School | 112 | 8.11 | ||||
| High School | 241 | 7.93 | ||||
| Vocational High School | 125 | 7.99 | ||||
| Associate's Degree | 216 | 8.03 | ||||
| Bachelor's Degree | 412 | 7.69 | ||||
| Postgraduate | 78 | 7.46 | ||||
| Aesthetics | Primary School and Below | 34 | 488.63 | - | 7.47 | 0.326 |
| Elementary and Middle School | 112 | 622.26 | 8.08 | |||
| High School | 241 | 631.67 | 8.20 | |||
| Vocational High School | 125 | 610.22 | 8.06 | |||
| Associate's Degree | 216 | 611.86 | 8.18 | |||
| Bachelor's Degree | 412 | 603.85 | 8.16 | |||
| Postgraduate | 78 | 597.53 | 8.17 | |||
| Size | Primary School and Below | 34 | 510.38 | - | 6.97 | 0.183 |
| Elementary and Middle School | 112 | 581.89 | 7.36 | |||
| High School | 241 | 628.66 | 7.55 | |||
| Vocational High School | 125 | 632.20 | 7.52 | |||
| Associate's Degree | 216 | 622.57 | 7.58 | |||
| Bachelor's Degree | 412 | 613.34 | 7.62 | |||
| Postgraduate | 78 | 540.25 | 7.37 | |||
| Functionality | Primary School and Below | 34 | 521.56 | - | 7.76 | 0.011 |
| Elementary and Middle School | 112 | 531.11 | 7.83 | |||
| High School | 241 | 642.44 | 8.39 | |||
| Vocational High School | 125 | 646.55 | 8.36 | |||
| Associate's Degree | 216 | 614.08 | 8.34 | |||
| Bachelor's Degree | 411 | 608.55 | 8.35 | |||
| Postgraduate | 78 | 589.13 | 8.29 | |||
| Price | Primary School and Below | 34 | - | 4.959 | 6.59 | 0.000 |
| Elementary and Middle School | 112 | 7.07 | ||||
| High School | 241 | 7.75 | ||||
| Vocational High School | 125 | 7.50 | ||||
| Associate's Degree | 216 | 7.76 | ||||
| Bachelor's Degree | 412 | 7.83 | ||||
| Postgraduate | 78 | 7.67 | ||||
| Ease of Assembly | Primary School and Below | 34 | - | 2.433 | 6.91 | 0.024 |
| Elementary and Middle School | 112 | 6.90 | ||||
| High School | 241 | 7.25 | ||||
| Vocational High School | 125 | 7.23 | ||||
| Associate's Degree | 216 | 7.03 | ||||
| Bachelor's Degree | 412 | 6.77 | ||||
| Postgraduate | 78 | 6.36 | ||||
| Durability | Primary School and Below | 34 | - | 1.640 | 7.09 | 0.133 |
| Elementary and Middle School | 112 | 7.71 | ||||
| High School | 241 | 7.90 | ||||
| Vocational High School | 125 | 7.98 | ||||
| Associate's Degree | 216 | 7.89 | ||||
| Bachelor's Degree | 412 | 7.72 | ||||
| Postgraduate | 78 | 7.58 |
Table 13. (Continue) Kruskal Wallis-H and ANOVA test results depending on the factors and educational status groups
| Factors | Educational Status Groups | Frequency | Mean Rank | F Value | Effect Value | Significance Value |
|---|---|---|---|---|---|---|
| Delivery Time | Primary School and Below | 34 | - | 4.464 | 6.44 | 0.000 |
| Elementary and Middle School | 112 | 7.19 | ||||
| High School | 241 | 7.44 | ||||
| Vocational High School | 125 | 7.86 | ||||
| Associate's Degree | 216 | 7.57 | ||||
| Bachelor's Degree | 412 | 7.02 | ||||
| Postgraduate | 78 | 7.26 | ||||
| Warranty | Primary School and Below | 34 | 451.32 | - | 6.44 | 0.000 |
| Elementary and Middle School | 112 | 587.34 | 7.41 | |||
| High School | 241 | 648.66 | 7.96 | |||
| Vocational High School | 125 | 699.46 | 8.30 | |||
| Associate's Degree | 216 | 630.79 | 8.03 | |||
| Bachelor's Degree | 412 | 578.13 | 7.71 | |||
| Postgraduate | 78 | 551.84 | 7.49 | |||
| After Sales Service | Primary School and Below | 34 | 463.56 | - | 6.47 | 0.000 |
| Elementary and Middle School | 112 | 578.44 | 7.53 | |||
| High School | 241 | 664.25 | 8.12 | |||
| Vocational High School | 125 | 654.96 | 8.14 | |||
| Associate's Degree | 216 | 635.28 | 8.13 | |||
| Bachelor's Degree | 412 | 576.94 | 7.80 | |||
| Postgraduate | 78 | 576.09 | 7.73 |
As can be seen from the Table 13, since the Kruskal Wallis-H and ANOVA test significance values are greater than 0.05, the factors of lifetime, aesthetics, size and durability have no effect on purchasing decisions of the individuals from different educational status groups. Other factors are effective.
The comparison analysis performed to determine in which educational status the difference between the effect values of the factors that affect the purchasing decision, is given in Table 14.
| Factors | Effect Value | (I) Educational Status Groups | (J) Educational Status Groups | Mean Difference (I-J) | Std. Error | Significance Value |
|---|---|---|---|---|---|---|
| Material | 6.41 | Primary School and Below | Elementary and Middle School | -0.624 | 0.500 | 0.994 |
| High School | -0.124 | 0.457 | 0.325 | |||
| Vocational High School | -0.964 | 0.472 | 0.636 | |||
| Associate's Degree | -0.292 | 0.453 | 0.138 | |||
| Bachelor's Degree | -0.455 | 0.445 | 0.050 | |||
| Postgraduate | -0.460 | 0.465 | 0.063 | |||
| 7.04 | Elementary and Middle School | Primary School and Below | 0.624 | 0.500 | 0.994 | |
| High School | -0.500 | 0.271 | 0.768 | |||
| Vocational High School | -0.340 | 0.295 | 0.998 | |||
| Associate's Degree | -0.668 | 0.264 | 0.232 | |||
| Bachelor's Degree | -0.831* | 0.251 | 0.025 | |||
| Postgraduate | -0.836 | 0.284 | 0.075 |
| Factors | Effect Value | (I) Educational Status Groups | (J) Educational Status Groups | Mean Difference (I-J) | Std. Error | Significance Value |
|---|---|---|---|---|---|---|
| Material | 7.54 | High School | Primary School and Below | 0.124 | 0.457 | 0.325 |
| Elementary and Middle School | 0.500 | 0.271 | 0.768 | |||
| Vocational High School | 0.159 | 0.214 | 0.000 | |||
| Associate's Degree | -0.168 | 0.169 | 0.000 | |||
| Bachelor's Degree | -0.331 | 0.148 | 0.417 | |||
| Postgraduate | -0.337 | 0.199 | 0.870 | |||
| 7.38 | Vocational High School | Primary School and Below | 0.964 | 0.472 | 0.636 | |
| Elementary and Middle School | 0.340 | 0.295 | 0.998 | |||
| High School | -0.159 | 0.214 | 0.000 | |||
| Associate's Degree | -0.328 | 0.205 | 0.917 | |||
| Bachelor's Degree | -0.491 | 0.188 | 0.186 | |||
| Postgraduate | -0.496 | 0.230 | 0.501 | |||
| 7.70 | Associate's Degree | Primary School and Below | 0.292 | 0.453 | 0.138 | |
| Elementary and Middle School | 0.668 | 0.264 | 0.232 | |||
| High School | 0.168 | 0.169 | 0.000 | |||
| Vocational High School | 0.328 | 0.205 | 0.917 | |||
| Bachelor's Degree | -0.163 | 0.134 | 0.995 | |||
| Postgraduate | -0.168 | 0.189 | 0.000 | |||
| 7.87 | Bachelor's Degree | Primary School and Below | 0.455 | 0.445 | 0.050 | |
| Elementary and Middle School | 0.831* | 0.251 | 0.025 | |||
| High School | 0.331 | 0.148 | 0.417 | |||
| Vocational High School | 0.491 | 0.188 | 0.186 | |||
| Associate's Degree | 0.163 | 0.134 | 0.995 | |||
| Postgraduate | -0.005 | 0.170 | 0.000 | |||
| 7.87 | Postgraduate | Primary School and Below | 0.460 | 0.465 | 0.063 | |
| Elementary and Middle School | 0.836 | 0.284 | 0.075 | |||
| High School | 0.337 | 0.199 | 0.870 | |||
| Vocational High School | 0.496 | 0.230 | 0.501 | |||
| Associate's Degree | 0.168 | 0.189 | 0.000 | |||
| Bachelor's Degree | 0.005 | 0.170 | 0.000 | |||
| Quality Certification | 6.41 | Primary School and Below | Elementary and Middle School | -0.963 | 0.440 | 0.508 |
| High School | -0.165 | 0.412 | 0.143 | |||
| Vocational High School | -0.100 | 0.430 | 0.253 | |||
| Associate's Degree | -0.014 | 0.415 | 0.332 | |||
| Bachelor's Degree | -0.574 | 0.410 | 0.980 | |||
| Postgraduate | -0.037 | 0.485 | 0.000 |
Table 14. (Continue) Comparison analysis for the differences between educational status subgroups according to the factors
| Factors | Effect Value | (I) Educational Status Groups | (J) Educational Status Groups | Mean Difference (I-J) | Std. Error | Significance Value |
|---|---|---|---|---|---|---|
| Quality Certification | 7.38 | Elementary and Middle School | Primary School and Below | 0.963 | 0.440 | 0.508 |
| High School | -0.202 | 0.229 | 0.000 | |||
| Vocational High School | -0.137 | 0.260 | 0.000 | |||
| Associate's Degree | -0.051 | 0.235 | 0.000 | |||
| Bachelor's Degree | 0.390 | 0.226 | 0.849 | |||
| Postgraduate | 0.926 | 0.344 | 0.154 | |||
| 7.58 | High School | Primary School and Below | 0.165 | 0.412 | 0.143 | |
| Elementary and Middle School | 0.202 | 0.229 | 0.000 | |||
| Vocational High School | 0.065 | 0.210 | 0.000 | |||
| Associate's Degree | 0.151 | 0.178 | 0.000 | |||
| Bachelor's Degree | 0.591* | 0.165 | 0.008 | |||
| Postgraduate | 0.128* | 0.308 | 0.008 | |||
| 7.51 | Vocational High School | Primary School and Below | 0.100 | 0.430 | 0.253 | |
| Elementary and Middle School | 0.137 | 0.260 | 0.000 | |||
| High School | -0.065 | 0.210 | 0.000 | |||
| Associate's Degree | 0.086 | 0.216 | 0.000 | |||
| Bachelor's Degree | 0.527 | 0.206 | 0.209 | |||
| Postgraduate | 0.063* | 0.331 | 0.034 | |||
| Quality Certification | 7.43 | Associate's Degree | Primary School and Below | 0.014 | 0.415 | 0.332 |
| Elementary and Middle School | 0.051 | 0.235 | 0.000 | |||
| High School | -0.151 | 0.178 | 0.000 | |||
| Vocational High School | -0.086 | 0.216 | 0.000 | |||
| Bachelor's Degree | 0.440 | 0.173 | 0.212 | |||
| Postgraduate | 0.977* | 0.312 | 0.045 | |||
| 6.99 | Bachelor's Degree | Primary School and Below | 0.574 | 0.410 | 0.980 | |
| Elementary and Middle School | -0.390 | 0.226 | 0.849 | |||
| High School | -0.591* | 0.165 | 0.008 | |||
| Vocational High School | -0.527 | 0.206 | 0.209 | |||
| Associate's Degree | -0.440 | 0.173 | 0.212 | |||
| Postgraduate | 0.537 | 0.305 | 0.832 | |||
| 6.45 | Postgraduate | Primary School and Below | 0.037 | 0.485 | 0.000 | |
| Elementary and Middle School | -0.926 | 0.344 | 0.154 | |||
| High School | -0.128* | 0.308 | 0.008 | |||
| Vocational High School | -0.063* | 0.331 | 0.034 | |||
| Associate's Degree | -0.977* | 0.312 | 0.045 | |||
| Bachelor's Degree | -0.537 | 0.305 | 0.832 |
Table 14. (Continue) Comparison analysis for the differences between educational status subgroups according to the factors
| Factors | Effect Value | (I) Educational Status Groups | (J) Educational Status Groups | Mean Difference (I-J) | Std. Error | Significance Value |
|---|---|---|---|---|---|---|
| Delivery Time | 6.44 | Primary School and Below | Elementary and Middle School | -0.746 | 0.482 | 0.943 |
| High School | -0.003 | 0.450 | 0.489 | |||
| Vocational High School | -0.423 | 0.457 | 0.067 | |||
| Associate's Degree | -0.128 | 0.445 | 0.276 | |||
| Bachelor's Degree | -0.578 | 0.440 | 0.990 | |||
| Postgraduate | -0.815 | 0.485 | 0.887 | |||
| 7.19 | Elementary and Middle School | Primary School and Below | 0.746 | 0.482 | 0.943 | |
| High School | -0.256 | 0.267 | 0.000 | |||
| Vocational High School | -0.676 | 0.278 | 0.286 | |||
| Associate's Degree | -0.382 | 0.257 | 0.957 | |||
| Bachelor's Degree | 0.168 | 0.249 | 0.000 | |||
| Postgraduate | -0.069 | 0.321 | 0.000 | |||
| 7.44 | High School | Primary School and Below | 0.003 | 0.450 | 0.489 | |
| Elementary and Middle School | 0.256 | 0.267 | 0.000 | |||
| Vocational High School | -0.420 | 0.218 | 0.692 | |||
| Associate's Degree | -0.125 | 0.190 | 0.000 | |||
| Bachelor's Degree | 0.425 | 0.179 | 0.314 | |||
| Postgraduate | 0.188 | 0.271 | 0.000 | |||
| 7.86 | Vocational High School | Primary School and Below | 0.423 | 0.457 | 0.067 | |
| Elementary and Middle School | 0.676 | 0.278 | 0.286 | |||
| High School | 0.420 | 0.218 | 0.692 | |||
| Associate's Degree | 0.295 | 0.206 | 0.970 | |||
| Bachelor's Degree | 0.845* | 0.196 | 0.000 | |||
| Postgraduate | 0.608 | 0.282 | 0.505 | |||
| 7.57 | Associate's Degree | Primary School and Below | 0.128 | 0.445 | 0.276 | |
| Elementary and Middle School | 0.382 | 0.257 | 0.957 | |||
| High School | 0.125 | 0.190 | 0.000 | |||
| Vocational High School | -0.295 | 0.206 | 0.970 | |||
| Bachelor's Degree | 0.550* | 0.164 | 0.018 | |||
| Postgraduate | 0.313 | 0.261 | 0.996 | |||
| 7.02 | Bachelor's Degree | Primary School and Below | 0.578 | 0.440 | 0.990 | |
| Elementary and Middle School | -0.168 | 0.249 | 0.000 | |||
| High School | -0.425 | 0.179 | 0.314 | |||
| Vocational High School | -0.845* | 0.196 | 0.000 | |||
| Associate's Degree | -0.550* | 0.164 | 0.018 | |||
| Postgraduate | -0.237 | 0.253 | 0.000 | |||
| 7.26 | Postgraduate | Primary School and Below | 0.815 | 0.485 | 0.887 | |
| Elementary and Middle School | 0.069 | 0.321 | 0.000 | |||
| High School | -0.188 | 0.271 | 0.000 | |||
| Vocational High School | -0.608 | 0.282 | 0.505 | |||
| Associate's Degree | -0.313 | 0.261 | 0.996 | |||
| Bachelor's Degree | 0.237 | 0.253 | 0.000 |
Table 14. (Continue) Comparison analysis for the differences between educational status subgroups according to the factors
| Factors | Effect Value | (I) Educational Status Groups | (J) Educational Status Groups | Mean Difference (I-J) | Std. Error | Significance Value |
|---|---|---|---|---|---|---|
| Warranty | 6.44 | Primary School and Below | Elementary and Middle School | -0.970 | 0.549 | 0.842 |
| High School | -0.521 | 0.515 | 0.108 | |||
| Vocational High School | -0.855* | 0.517 | 0.020 | |||
| Associate's Degree | -0.591 | 0.512 | 0.074 | |||
| Bachelor's Degree | -0.265 | 0.509 | 0.313 | |||
| Postgraduate | -0.046 | 0.553 | 0.754 | |||
| 7.41 | Elementary and Middle School | Primary School and Below | 0.970 | 0.549 | 0.842 | |
| High School | -0.552 | 0.260 | 0.528 | |||
| Vocational High School | -0.885* | 0.264 | 0.020 | |||
| Associate's Degree | -0.622 | 0.254 | 0.279 | |||
| Bachelor's Degree | -0.296 | 0.246 | 0.996 | |||
| Postgraduate | -0.076 | 0.329 | 0.000 | |||
| 7.96 | High School | Primary School and Below | 0.521 | 0.515 | 0.108 | |
| Elementary and Middle School | 0.552 | 0.260 | 0.528 | |||
| Vocational High School | -0.333 | 0.183 | 0.776 | |||
| Associate's Degree | -0.070 | 0.167 | 0.000 | |||
| Bachelor's Degree | 0.256 | 0.156 | 0.890 | |||
| Postgraduate | 0.475 | 0.268 | 0.819 | |||
| 8.30 | Vocational High School | Primary School and Below | 0.855* | 0.517 | 0.020 | |
| Elementary and Middle School | 0.885* | 0.264 | 0.020 | |||
| High School | 0.333 | 0.183 | 0.776 | |||
| Associate's Degree | 0.264 | 0.174 | 0.948 | |||
| Bachelor's Degree | 0.590* | 0.163 | 0.007 | |||
| Postgraduate | 0.809 | 0.272 | 0.072 | |||
| 8.03 | Associate's Degree | Primary School and Below | 0.591 | 0.512 | 0.074 | |
| Elementary and Middle School | 0.622 | 0.254 | 0.279 | |||
| High School | 0.070 | 0.167 | 0.000 | |||
| Vocational High School | -0.264 | 0.174 | 0.948 | |||
| Bachelor's Degree | 0.326 | 0.146 | 0.419 | |||
| Postgraduate | 0.545 | 0.262 | 0.573 | |||
| 7.71 | Bachelor's Degree | Primary School and Below | 0.265 | 0.509 | 0.313 | |
| Elementary and Middle School | 0.296 | 0.246 | 0.996 | |||
| High School | -0.256 | 0.156 | 0.890 | |||
| Vocational High School | -0.590* | 0.163 | 0.007 | |||
| Associate's Degree | -0.326 | 0.146 | 0.419 | |||
| Postgraduate | 0.219 | 0.255 | 0.000 | |||
| 7.49 | Postgraduate | Primary School and Below | 0.046 | 0.553 | 0.754 | |
| Elementary and Middle School | 0.076 | 0.329 | 0.000 | |||
| High School | -0.475 | 0.268 | 0.819 | |||
| Vocational High School | -0.809 | 0.272 | 0.072 | |||
| Associate's Degree | -0.545 | 0.262 | 0.573 | |||
| Bachelor's Degree | -0.219 | 0.255 | 0.000 |
In pairwise comparison tests, no significant difference was found between the effect values of usefulness and after-sales service factors for educational status groups.
Material type is important on the purchasing decisions and the differences between the effect values of interaction groups of primary school and below - bachelor's degrees, elementary and middle school-bachelor's degree, high school-vocational high school-associate's degrees; postgraduate-associate's degree and bachelor's degrees-postgraduate are significant. The differences between the effect values of other educational groups are insignificant. According to these data, compared to the individuals in other education groups, material type is more effective in purchasing decisions of the individuals with associate degrees, bachelor’s degrees and vocational high school education levels.
Quality Certification is important on purchasing decisions and the differences between the effect values of interaction groups primary school and below-post graduate, elementary and middle school-high school-vocational high school-associate's degrees, high school-vocational high school-associate degrees-bachelor’s degrees-postgraduate, vocational high school-associate degree and associate degree-postgraduate are significant. The differences between the effect values of other education groups are insignificant. According to these data, compared to the individuals in other education groups, quality certification is more effective in purchasing decisions of the individuals with high school, vocational high school, associate degrees and elementary and middle school education levels.
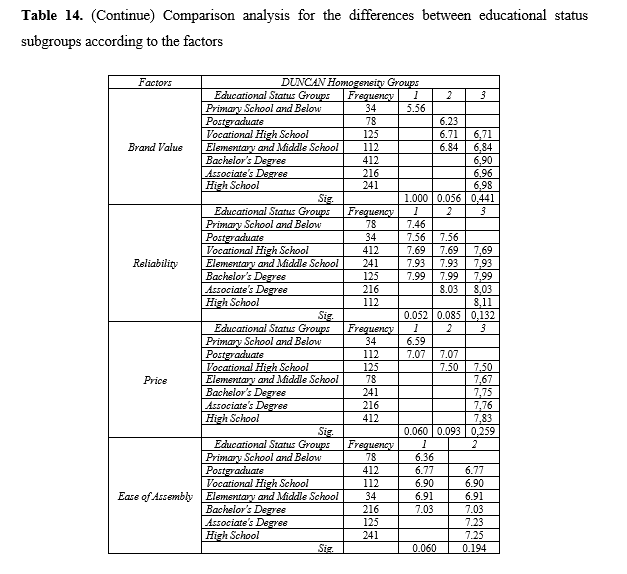
The differences between the effect values of the brand value for the individuals with bachelor’s degrees-associate degree-high school and the individuals with vocational high school-elementary and middle school are insignificant. According to these data, compared to individuals in other education groups, brand value is the most effective in purchasing decisions of the individuals at high school, associate degree and bachelor’s degree education levels, while it is least effective in the individuals with primary school and below education level.
While reliability is the most effective in purchasing decision of high school graduates, it is followed by associate degrees at second and vocational high school, elementary and middle school and bachelor’s degrees equally at third. The education group in which safety has the least effect on the purchase decision has been the individuals with primary school and below education level.
While price is the most effective in purchasing decisions of elementary and middle school, bachelor’s degrees, associate degrees and high school graduates, it is followed by vocational high school, postgraduate and primary school and below individuals, respectively.
Ease of assembly is most effective in purchasing decisions of the individuals with associate degrees and high school graduates, followed by the individuals with postgraduate, vocational high school, elementary and middle school and bachelor’s degrees. Ease of assembly has the lowest effect on the individuals with primary school education and below.
The differences between effect values of delivery time for elementary and middle school- bachelor’s degrees, high school-elementary and middle school-postgraduate, vocational high school-bachelor’s degrees, the associate degrees-high school-bachelor’s degrees, postgraduates-elementary and middle school-bachelor’s degrees, associate-undergraduate degree, undergraduate-graduate degree education levels are significant. The differences between other education levels are insignificant. According to these data, compared to the individuals in other education groups, delivery time is more effective in purchasing decisions of the individuals with vocational high school, high school and associate degree education levels.
The differences between effect values of warranty for vocational high school education-elementary and middle school-bachelor’s degrees, bachelor’s degrees-postgraduates, postgraduates-elementary and middle school education levels are significant. The differences between effect values of other education levels are insignificant. According to these data, compared to the individuals at other education levels, warranty is more effective in purchasing decisions of the individuals at vocational high school, associate degrees and high school education levels.