Search results
Our search strategy identified 2,307 articles. After removing the duplicates and clearly irrelevant studies, full texts of 103 studies were assessed for eligibility. Fourteen studies reported the outcomes of interest for RVD in patients with ARDS.[15–28] Nine studies with a total of 1,861 patients were included for the final analysis as shown in Fig. 1.[16, 19–21, 23, 24, 26–28]
Baseline Characteristics
All articles were published between 2009 and 2018. Six studies were conducted in Europe,[16, 19–21, 23, 28] one in the United States, [27] and two in Asia, [24] [26]. Five were prospective observational studies,[20, 21, 24, 26, 28] two were retrospective studies,[16, 19] and two were the post-hoc analysis of a previously conducted randomized controlled trial.[23, 27] (Table 1) Inclusion and exclusion criteria for the studies are shown in Supplementary Table 2. The risk of bias for the included studies was evaluated using a modified version of the Newcastle-Ottawa Scale, as shown in Table 3.
Table 1
Characteristics of each study.
|
Authors
|
Country
|
Sample size
|
Setting
|
Study period
|
Definition of ARDS
|
Definition of RVD
|
Mortality
|
|
Osman /
2009
|
France
|
145
|
Multi-center, post-hoc analysis of RCT.
|
January 1999 – June 2001
|
American-European consensus conference
|
(1) MPAP > 25 mmHg, (2) CVP > PAOP, and (3) SVI < 30 mL/m2, based on PAC.
|
28-day
|
|
Bull / 2010
|
United States
|
367
|
Post-hoc analysis of multicenter randomized controlled trial
|
June 2000 – Oct 2005
|
American-European consensus conference
|
CVP > PAOP
|
60-day
|
|
Fichet 2012
|
France
|
50
|
Single-center, prospective
|
Not reported
|
American-European consensus conference
|
TAPSE < 12mm or St < 11.5cm/sec
|
ICU
|
|
Legras /
2015
|
France
|
166
|
Multi-center, prospective
|
November 2009
-June 2012
|
American-European consensus conference
|
RVEDA/LVEDA ratio > 0.6 associated with systolic paradoxical ventricular septal motion by TTE or TEE.
|
28-day
|
|
Lazzeri / 2016
|
Italy
|
74
|
Single-center, retrospective
|
October 2009 – December 2013
|
Berlin definition. All included patients underwent VV-ECMO.
|
RVEDA/LVEDA ratio > 0.6 by TTE or TEE.
|
ICU
|
|
Mekonstso Dessap /
2016
|
France
|
752
|
Multi-center, prospective
|
1994–2012
|
Berlin definition
(Although the study was initiated begore 2011, all met the Berlin definition.)
|
RVEDA/LVEDA ratio > 0.6 associated with septal dyskinesia by TEE.
|
In-hospital
|
|
See / 2017
|
Singapore
|
234
|
Single-center, prospective
|
September 2012 – May 2014
|
Berlin definition
|
RVEDA/LVEDA ratio ≥ 1 by TTE.
|
In-hospital
|
|
Bonizzoli / 2018
|
Italy
|
28
|
Single-center, retrospective
|
January 2016 – June 2017
|
Berlin definition
|
RV strain free wall < 20%.
|
ICU
|
|
Zeiton / 2018
|
Egypt
|
45
|
Single-center, prospective
|
June 2016 – December 2016
|
Berlin definition
|
RVEDA/LVEDA ratio > 0.6 associated with septal dyskinesia by TTE.
|
28-day
|
| RV: right ventricle / right ventricular |
| RVD: right ventricular dysfunction |
| TAPSE: tricuspid annular plane systolic excursion |
| St: peak systolic velocity at the tricuspid valve |
| ACP: acute cor pulmonale |
| VV-ECMO: veno-venous extracorporeal membrane oxygenation |
| MPAP: mean pulmonary artery pressure |
| TTE: transthoracic echocardiography |
| TEE: transesophageal echocardiography |
| RCT: randomized controlled trial |
| PAC: pulmonary artery catheter |
| MPAP: mean pulmonary artery occlusion pressure |
| CVP: central venous pressure |
| PAOP: pulmonary artery occlusion pressure |
| SVI: stroke volume index |
Table 2
The characteristics of included patients.
|
Authors
|
Age
|
Male (%)
|
Fluid in 24 hours (ml)
|
Vasopressors
|
Mechanical ventilation
|
P/F ratio
|
PEEP
(cmH2O)
|
Plateau pressure (cmH2O)
|
Compliance
(mL/cmH2O)
|
LV function
|
SAPS II
|
Causes of ARDS
|
|
Osman /2009
|
RVD/ACP (+)
|
64 (13)
|
35.7 % (5/14)
|
---
|
78.6 % (11/14)
|
100 % (14/14)
|
115 (26)
|
6 (4)
|
28 (6)
|
23 (5)
|
SVI: 23 (3)
(mL/m2)
|
55 (25)
|
Extra-pulmonary ARDS (1/14)
Other etiologies were not reported.
|
|
RVD/ACP (-)
|
60 (16)
|
70.2 % (92/131)
|
---
|
76.3 % (100/131)
|
100 % (131/131)
|
98 (35)
|
7 (4)
|
25 (6)
|
32 (10)
|
SVI: 36 (12)
(mL/m2)
|
50 (19)
|
Extra-pulmonary ARDS (29/131)
Other etiologies were not reported.
|
|
Bull / 2010
|
RVD/ACP (+)
|
50 †
|
55.2% †† (262/475)
|
---
|
36.4% ††
(173/475)
|
100% (44/44)
|
160 †
|
9.3 †
|
26.2 †
|
---
|
Survived: CI: 4.5 (1.4)
Died: CI; 4.4 (1.6)
|
APACHE III: 94.3
|
Not reported.
|
|
RVD/ACP (-)
|
---
|
100% (323/323)
|
---
|
|
Fichet / 2012
|
RVD/ACP (+)
|
60 (42–72)
|
67.9% (19/28)
|
4000
(3000–6000)
|
53% (8/15)
|
100% (28/28)
|
100
(82–117)
|
10
(8–11)
|
28
(26–30)
|
---
|
49.5 (36–62)
|
50 (38–55)
|
Pneumonia (21/50)
Non-pulmonary sepsis (8/50)
Aspiration pneumonia (3/50)
Other shock (4/50)
Drug-induced ARDS (3/50)
Others (11/50)
|
|
RVD/ACP (-)
|
51 (37–65)
|
50.0 % (9/18)
|
4000
(2000–6000)
|
45% (16/35)
|
100% (18/18)
|
122
(86–150)
|
8
(8–10)
|
24
(20–28)
|
---
|
63 (55–66)
|
46 (35–62)
|
|
Legras / 2015
|
RVD/ACP (+)
|
56 (15)
|
---
|
---
|
50.0 % (18/36) *
|
100 % (36/36) *
|
112
(91 = 154)
|
10 (8–14) **
|
---
|
---
|
CI: 2.9 (2.6–3.4) **
(L/min/m2)
|
46 (17)
|
Pneumonia (62%)
No other etiologies were reported.
|
|
RVD/ACP (-)
|
|
---
|
---
|
47.7 % (62/130) *
|
100 % (130/130) *
|
114
(72–145)
|
11 (8–12) **
|
---
|
---
|
CI: 3.2 (2.6-4.0) **
(L/min/m2)
|
|
Lazzeri / 2016
|
RVD/ACP (+)
|
57 (14)
|
70.6 % (12/17)
|
---
|
64.7 % (11/17)
|
100 % (17/17)
|
---
|
---
|
---
|
---
|
---
|
44 (19)
|
H1N1 influenza (23/74)
H3N2 (2/74)
Viral pneumonia (8/74)
Bacterial pneumonia (43/74) ***
|
|
RVD/ACP (-)
|
50 (15)
|
73.7 % (42/57)
|
---
|
45.6 % (26/57)
|
100 % (57/57)
|
---
|
---
|
---
|
---
|
---
|
|
Mekontso Dessap /
2016
|
RVD/ACP (+)
|
57 (16)
|
63.4 % (104/164)
|
---
|
68.,9 % (113/164)
|
100 % (164/164)
|
106 (40)
|
8 (4)
|
26 (5)
|
28 (11)
|
---
|
50 (19)
|
Pneumonia (93/164)
Aspiration pneumonitis (16/164)
Non-pulmonary sepsis (34/164)
Others (17/164)
|
|
RVD/ACP (-)
|
58 (17)
|
68.5 % (403/588)
|
---
|
66.2 % (389/588)
|
100 % (588/588)
|
118 (42)
|
8 (4)
|
24 (4)
|
32 (12)
|
---
|
54 (21)
|
Pneumonia (200/588)
Aspiration pneumonitis (75/588)
Non-pulmonary sepsis (228/588)
Others (73/588)
|
|
See / 2017
|
RVD/ACP (+)
|
65 (13)
|
65.2 % (43/66)
|
---
|
33.3 % (22/66)
|
89.4 % (59/66)
|
169 (63)
|
7 (3)
|
21 (5)
|
34 (18)
|
LVEF < 40% (10/66)
|
APACHE II: 27 (9)
|
Pneumonia (57/66)
Non-pulmonary sepsis (9/66)
|
|
RVD/ACP (-)
|
62 (15)
|
61.3 % (103/168)
|
---
|
32.7 % (55/168)
|
88.1 % (148/168)
|
172 (69)
|
6 (3)
|
21 (2)
|
29 (12)
|
LVEF < 40% (28/168)
|
APACHE II: 27 (8)
|
Pneumonia (151/168)
Non-pulmonary sepsis (17/168)
|
|
Bonizzoli / 2018
|
RVD/ACP (+)
|
58 †
|
53.3 % (16/30)
|
---
|
---
|
100% (3/3)
|
107 †
|
12.7 †
|
---
|
---
|
54.9% †
|
43.2 †
|
Viral pneumonia (7/30)
Bacterial pneumonia (23/30)
|
|
RVD/ACP (-)
|
---
|
---
|
100% (25/25)
|
---
|
---
|
|
Zeiton / 2018
|
RVD/ACP (+)
|
39 (14)
|
30.0 % (3/10)
|
---
|
100% (10/10)
|
100 % (10/10)
|
77 (13)
|
14 (1)
|
40 (7)
|
---
|
---
|
---
|
Pneumonia (9/10)
Other causes of ARDS were unclear.
|
|
RVD/ACP (-)
|
49 (15)
|
48.6% (17/35)
|
---
|
74.3 % (26/35)
|
100 % (35/35)
|
151 (61)
|
11 (2)
|
32 (10)
|
---
|
---
|
---
|
Pneumonia (17/35)
Other causes of ARDS were unclear.
|
| *: The numbers were described for patients with only ACP or without ACP and PFO (Patients with only PFO or with PFO and ACP were excluded). |
| **: The value was reported as median with interquartile range. |
| ***: The summation of each number did not fit the reported total number. |
| †: The standard deviation could not be calculated |
| ††: The numbers and percentages are per total population included in the study but not all patients were evaluated for RVD/ACP. Therefore, the total numbers were different from actually analyzed number of patients. |
Table 3
Newcastle-Ottawa Scale assessment of pooled studies.
|
Study
|
Selection
|
Comparability
|
Outcomes
|
Total
|
|
Representativeness of exposed cohort
|
Selection of nonexposed cohort
|
Ascertainment of exposure
|
Outcome not present at the start of the study
|
|
Assessment of outcomes
|
Length of follow-up
|
Adequacy of follow-up
|
|
|
Osman / 2009
|
*
|
*
|
*
|
*
|
--- †
|
*
|
*
|
*
|
7
|
|
Bull / 2010
|
*
|
*
|
*
|
*
|
---
|
*
|
*
|
*
|
7
|
|
Fichet / 2012
|
*
|
*
|
*
|
*
|
---
|
*
|
*
|
*
|
7
|
|
Legras / 2015
|
*
|
*
|
*
|
*
|
---
|
*
|
*
|
*
|
7
|
|
Lazzeri / 2016
|
*
|
*
|
*
|
*
|
---
|
*
|
*
|
*
|
7
|
|
Mekontso Dessap / 2016
|
*
|
*
|
*
|
*
|
**
|
*
|
*
|
*
|
9
|
|
See / 2017
|
*
|
*
|
*
|
*
|
**
|
*
|
*
|
*
|
9
|
|
Bonizzoli / 2018
|
*
|
*
|
*
|
*
|
---
|
*
|
*
|
*
|
7
|
|
Zeiton / 2018
|
*
|
*
|
*
|
*
|
---
|
*
|
*
|
*
|
7
|
| †: Although multivariate analysis was performed, it was not for 28-day mortality (it was for 90-day mortality). |
The mean/median age of included patients ranged from 41 to 62, and 44.4–73% were males. Mean/median Simplified Acute Physiology Score II score ranged from 43–50 (patients with RVD: 47–55, patients without RVD: 43–54). In included population, 98.5% (1,834/1,861), and 55.3% (1,030/1,861) received mechanical ventilation, and vasopressors, respectively. Eight of nine studies reported mean/median positive end-expiratory pressure (PEEP) level (range: 7 to 12.7 cmH2O) and P/F ratio (range: 99–171) when patients were evaluated for RVD. Plateau pressure was reported in 6 studies and it ranged from 21 to 33.6 cmH2O. (Table 2) The definition of RVD used in each study is reported in Table 1.
Outcomes
RVD was present in 21.0% (391/1,861) of the cohort. In the pooled meta-analysis of 9 studies, the presence of RVD in patients with ARDS was associated with a significantly higher overall mortality (OR: 1.45, 95%CI: 1.13–1.86, p-value = 0.003, I2 = 0%), as shown in Fig. 2. In subgroup analysis investigating short-term and long-term mortalities, the presence of RVD in patients with ARDS was associated with significantly higher short-term mortality (OR: 1.48, 95%CI: 1.14–1.93, p-value = 0.003, I2 = 0%), while the association was not significant in long-term mortality (OR: 1.24, 95%CI: 0.66–2.33, p-value = 0.003, I2 = 0%), as shown in Supplementary Fig. 2.
In the pooled analysis of 3 studies that investigated adjusted odds ratio of mortality, the presence of RVD was associated with a significantly higher mortality (OR: 1.95, 95%CI: 1.30–2.93, p-value = 0.001, I2 = 0%), as shown in Supplementary Fig. 2. Although Lazzeri et al. reported OR for ICU-mortality using a stepwise regression analysis adjusting for TAPSE < 16mm, we did not include this study in the pooled analysis of studies investigated adjusted OR because this was not a multivariate analysis adjusting for risk factors of ICU-mortality.
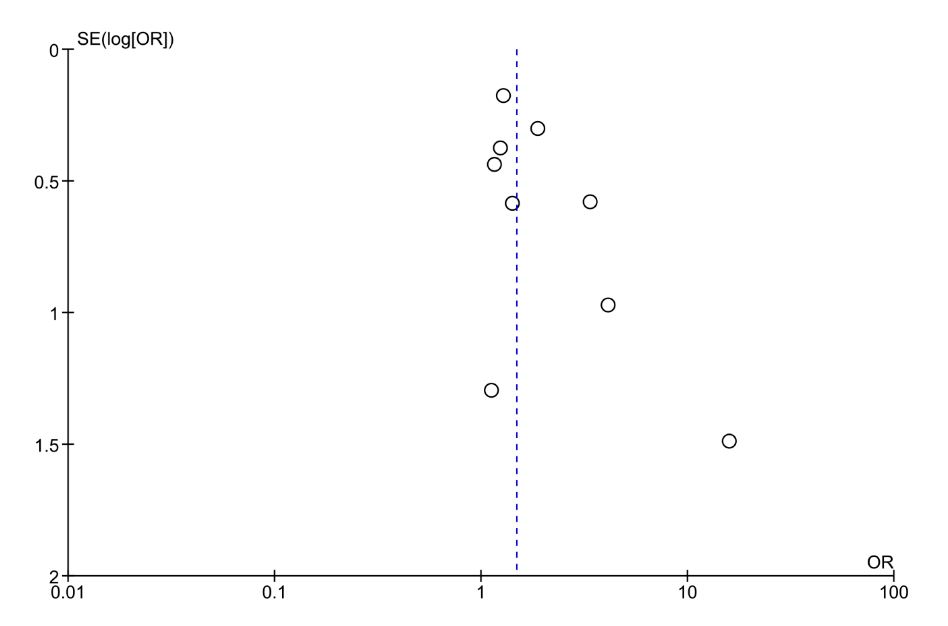
We detected no evidence of publication bias when we assessed the funnel plots visually, as shown in Supplementary Fig. 2. We also statistically assessed publication bias using Egger’s regression test and found no publication bias (p-value = 0.080).