A phreatic eruption is a hazardous volcanic activity event that includes sporadic ejections of volcanic ash, steam and volcanic gases induced by transient pressure changes in the hydrothermal systems of active volcanoes. These episodic pressure changes are generally induced by injections of volcanic gases into a confined shallow hydrothermal system or by the abrupt boiling of confined overheated geothermal water due to sudden depressurization (Jolly et al. 2014; Narita and Murakami 2018). In general, phreatic eruptions cause less damage than magmatic eruptions, but can occasionally produce destructive hazards such as lahars that wash out infrastructure (e.g., Naranjo et al. 1986). An abrupt eruption can be a potential risk to tourists who are visiting volcanoes for mountaineering in the summer and skiing in the winter.
Ground deformation of active volcanoes is usually helpful for interpreting the physical processes of volcanic activity; however, most of ground deformation associated with phreatic eruptions is characterized as small and localized ones with a sudden onset. These characteristics hinder the detection of plausible deformation signals prior to phreatic eruptions due to sparse observation networks or limited measurement accuracy. Recently, satellite synthetic aperture radar (SAR) data have allowed us to identify displacement fields with high spatial resolution without ground-based instruments. Several studies have successfully detected coeruptive deformation associated with phreatic eruptions using satellite SAR data (e.g., Hamling 2017; Doke et al. 2018; Narita and Murakami 2018). If precursors of phreatic eruptions, such as overpressure in shallow hydrothermal systems, persist for a long time, satellite SAR data can identify the precursory deformation signals of a phreatic eruption (Kobayashi et al. 2018).
Kusatsu-Shirane volcano is an active volcanic complex located in central Japan (Figure 1). It comprises Yugama crater lake, Ainomine volcano, and Moto-Shirane volcano, which are aligned in the north–south direction (Figure 1). Two subvertical seismicity clusters have been identified 500–2000 m beneath both Yugama crater lake and Ainomine volcano, but not beneath Moto-Shirane volcano (Mori et al. 2006; Japan Meteorological Agency (JMA) 2019). Recent eruptions of Kusatsu-Shirane volcano in 1976, 1982-1983, and 1989 at Yugama crater lake have all been phreatic eruptions (e.g., Ossaka et al. 1980; Ida et al. 1989; Ossaka et al. 1997; Ohba et al. 2008).
The most recent eruption of Kusatsu-Shirane volcano began on January 23, 2018, at 10:02 (Japan Standard Time: JST) at the Kagamiike-kita pyroclastic cone on Moto-Shirane volcano (Figure 1). This eruption was characterized by an ejection of volcanic ash, steam, and gases. The amount of discharged mass was approximately 30000-50000 tons and the eruption plume reached a height of over 5000 m, as observed by a meteorological radar (The Joint Research Team for ash fall in Kusatsu-shirane 2018 eruption 2018). No plume or gas ejection have been observed since February 22, 2018 (JMA 2018a). Volcanic tremors began 3 minutes before the phreatic eruption (09:59 JST) and volcanic earthquakes had mostly ceased by March 2018 (JMA 2018b). Airborne SAR images identified a WNW–ESE striking (approximately N105ºE–N110ºE) eruptive crater on the northern part of the Kagamiike-kita pyroclastic cone generated by the 2018 eruption (Geospatial Information Authority of Japan (GSI) 2018a). The maximum depth of the crater was greater than 15 m (The University of Tokyo and Asia Air Survey Co.,LTD 2018). The strike of the eruptive crater was nearly perpendicular to the distribution axis of the pyroclastic cones on Kusatsu–Shirane volcano. The airborne SAR images observations also identified other WNW–ESE striking craters that crossed other pyroclastic cones on Moto–Shirane volcano.
Some research institutes have reported conventional interferometric SAR (InSAR) data for the coeruptive ground deformation associated with the 2018 phreatic eruption (GSI 2018; Meteorological Research Institute 2018). However, some InSAR data were contaminated by decorrelation noises due to variations in the back-scatter characteristics on the ground, such as snow and volcanic tephra coverage. Here, we investigate both the coeruptive and posteruptive deformation signals associated with the 2018 Kusatsu-Shirane phreatic eruption by applying SAR time series analyses to L-band SAR data. We also propose a schematic model that explains the extracted coeruptive deformation.
SAR data processing
In this study, we employed L-band SAR data acquired from the Phased Array type L-band SAR 2 (PALSAR-2) sensor onboard the Advanced Land Observation Satellite 2 (ALOS-2) to detect crustal deformation signals on Kusatsu-Shirane volcano (Additional file 1; Table S1). The L-band microwaves (wavelength: 23.6 cm) that PALSAR-2 uses are suitable for monitoring deformation signals on volcanoes covered by dense vegetation, such as those in Japan. In general, decorrelation problems can be caused by variations in scattering characteristics on the ground such as snow coverage or dense vegetation. Shorter-wavelength microwaves, such as C-band (wavelength: 5.6 cm) and X-band (wavelength: 3.1 cm) microwaves, scatter on shallower parts of the snow/ice layer and on leaves or branches. Thus, we expect shorter-wavelength microwaves to suffer from decorrelation problems in this case. In contrast, longer-wavelength microwaves, such as the L-band microwave, can penetrate deeper parts of a snow/ice layer and through dense vegetation. The region around Kusatsu-Shirane volcano is covered by dense vegetation in the summer and by snow in the winter (Additional file 1; Figure S1).Although the recurrent period of the ALOS-2 satellite (14 days) is greater than that of recent SAR constellations, such as Sentinel-1 (6 days) and Cosmo-SkyMed (1 day at a minimum), coherence using PALSAR-2 data tends to sustain, even with a temporal baseline for the PALSAR-2 InSAR greater than one year. Thus, we expect that the PALSAR-2 data are suitable for extracting deformation signals around Kusatsu-Shirane volcano through the year.
All InSAR data were generated using the GAMMA software (Wegmüller and Werner 1997). We corrected the topography-dependent fringes using a 10 m mesh digital elevation model released by GSI. Tropospheric artifacts were corrected using zenith tropospheric delays provided by the Generic Atmospheric Correction Online Service for InSAR (GACOS; Yu et al. 2017; Yu et al. 2018). Long-wavelength signals across the InSAR data were corrected by fitting 2D polynomial functions. We discarded some PALSAR-2 data that were contaminated by strong ionospheric artifacts.
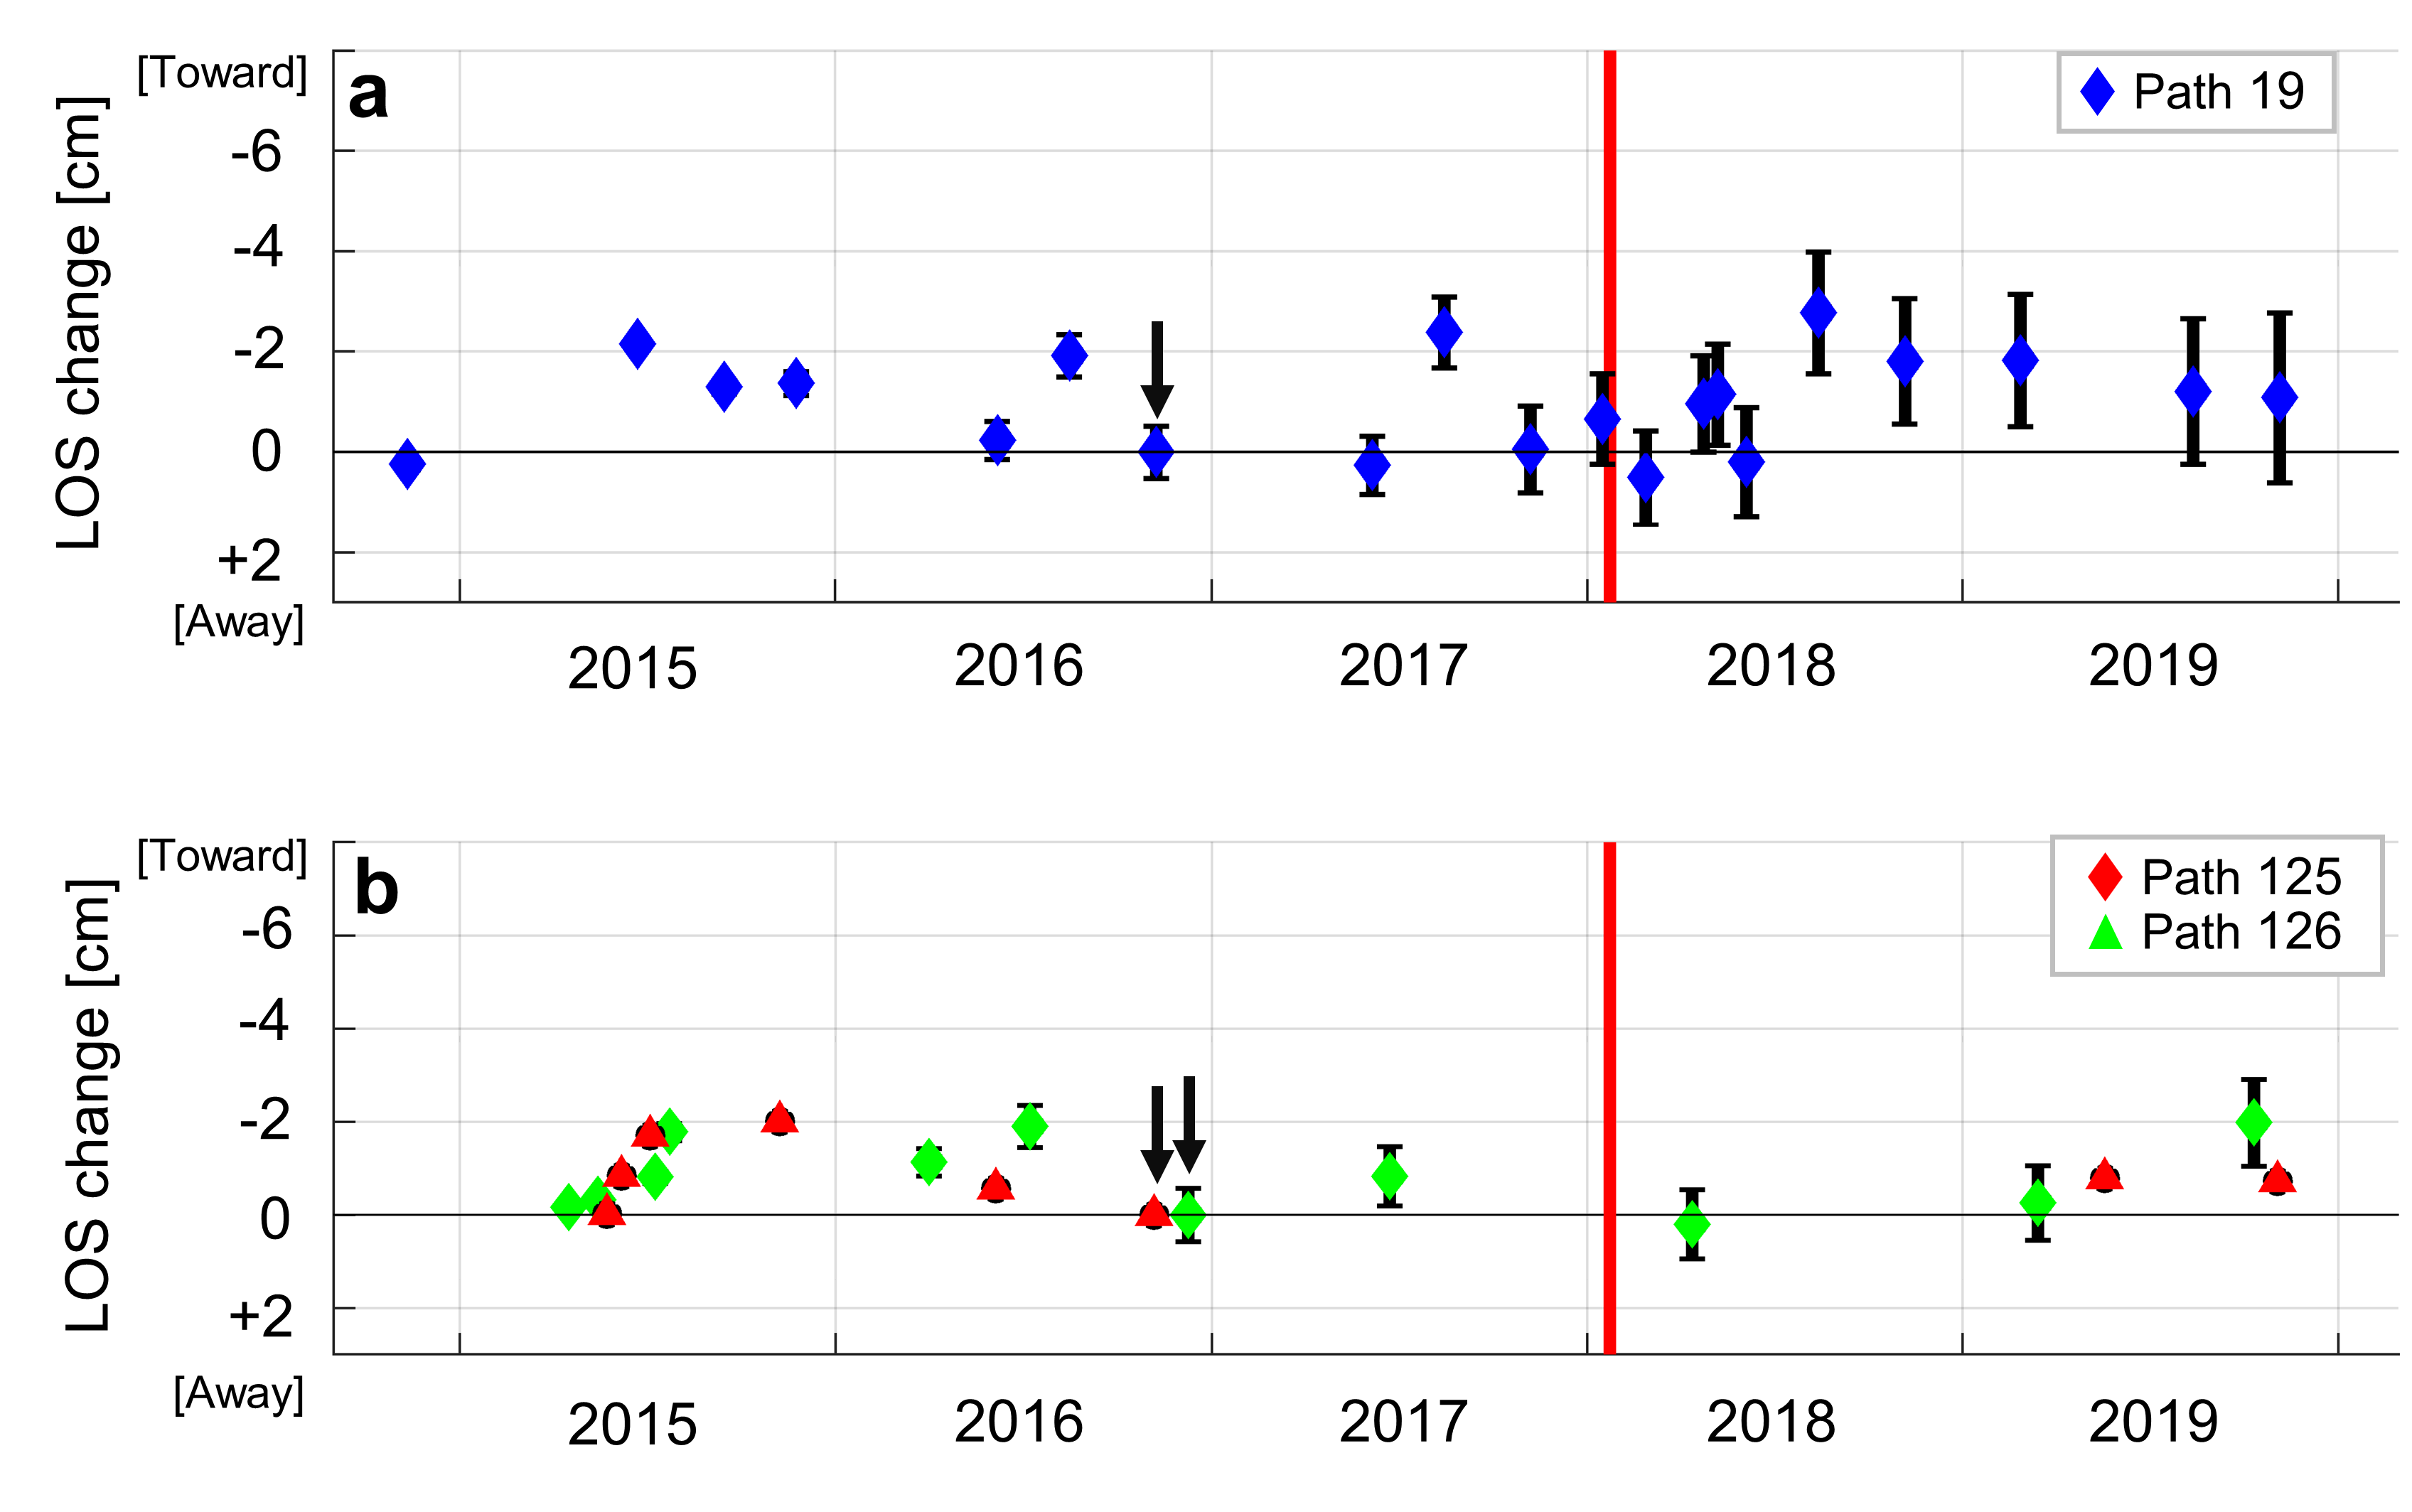
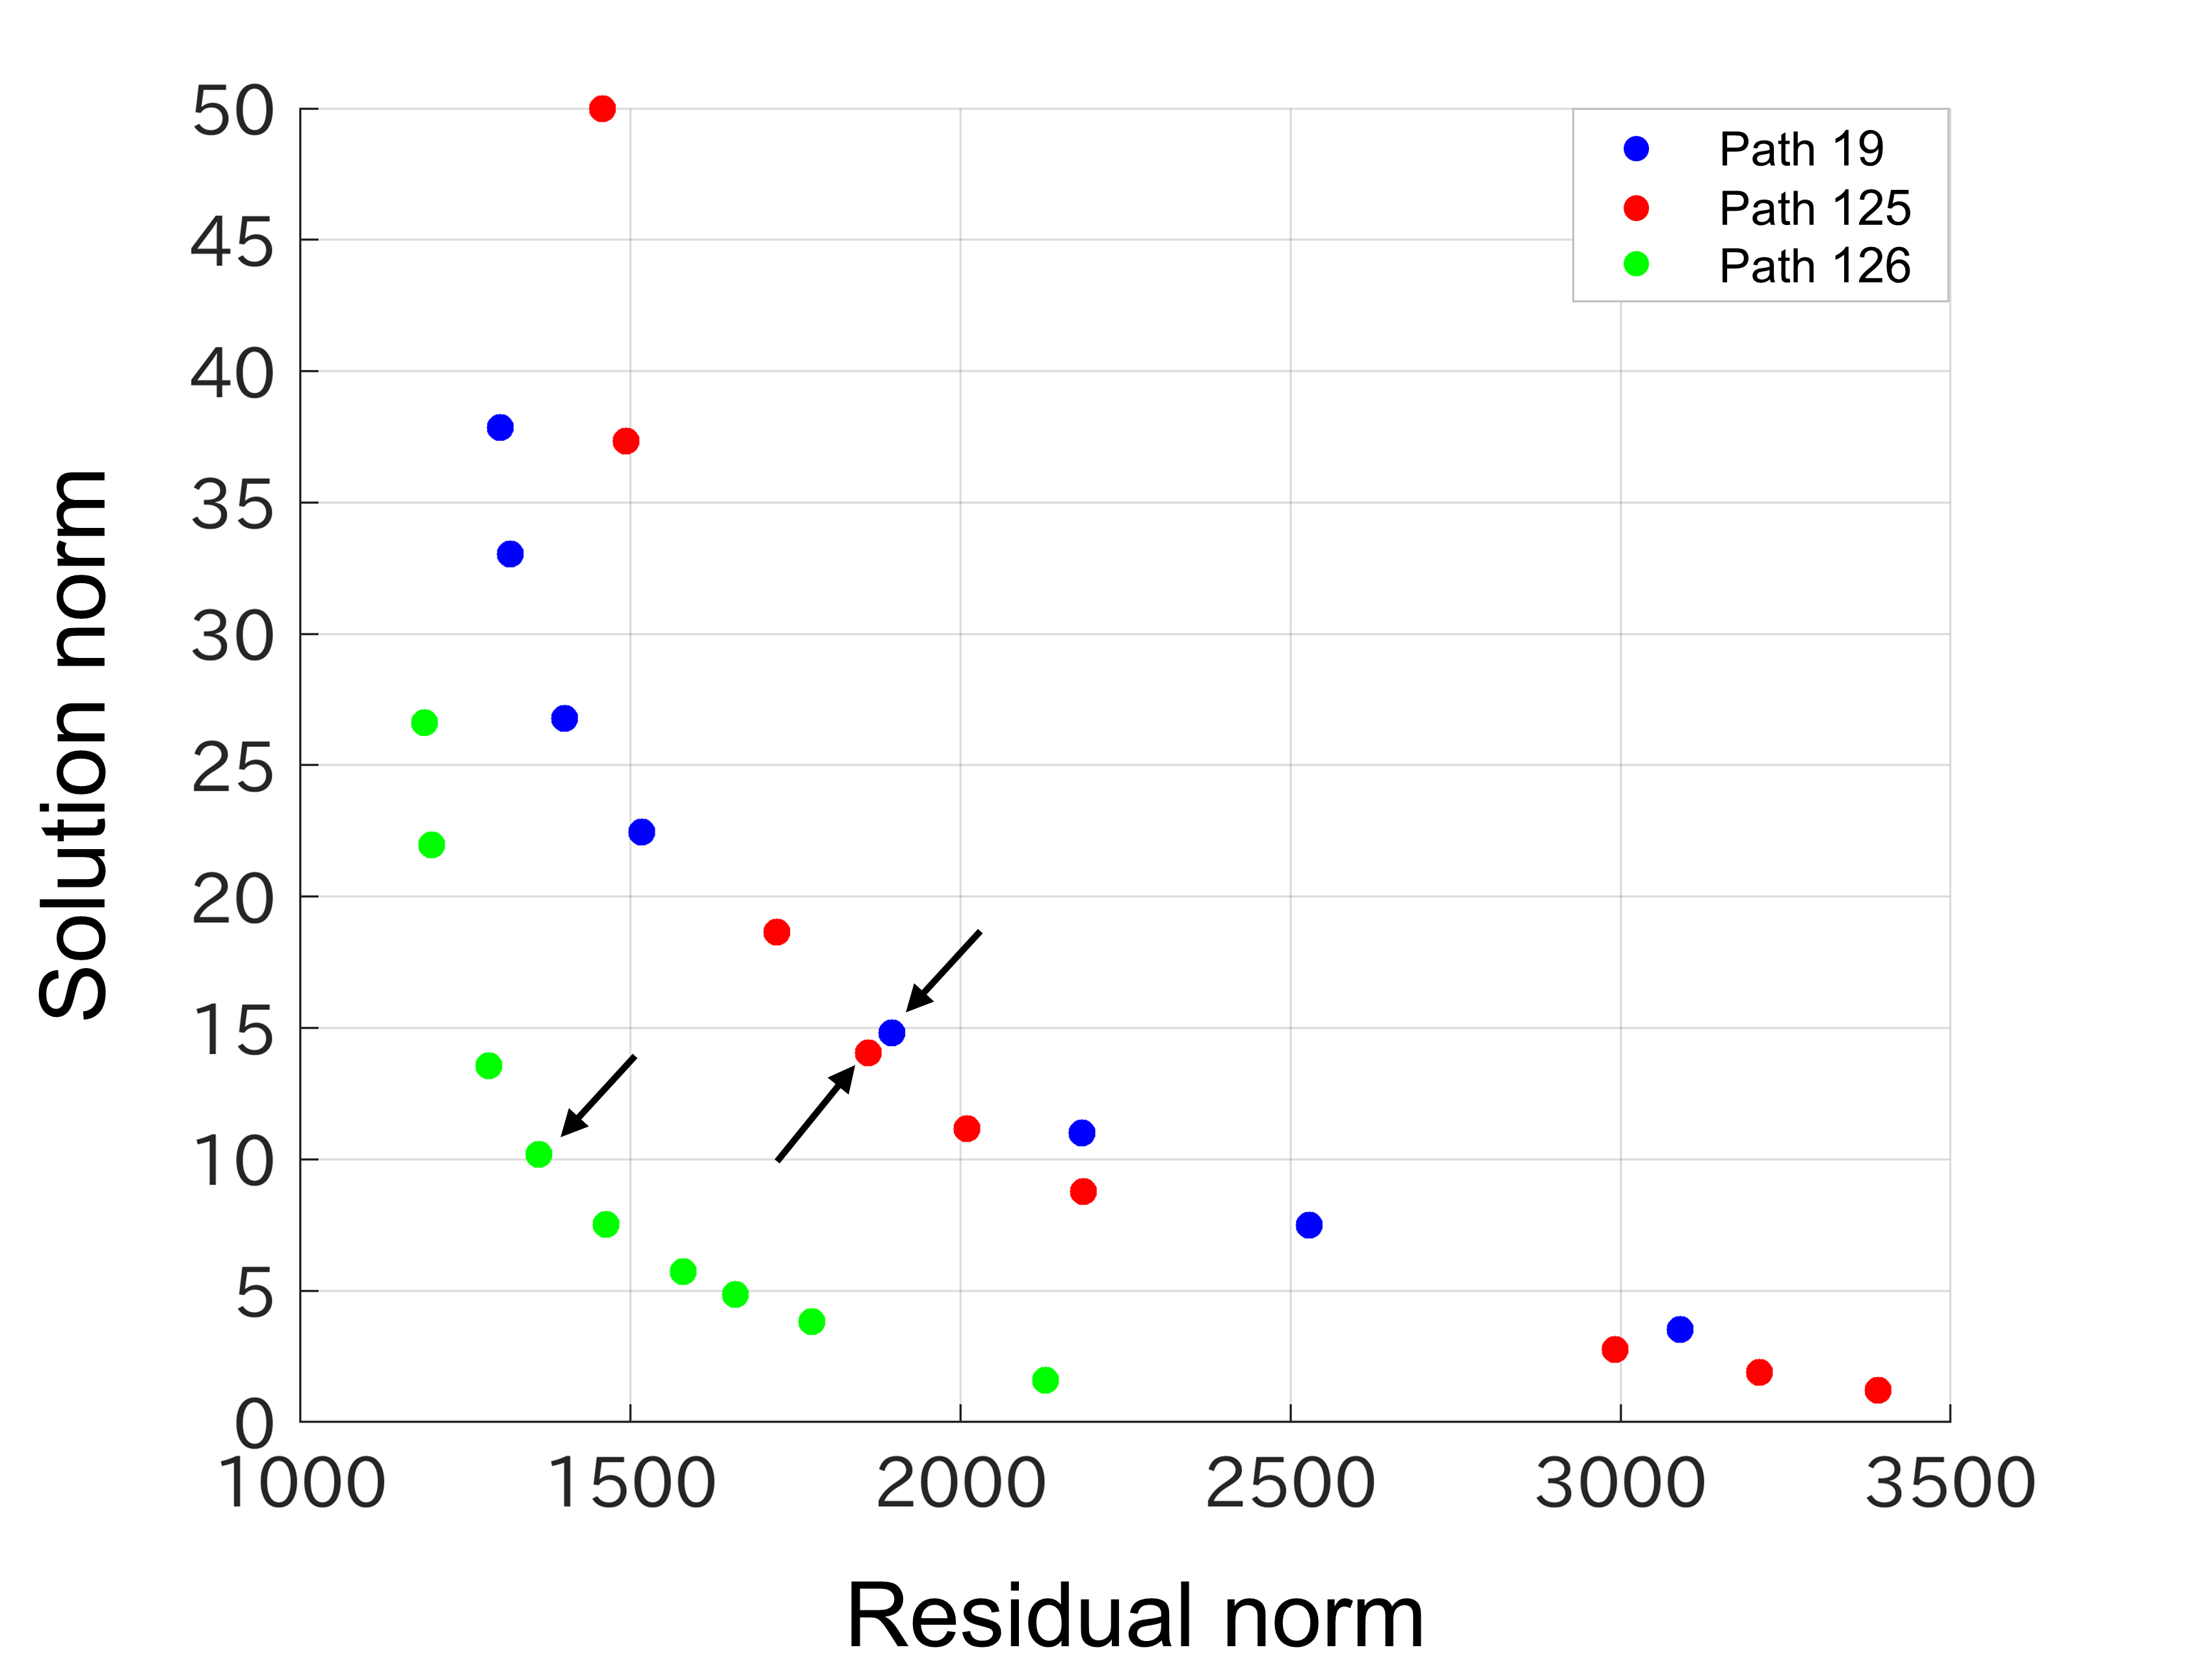
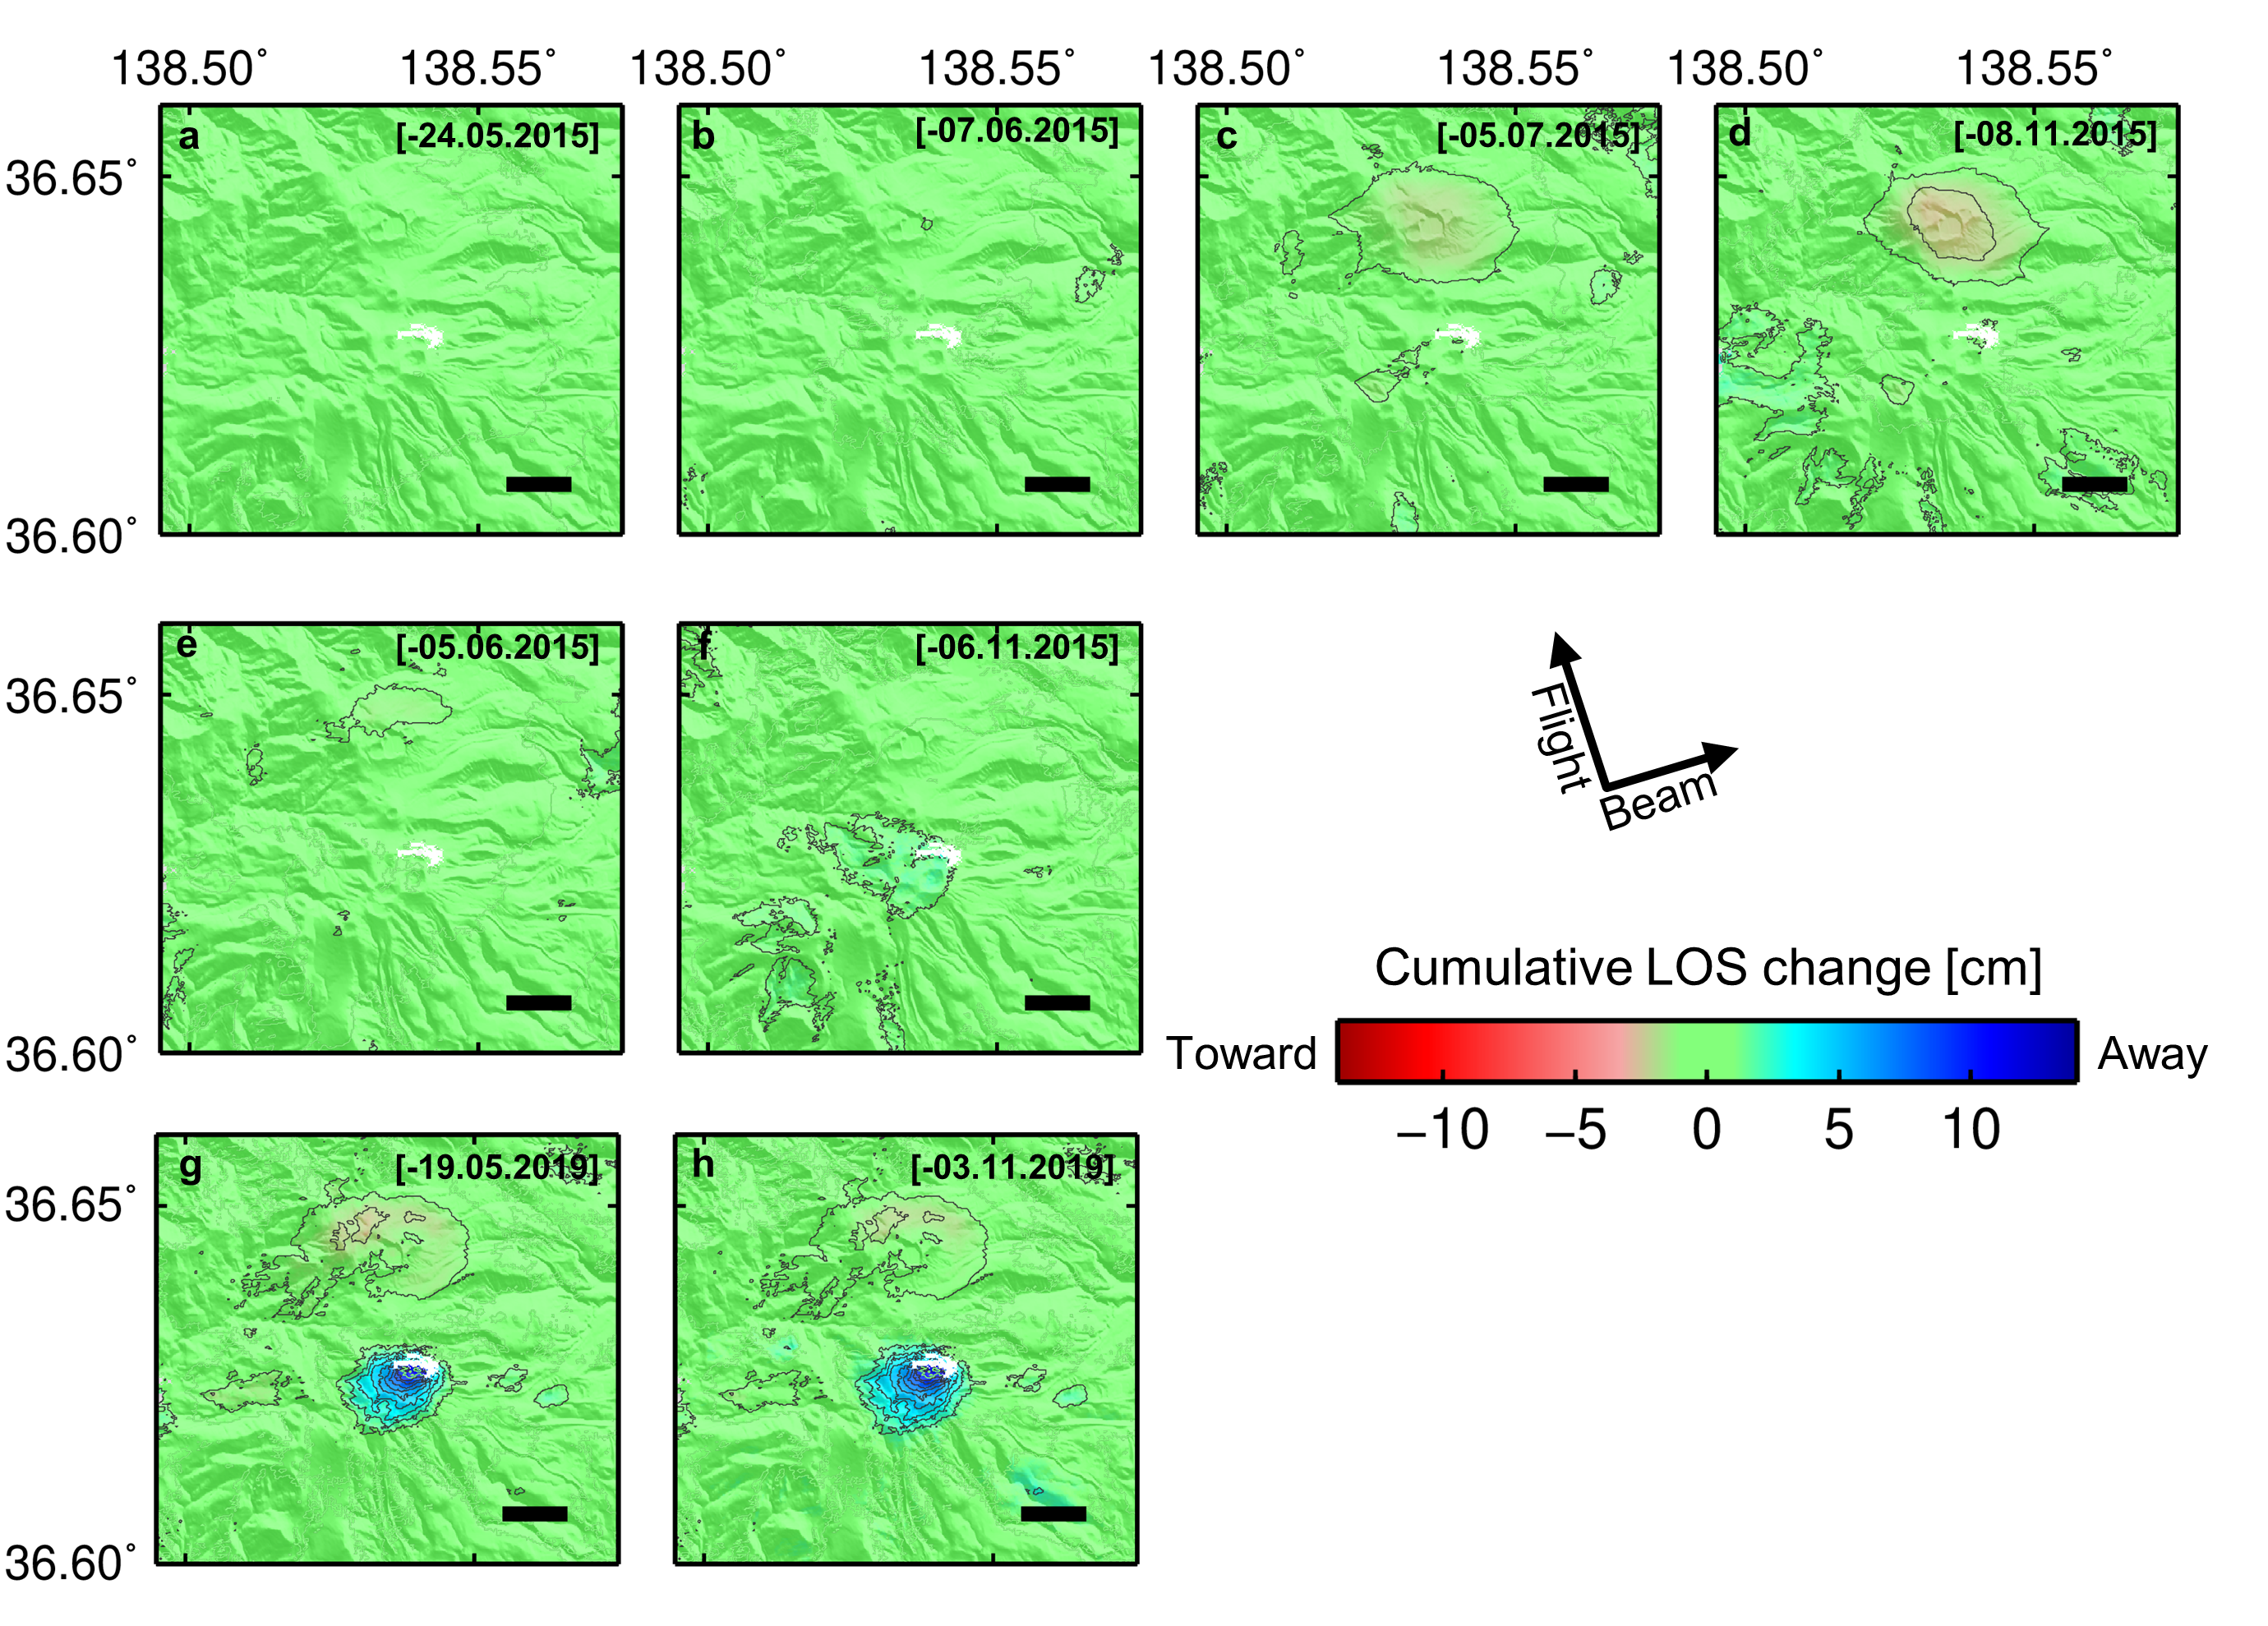
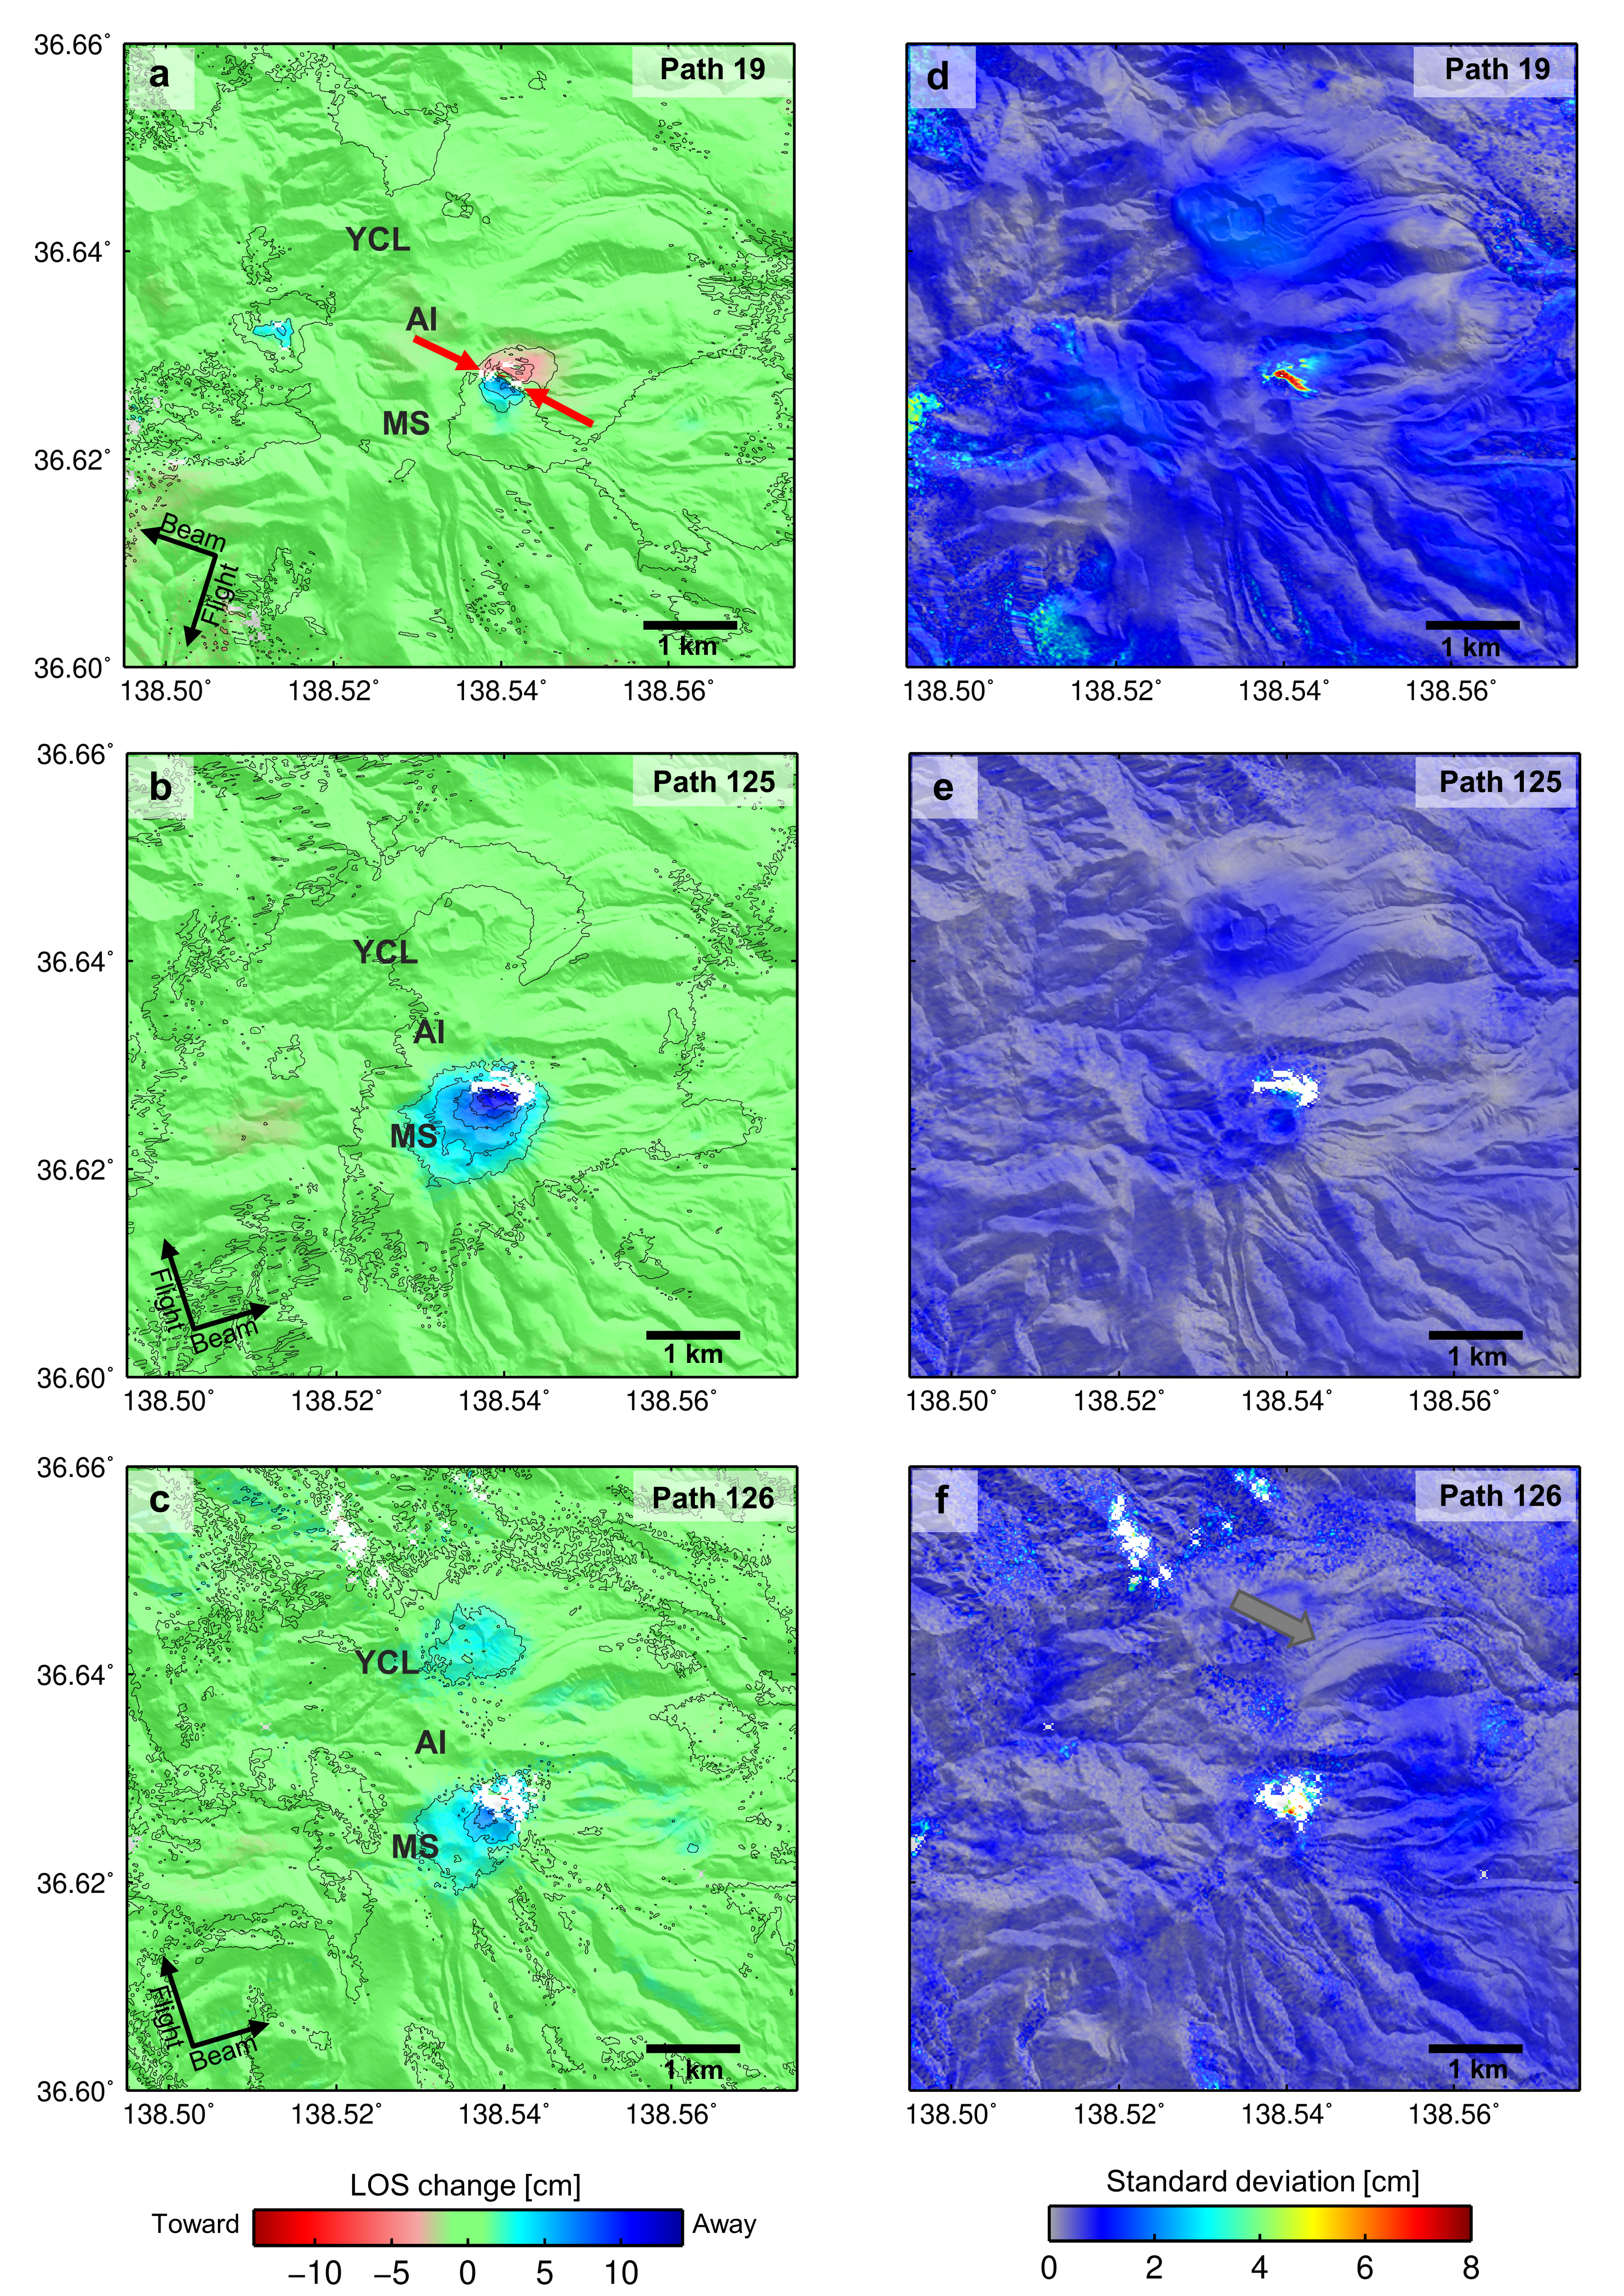
We employed a multi-temporal InSAR (MTI) analysis, one of the SAR time-series analyses, to infer spatiotemporal variations in the crustal deformation at Kusatsu-Shirane volcano (e.g., Schmidt and Bürgmann 2003). The MTI analysis infers mean displacement rates during each image acquisition interval using the InSAR data with various temporal baselines, assuming constant displacement rates during each image acquisition interval. Figure S2 in Additional file 1 shows a plot of the perpendicular baselines and SAR data combinations for the MTI analysis. We did not set the criteria for spatial and temporal baselines in estimating the displacement time-series, unlike the small baseline subset approach (Berardino et al. 2002). One reason for this is that L-band SAR data tend to avoid decorrelation problems even when using a pair of SAR images with a temporal baseline of more than one year. Another reason is that the ALOS-2 satellite has been operating within 500 m of the perpendicular baseline since the satellite was launched. The Laplacian operators for the smoothing temporal variations in line-of-sight (LOS) changes were optimized using the L-curve criterion (e.g., Hansen 1992; Additional file 1; Figure S3). We did not infer any temporal variations in the LOS changes for discarded pixels where the coherence of any individual InSAR data point was below 0.1. After estimating the time-series of the LOS changes using the MTI analysis, we extracted the cumulative deformation associated with the 2018 phreatic eruption until the end of 2019. Using pairs of cumulative coeruptive LOS changes in paths 19/125 and 19/126, we decomposed them into quasi-east–west (QEW) and quasi-up-down (QUD) components to better understand the spatial characteristics of the coeruptive LOS changes (Fujiwara et al. 2000).