The proton transfer (PT) complex of 2-amino 4-methoxy 6-methyl pyrimidinium (2A4M6MP) 4-aminosalicylate (4AMSA), C6H10ON3+ C7H6NO3−, (I), and 5-chlorosalicylate (5ClSA), C6H10ON3+ C7H4O3Cl− (II) were synthesized and crystallized. The crystal structures of both salt molecules were investigated by SC-XRD. Further, the calculated ∆pKa values clearly demonstrate that 2A4M6MP is a good salt former when combined with carboxylic acids. Hirshfeld surface analysis provides the quantifying interactions in the solid state and energy framework shows the stability of hydrogen bonding. QTAIM analysis reveals the nature of chemical bonding and electron density distribution of intermolecular interactions of pyrimidine based salt molecules.
Research Article
Insights into the interactions between salt molecules: A combined experimental and computational study
https://doi.org/10.21203/rs.3.rs-323542/v1
This work is licensed under a CC BY 4.0 License
Version 1
posted
You are reading this latest preprint version
Proton Transfer
Single Crystal
Intermolecular Interaction
Hirshfeld Surfaces
Fingerprint Plots
Co-crystals are the products of crystal engineering, which aims to bring two or more different molecules into one crystal lattice via non-covalent interactions, e.g. hydrogen bonds, without breaking any covalent bond [1]. In designing co-crystals, an important factor for consideration is, which of the two possible intermolecular bonds is favored, i.e. hetromeric (co-crystal) or homomeric (single molecule) [2, 3]. Functional groups that show a high tendency of forming a heteromeric interaction include carboxylic acid, pyrimidine and amide [4]. Molecules containing these groups are potentially good supramolecular synthons for co-crystal formation [5]. Proton transfer complexes are gaining considerable interest in the research from the last decade, due to their wide potential applications in the field of pharmaceutical science [6, 7], material science [8, 9], bio-electrochemical energy transfer process [10], biological science [11, 12], optoelectronic, optical communication, organic semiconductor [13, 14] and DNA binding [15], antibacterial and antifungal activity [16].
Pyrimidine and amino pyrimidine derivatives are biologically important compounds and they occur in nature as components of nucleic acids such as cytosine, uracil and thymine [17]. Pyrimidine derivatives also developed as the antiviral agents such as AZT, which is the most widely used anti-HIV drug and in biology it has many applications in the areas of pesticides and pharmaceutical agents [18]. Furthermore, the pyrimidine group offers two protonation sites (the two ring nitrogen) and the site of protonation depends on the nature of the substituent [19, 20]. 4-Amino salicylic acid (4AMSA) is a well-known antibiotics for tuberculosis treatment and also encouraging anticancer drug [1, 21]. 5-Chlorosalicylic acid (5ClSA) is a potential candidate have found enormous application in medical and pharmaceutical research and industry, particularly in the treatment of acene, psoriasis, calluses, corns, keratosis pilaris and warts [22]. 5-Chlorosalicylic acid is presently finding burgeoning use in cosmetic industry [23]. The title salts, namely, 2-amino 4-methoxy 6-methyl pyrimidinium 4-amino salicylate (2A4M6MP-4AMSA) (I), and 2-amino 4-methoxy 6-methyl pyrimidinium 5-chloro salicylate (2A4M6MP-5ClSA) (II), have been investigated in order to study the hydrogen bonding patterns and supramolecular architectures in the crystalline state. The wide range importance of 2A4M6MP and salicylic acid motivated to synthesize their proton transfer complex [5]. Their single crystal has been grown by slow evaporation technique and it was investigated by crystal and molecular structure analysis. The fingerprint plots associated with the Hirshfeld surface clearly displays each significant interaction involved in the structure, by quantifying them in an effective visual manner. The ∆pKa values for both base-acid complexes (I & II) were calculated to confirm the formation of molecular salts.
2.1. Synthesis and Crystallization
The title compound was synthesized by the reaction of 1:1 stoichiometric mixture of 2-amino 4-methoxy 6-methyl pyrimidine (34.79 mg, 0.25 mmol) with 4-amino salicylic acid (38.28 mg, 0.25 mmol) or 5-chlorosalicylic acid (43.14 mg, 0.25 mmol) in 20ml of hot methanol solution, after warming a few minutes over a water bath for 30 min. The solution was cooled and kept at room temperature. Within few days, block-shaped brown color crystal of salt-I and colorless needle-shaped crystal of salt-II were obtained by slow evaporation at room temperature. Both crystals (I & II) were found suitable for the single crystal X-ray structure analysis.
2.2. X-ray Crystallography
Single crystal X-ray diffraction intensity data for the crystals of (I) & (II) were collected on Bruker D8 QUEST ECO diffractometer [24] equipped with APEX III photon detector and Molybdenum monochromator (MoKα radiation, λ = 0.71073 Å). The unit cell refinement and data reduction were carried out using Bruker SAINT [24] and the necessary absorption corrections were performed by multiscan method using SADABS [24]. The structure of both crystals (I & II) were solved by direct methods using SHELXS [25] incorporated to WinGX-2014 [26] program suit and refined by full-matrix least-squares techniques using SHELXL [25, 26]. All non-hydrogen atoms were refined anisotropically and thereafter, all hydrogen atoms were placed in their geometrically idealized positions and constrained to ride on their parent atoms. The unit cell, X-ray intensity data collection and crystal structure refinement details of salt (I) and (II) are presented in Table 1. All H-atoms except the methyl group H-atoms were located in difference Fourier maps and refined isotropically. The remaining methyl group H-atom positions were calculated geometrically [C‒H = 0.96 Å] and refined using the riding model with Uiso (H) = 1.5Ueq(C). Diagrams and publication material were generated using Olex2[27], PLATON [28] and MERCURY softwares [29].
Table 1 Experimental details
|
Salt (I) |
Salt (II) |
|
|
Crystal data |
||
|
Chemical formula |
C6H10ON3+C7H6NO3-. |
C6H10ON3+C7H4O3Cl -. |
|
Mr |
292.3 g/mol |
311.72 g/mol |
|
Crystal system, Space group |
Monoclinic, P21/n |
Triclinic, P |
|
Temperature (K) |
293 |
293 |
|
a,b,c (Å) |
8.8829(2), 15.1248(3), 10.4933(3) |
8.329(6), 9.962(8), 9.998(7) |
|
α,β,γ (˚) |
α = 90 β = 98.392(1) γ = 90 |
α = 111.66(2) β = 111.263(13) γ = 94.052(18) |
|
V(Å3) |
1394.70(6) |
698.1(9) |
|
Z |
4 |
2 |
|
Radiation type |
Mo Kα, λ=0.71073 Å |
Mo Kα, λ=0.71073 Å |
|
μ (mm-1) |
0.11 |
0.29 |
|
Crystal size(mm) |
0.184 x 0.234 x 0.184 |
0.325 x 0.160 x 0.102 |
|
Data collection |
||
|
Diffractometer |
Bruker D8 QUEST ECO |
Bruker D8 QUEST ECO |
|
Absorption correction |
Multi-scan (SADABS) |
Multi-scan (SADABS) |
|
Tmin, Tmax |
0.7097, 0.7457 |
0.5940, 0.7457 |
|
No. of measured, independent and observed [I>2σ(I)] reflections |
8088, 2690, 2573 |
9507, 3433, 2483 |
|
Rint |
0.019 |
0.030 |
|
(sinθ/λ)max(Å-1) |
0.615 |
0.667 |
|
Refinement |
||
|
R[F2>2σ(F2)],wR(F2),S |
0.051, 0.126, 1.17 |
0.064, 0.162, 1.08 |
|
No.of reflections |
2690 |
3433 |
|
No.of parameters |
228 |
221 |
|
H-atom treatment |
H atoms treated by a mixture of independent and constrained refinement |
H atoms treated by a mixture of independent and constrained refinement |
|
∆ρmax , ∆ρmin(eÅ-3) |
0.19, -0.14 |
0.42, -0.27 |
|
CCDC Deposit |
2014260 |
2014262 |
2.3 Hirshfeld Surface Analysis
The Hirshfeld surface of the crystal is being used to analyze the intermolecular interactions of the molecules in the crystal, which is defined by using the weight function [the division of the sum of the promolecule density (spherical atom electron densities) to the sum of the same procrystal electron density [30, 31]. The intermolecular contact information was obtained from the two di parameters (distance from the surface to the nearest atom interior to the surface) and de (distance from the surface to the nearest atom exterior to the surface), which is derived from the triangulation of surface points. The Hirshfeld surface and fingerprint plots of the salts (I) & (II) were generated using Crystal Explorer 17.5[32]. Fingerprint plots are based on Hirshfeld surface, which allows to identify strength of intermolecular interactions and crystal packing modes in molecular crystals to be explored [33]. The sums of four different energy components as electrostatic, polarization, dispersion and repulsion energies were used to calculate the total intermolecular interaction energy (Eq. 1). The graphical representation of energy frameworks of individual energy components was carried out to depict the centroids of interacting molecular pairs as color-coded cylinders.
$${E}_{total}={E}_{electrostatic}+{E}_{polarization}+{E}_{dispersion}+{E}_{repulsion}$$
1
2.4 QTAIM Calculation
To view the electronic level information of two different salt molecules, single point energy calculation of DFT (B3LYP)[34–36] method with the basis set 6-311G** was performed directly using the crystallographic coordinates GAUSSIAN03 software[37]. Then, topological properties of electron density ![]() of both molecules were retrieved from the wave function. The topological properties of electron density
of both molecules were retrieved from the wave function. The topological properties of electron density ![]() at the bond critical point (bcp); [where
at the bond critical point (bcp); [where ![]() ] of the molecule were determined from the charge density analysis using Bader’s theory of atoms in molecules (AIM)[38]. The bcp for all bonds has been located from the
] of the molecule were determined from the charge density analysis using Bader’s theory of atoms in molecules (AIM)[38]. The bcp for all bonds has been located from the ![]() where the first derivative of electron density is zero, which implies that the electron density is maximum. The second order derivative of electron density
where the first derivative of electron density is zero, which implies that the electron density is maximum. The second order derivative of electron density ![]() is Laplacian of electron density which is formulated in Hessian matrix
is Laplacian of electron density which is formulated in Hessian matrix
![]()
This allows to determine the local electronic charge concentration (![]() <0) and depletion (
<0) and depletion (![]() >0) of the molecule. The electron density
>0) of the molecule. The electron density ![]() and the Laplacian of electron density
and the Laplacian of electron density ![]() maps were plotted using wfn2plots and Denprop from XD2006[39]. The electrostatic potential maps were drawn from WinXPRO 3D[40] plot software package.
maps were plotted using wfn2plots and Denprop from XD2006[39]. The electrostatic potential maps were drawn from WinXPRO 3D[40] plot software package.
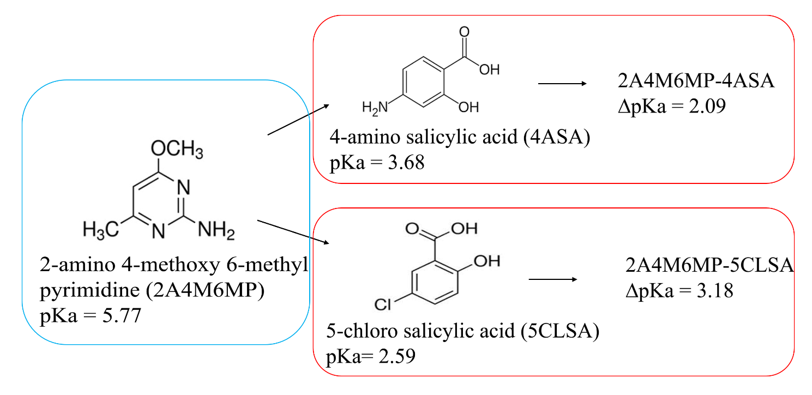
3.1 Impact of ∆pKa value on the occurrence of acid base dimmers
In a reaction, the acid and base involves, the transfer of proton from acid to base gives rise to a salt, whereas the co-crystal arises, when the proton intact with the acid. For a carboxylic acid pyrimidine reaction [41–43], the COO − H···Narom and molecular salts have COO‒ ···H‒N+ arom heterosynthon. The ∆pKa [pKa(base) – pKa(acid)] rule is an empirical indicator which predicts whether a molecular complex will result as a salt [44–46]. The ‘rule of three’ is commonly employed to predict the outcome of a solid resulting from acid-base molecular reactions [42, 43, 47]. As a general rule, ∆pKa < 0 yields a co-crystal while ∆pKa > 3.75 leads to a salt. It is generally believed that the co-crystal or salt or both can appear in the domain between 0 and 3.75 [42, 48]. Furthermore, a report outline that [49], the ∆pKa region can be classified into three zones; in the first zone, the value of ∆pKa < -1, where one can expect the co-crystal; in the second zone the values range ‒1 < ∆pKa < 4, this comprises the co-crystal and salt; while in the third zone, the value of ∆pKa > 4 [50, 51], which is the molecular salt and this is in good agreement with the molecular complexes salicylic acid and pyrimidine derivative. The pKa value of 2A4M6MP, 4-amino salicylic acid and 5-chlorosalicylic acid are 5.77, 3.68 and 2.59 respectively. In the present study, the calculated values of ∆pKa values of acid-base complexes fall in the range 2.0 to 4.0 (Table S9), this confirms the formation of molecular salts.
3.2 Molecular structure and Intermolecular interactions
The molecular structure of salt (I) is shown in Fig. 1. The asymmetric unit of (I) contains a 2-amino-4-methoxy-6-methylpyrimidinium cation and a 4-amino salicylic acid anion. The cation is protonated at N1, which lies between the amine and methoxy groups attached C-atoms. This protonation can be confirmed from the difference of bond angle at the protonated N1 atom [C1‒N1‒C2 = 121.2 (1)°] and the unprotonated atom N2 [C4‒N2‒C1 = 115.9 (1)°] and this also further confirmed from the corresponding reported bond angle of neutral 2-amino-4-methoxy-6-methylpyrimidine [17, 18] which is significantly less [116.0(18)°]. In the salt (I), the 4-aminosalicylate (4AMSA) molecule exhibits an intramolecular O4‒H4···O3 hydrogen bonding interaction (Fig. 1, Table 2). The protonated N-atom (N1) and 2-amino group (N3) of the cation interacts with the O2 and O3 oxygen atoms of the carboxylate anion through a pair of N − H···O hydrogen bonds (Table 2) forming an eight-membered ring motif (8). Inversion-related (8) ring motifs are further bridged by N − H···O hydrogen bonds thereby forming a DDAA tetramer (D stands for hydrogen-bond donor and A stands for hydrogen bond acceptor). This set of fused rings can be represented by the graph-set notations (8), (8) and (8) [50, 52]. This type of motif has been reported previously in the crystal structures of trimethoprim hydrogen glutarate [49, 53] and 2-amino-4-methoxy-6-methylpyridinium trifluoroacetate [54] (Fig. S14). The (8) ring motif is further extended in both sides via N − H···O hydrogen bonding generating a supramolecular chain [49] (Fig. S15). These supramolecular chains are further interconnected via N − H···O hydrogen bonding interactions generating a supramolecular sheet (Fig. S16). The 4-amino salicylate ions form hydrogen bonded supramolecular chain via N − H···O hydrogen bonds involve amino hydrogen N3 and one of the oxygen atoms of the carboxylate group (Fig. S17). Subsequent level of aggregation forms a cyclic heterotetramer preferred stable synthon (Fig. S18). This crystal structure was further stabilized by C − H···π stacking interaction. The C − H···π interaction between the 2A4M6MP cations with the 4-amino salicylate anions (C5 − H5C···Cg(2)v distance of 2.99(1) Å) (Fig. S19). (Symmetry code: 1/2-x,1/2 + y,3/2-z)
Table 2 Hydrogen bonding interactions in the crystal of salt – I and II (Å, °)
|
D‒H···A |
D‒H |
H···A |
D···A |
D‒H···A |
|
Salt-I |
||||
|
N3‒H3A···O2(i) |
0.94(2) |
1.88(2) |
2.815(2) |
171.7(19) |
|
N3‒H3B···O2(ii) |
0.87(2) |
2.00(2) |
2.805(2) |
154.4(19) |
|
O4‒H4···O3 |
1.01(3) |
1.59(3) |
2.5322(19) |
152(3) |
|
N4‒H4A···O4(i) |
0.834(19) |
2.490(18) |
3.294(2) |
162.2(18) |
|
N4‒H4B···O2(iii) |
0.88(3) |
2.45(3) |
3.299(2) |
161.5(18) |
|
N1‒H13···O3(i) |
0.94(2) |
1.78(2) |
2.7098(18) |
173.8(19) |
|
C3‒H3···O1(iv) |
0.938(19) |
2.423(19) |
3.313(2) |
158.3(17) |
|
Salt-II |
||||
|
N3‒H3B···O3(v) |
0.86 |
1.99 |
2.848(4) |
178 |
|
N3‒H3A···N2(vi) |
0.86 |
2.27 |
3.118(4) |
170 |
|
O4‒H4···O3 |
0.88(4) |
1.71(4) |
2.543(3) |
159 |
|
N1‒H13···O2(v) |
0.95(4) |
1.68(4) |
2.623(4) |
173(3) |
|
C11‒H11···O2 |
0.92 (3) |
2.44(3) |
2.766(4) |
101(2) |
Symmetry codes: (i) -1/2+x,1/2-y,1/2+z ; (ii) 1/2-x,1/2+y,1/2-z; (iii) 1/2+x,1/2-y,1/2+z; (iv) 1-x,1-y,-z, (v) -x,1-y,1-z; (vi)1-x,2-y,1-z
The asymmetric unit of salt (II) contains a 2-amino-4-methoxy-6-methylpyrimidinium cation and a 5-chlorosalicylate anion (Fig. 1). The hydroxyl group of the 5-chlorosalicylic acid is deprotonated and proton-transferred to the nitrogen atoms of 2-aminopyrimidine moieties [18, 23, 49, 55]. In the cation, one of the pyrimidine nitrogen atoms (N1) is protonated and this is confirmed from the increase of bond angle at N1 [C2‒N1‒C1: 121.7 (2)°], and this angle is comparable with the unprotonated atom N2 [C4‒N2‒C1: 116.17(19)°] and this also further confirmed from the corresponding reported bond angle of neutral 2-amino-4-methoxy-6-methylpyrimidine [17, 18], which is significantly high [116.0(18)°]. An intramolecular O4 − H4···O3 hydrogen bond in the 5-chlorosalicyclic acid anion generates a S(6) ring motif [56, 57].
The protonated N1-atom and the nitrogen atom of the 2-amino group (N3) are hydrogen-bonded to the carboxylate oxygen atoms (O2 and O3) via a pair of intermolecular N1–H13···O2(i) and N3–H3B···O3(i) hydrogen bonds (symmetry code: (i) -x,1-y,1-z) forming a ring motif R22(8) [18, 56]. The main motif is assembled via complementary hydrogen bonding interaction between the carboxylic acid and the amino pyrimidine moiety to form a dimeric unit (Fig. S20) [49]. Adjacent dimeric units are connected through self-complementary secondary N − H···N hydrogen bonds to form a four component supramolecular networks. Thus, the hydrogen bonds, O − H···N, N − H···O and N − H···N motif combine to form a linear heterotetramer (LHT) motif [49]. This motif is further connected through N–H···N hydrogen bonds involving N2 atom of 2-amino 4-methoxy 6-methyl pyrimidinium cations generating a supramolecular chain (Fig. S21). The C − Cl···π [C10 − Cl···Cg(1)iii distance of 3.856(3) Å; symmetry code: (iii) -1 + x,y,z] type of interaction is also further stabilize the crystal structure (Fig. S22).
3.3 Hirshfeld surface analysis
The three-dimensional dnorm surface is a useful tool for analyzing and visualizing the intermolecular interactions, as it shows negative or positive values depending on whether an intermolecular contact is shorter or longer, respectively, than the sum of the van der Waals radii [18]. The dnorm surface of the salt (I) is shown in Fig. 4, the red points, which represent closer contacts and negative dnorm values correspond to the N‒H···O, O‒H···O, O‒H···N and C‒H···O interactions. The two-dimensional fingerprint plots from the Hirshfeld surface analysis (Fig. 5) provide information about the intermolecular contacts and their percentage of distributions on the Hirshfeld surface. The intermolecular interactions of the salt (I & II) are quantified by using Hirshfeld surface analysis. The mapping of di, de, shape index and curvedness are shown in S24. Figure 5 bar-diagram indicates the contribution of inter-contacts to the Hirshfeld surfaces, H···H (46.1% & 37.1%), N···H (9.6% & 4.5%), C···H (14.3% ,14.9%), O···H (26.6% & 18.0), H···Cl (11.9%) and others (C···C, N···N, C···O, C···Cl ; 3.4 & 13.6%). The important interaction is highlighted by conventional mapping of dnorm on molecular Hirshfeld surfaces as shown in Fig. 4. Hirshfeld surface analyses of synthon, the crystal packing of salts were confirmed by light red spots on the dnorm surfaces of two salts. Further, inter-contacts are plotted with fingerprint plots (Fig. 5). The Fig. 5(a) shows large surfaces for all inter-contacts, Fig. 5(c) shows large surface for H···H interatomic contacts, the N···H contact plot is shown in Fig. 5(d) and the Fig. 5(e) shows the presence of O···H contact with the two characteristic wings and the “butterflies” are identified as a consequence of C‒H interactions reveals the information of intermolecular hydrogen bonding. The fingerprint plot studies have been characterized the non-covalent interaction and their reactive proportions to the present organic salt molecules.
3.4 Interaction energy calculation
To understand the geometric and electronic relationship between the structure of molecules and to predictive structure-property relationship in crystal engineering, energy frameworks offer a powerful path to visualize the supramolecular architecture of molecular crystal structures. The successful calculation of interaction energies with color-coded molecular crystals was performed for both salts (I&II); the values are tabulated (Table S10 & S11). The total energies of all interacting molecules with respect to corresponding reference molecule along with the different symmetry operation and centroid-centroid distance. In the salt I, the total energy for the hetrosynthon is -52.7 kJ/mol and for the homosynthon, the value is -20.5 kJ/mol. Whereas in the salt II, the total energy is -36.2 kJ/mol and − 68.3 kJ/mol for the hetro and homosynthon respectively. On comparing the salts, the total energy values clearly confirm that, in the crystal phase, the salts are forming strong hydrogen bonding interactions. In the energy framework, the strength of intermolecular interactions is directly correlated to the radii of the color-coded cylinders. Figure 6 shows, the energy frameworks of the salt I and II were generated for a cluster of 3×3×3-unit cells to understand the overall topology of the energy distribution in the solid-state phase. In short, by using NCIPLOT the reduced density gradient is plotted as the function of the density (mapped as isosurfaces) over the molecule of interest. Fig S25 shows the sign of the second Hessian eigen value times the electron density (sign of (λ2)ρ in atomic units) enables the identification of attractive/stabilizing or repulsive interactions (Salt–I:-105.90; Salt –II:-114.01 kcal/mole). Overall, the interacting energy topologies of the molecules are concluded that these interacting energies are playing crucial role in the assembly of the molecules in the solid state and in the crystal engineering.
3.5 Topological properties
The QTAIM (Bader's quantum theory of atoms in molecules) analysis is a powerful tool to understand the nature of chemical bonding, reactive nature and intermolecular interactions of the molecular system at electronic level. The topological parameters such as electron density, Laplacian of electron density of both salts obtained from the wave function have carried out to understand the stability of the molecule when it forms together. To visualize the lone pair position and charge accumulation of the salt molecules, deformation electron density map of both salts were plotted, it displays the lone pair position of O-atom of C = O group (Fig. 7a). Similarly, the Laplacian of electron density (Fig. 7b) reveals the charge concentration/depletion at the bond critical point of chemical bonds. On comparing the electronic level information of both salt molecules, the electron density and Laplacian of electron density of C2‒C3 bond is found higher and C2‒C5 is lesser than the other C‒C bonds in the salt molecules [C2‒C3: \({\rho }_{bcp}:\)2.283I/2.223II eÅ−3; \({{\nabla }^{2}{\rho }}_{bcp}\): -24.492I/-23.213II eÅ−5 & C2‒C5: \({\rho }_{bcp}:\) 1.735I/1.731II eÅ−3; \({{\nabla }^{2}{\rho }}_{bcp}\): -15.147I/-15.077II eÅ−5]. And, the \({\rho }_{bcp} \& {{\nabla }^{2}{\rho }}_{bcp}\) of N‒N and C–O bonds of both salt molecules exhibit acceptable values; the C9–N4 and C6–O1 bonds are carrying less electron densities [C9–N4: \({\rho }_{bcp}:\)2.089I eÅ−3; \({{\nabla }^{2}{\rho }}_{bcp}\) -21.651 I eÅ−5 & C6–O1: \({\rho }_{bcp}:\)1.545I/1.598II eÅ−3; \({{\nabla }^{2}{\rho }}_{bcp}\) : -3.969I/-2.723II eÅ−5]. Interestingly, all the C–H bonds possess high electron density and Laplacian of electron density values; Moreover, the \({\rho }_{bcp} \& {{\nabla }^{2}{\rho }}_{bcp}\)of N–H [N1–H13: \({\rho }_{bcp}:\)2.725I/2.61II eÅ−3] bonds are very high which clearly indicates the completion of charge transfer.
The intermolecular interactions between group of salts (I and II) were analyzed to find the strength and type of interactions. In both salt molecules, the N–H∙∙∙O and O–H∙∙∙O type of strong hydrogen bonding intra/intermolecular interactions were observed; in which, the proton of H13 was transferred from the acid O3 atom to base N1 atom. The topological parameters of these intermolecular interactions help us to understand the stability of the cofomers. The electron density and Laplacian of electron density of N2‒H13···O3 bond of salt I is 0.267 eÅ−3 and 3.146 eÅ−5; whereas in the salt II, the \({\rho }_{bcp} \& {{\nabla }^{2}{\rho }}_{bcp}\) of N1‒H13···O2 is 0.343 eÅ−3 and 3.676 eÅ−5 respectively. These are almost similar to the reported experimental values. Moreover, the acid of both salts are forming strong intra-molecular hydrogen bonding, the \({\rho }_{bcp} \& {{\nabla }^{2}{\rho }}_{bcp}\) of O4‒H4···O3 bond is found to higher than the other interactions [O4‒H4···O3: \({\rho }_{bcp}:\)0.426I/0.320II eÅ−3 & \({{\nabla }^{2}{\rho }}_{bcp}\): 3.78I/3.969II eÅ−5]. The small electron density and positive Laplacian of electron density confirms that the interactions are closed-shell interaction. Furthermore, the kinetic energy, potential energy, total energy and dissociation energy of these interactions were calculated and summarized in the Table 3. Figure 7c shows the position of bcp of respective bonds in the molecule, in which the bcp of homo atomic bonds are lies at the middle of the bonds, whereas in hetero atomic bonds, this is not true as it is deviated largely from the middle of the bond. The topological properties of electron density (\({\rho }_{bcp} \& {{\nabla }^{2}{\rho }}_{bcp}\)) at the bond critical point (bcp) provide information about the nature and strength of intermolecular interactions.
|
D‒H···A |
H···A (Å) |
ρ(rcp) (eÅ-3) |
\({\nabla }^{2}\)ρ(rcp) (eÅ-5) |
G(r) (a.u) |
V(r) (a.u) |
H(r) (a.u) |
E(r) (a.u) |
De (KJ/Mol) |
|---|---|---|---|---|---|---|---|---|
|
Salt-I |
||||||||
|
N3‒H3A···O2 |
1.88(2) |
0.207 |
2.514 |
0.048 |
-0.070 |
-0.022 |
-0.035 |
92.17 |
|
N1‒H13···O3 |
1.78(2) |
0.267 |
3.146 |
0.069 |
-0.105 |
-0.036 |
-0.052 |
137.73 |
|
O4‒H4···O3 |
1.59(3) |
0.426 |
3.78 |
0.129 |
-0.218 |
-0.089 |
-0.109 |
286.22 |
|
Salt-II |
||||||||
|
N3‒H3B···O3 |
1.99 |
0.162 |
2.244 |
0.036 |
-0.049 |
-0.012 |
-0.024 |
63.84 |
|
N1‒H13···O2 |
1.68(4) |
0.343 |
3.676 |
0.097 |
-0.156 |
-0.059 |
-0.078 |
204.14 |
|
O4‒H4···O3 |
1.71(4) |
0.32 |
3.969 |
0.091 |
-0.141 |
-0.050 |
-0.070 |
184.97 |
Electrostatic potential of both salts (I and II) were calculated to understand the characteristic regions of positive (attracting the nucleophiles) and negative (attracting electrophiles) potentials of the cofomers of salt molecules which were clearly visible and well separated. In which, the vicinity of electronegative potential are shown on the acid group of both salts (Fig. 7d). The obtained energy from the HOMO and LUMO of both salts used to determine the band gap and various reactivity descriptors such as electron affinity (A), ionization potential (I), global hardness (Ƞ), electrophilicity (ω) and electronegativity (𝜒) shown in Table 4. The LUMO→ HOMO, ∆E = 2.61 & 3.23eV, The LUMO + 1→ HOMO-1, ∆E = 4.04 & 5eV and LUMO + 2→ HOMO-2, ∆E = 6.36 & 6.26 eV (salt I & II) values are respectively. The Gradient trajectories are originated at the atomic centers and terminated at the bcp. The thick solid lines represent the zero-flux surfaces of atoms in molecules, which defines the boundary of the atomic basin (Fig. 7e).
|
Molecular descriptors |
Salt – I |
Salt – II |
|---|---|---|
|
Energy (eV) |
||
|
Electron affinity A=[-ELUMO] |
2.079 |
2.188 |
|
Ionization potential I=[-EHOMO] |
4.686 |
5.424 |
|
Global hardness Ƞ=(I-A)/2 |
1.304 |
1.618 |
|
Electro chemical Potential µ=-(I + A)/2 |
-3.383 |
-3.806 |
|
Electrophilicity ω=µ2/2 Ƞ |
4.388 |
4.476 |
|
Electronegativity 𝜒=(I + A)/2 |
3.383 |
3.806 |
|
HOMO energy |
-4.686 |
-5.424 |
|
LUMO energy |
-2.079 |
-2.188 |
|
Band Gap =[ELUMO-EHUMO] |
2.607 |
3.236 |
In both crystal structures of salt molecules, one of the pyrimidine N atoms was protonated which was confirmed from the ∆pKa values, molecular and topological analysis. In general, apart from the hydrogen bonding interactions, it was identified that the molecular arrangements of both salts (I) and (II) also stabilized by ionic interactions, and the hydrogen bonds, O − H···N, N − H···O and N − H···N motif combine to form a linear heterotetramer (LHT) motif supramolecular packing. The salt (II) form LHT was high supramolecular yield implicates the reliability of this synthon. In the study of Hirshfeld surface analysis was carried out for the purpose of studying the nature of the intermolecular contacts and their quantitative contributions to the supramolecular assembly of salt molecules. In conclusion, our investigation showed that, for 4-amino salicylic acid and 5-chlorosalicylic acid in combination with pyrimidine derivatives are formed distinct synthon. The salts (I & II) are represented by the graph-set notations (8), (8) and (8). An intramolecular O − H···O hydrogen bond in the salicylic acid anion generates a S(6) ring motif. These findings might help to design new two salts and possible networks of salt molecules by using such synthons as the building blocks. The calculation of energy frameworks shows the topology of overall interaction energy between the constituents of the crystal. ESP study gives the preferable electron donor and acceptor regions. The energy gap values of the investigated salts are found very high, this result confirms the good reactivity of salt (I & II). The experimental result confirms that the hydrogen bonding interactions play an important role in the assembly of high dimensional supramolecular architectures.
Acknowledgement
S.S is grateful to Periyar University for providing the University Research Fellowship (URF) to carry out this research and RUSA & DST-FIST funded X-ray diffraction facility for X-ray intensity data collection.
Funding:
Not applicable
Conflict of Interest:
The authors declare that they have no known competing financial interests or personal relationships that could have appeared to influence the work reported in this paper.
Availablity of data and material:
Not applicable
Code Availability:
Not applicable
Authors Contributions:
Suganya Suresh , Saravanan Kandasamy and Kumaradhas Poomani : Conceptualization, Methodology, Software .
Suganya Suresh: Data curation, Writing- Original draft preparation.
Karthikeyan Ammasai, Saravanan Kandasamy: Visualization, Investigation.
Kumaradhas Poomani: Supervision.
Kumaradhas Poomani, Suganya Suresh: Software, Validation.
Kumaradhas Poomani: Writing- Reviewing and Editing.
- Goswami PK, Thaimattam R, Ramanan A (2016) Crystal Engineering of Multicomponent Crystal Forms of p-Aminosalicylic Acid with Pyridine Based Coformers. Crystal Growth and Design 16:1268–1281. https://doi.org/10.1021/acs.cgd.5b01308
- Desiraju GR (1995) Supramolecular Synthons in Crystal Engineering—A New Organic Synthesis. Angewandte Chemie International Edition in English 34:2311–2327. https://doi.org/10.1002/anie.199523111
- Desiraju GR (2020) Crystal engineering in all its hues in. IUCrJ 7:143. https://doi.org/10.1107/S2052252520001608
- Almarsson Ö, Zaworotko MJ (2004) Crystal engineering of the composition of pharmaceutical phases. Do pharmaceutical co-crystals represent a new path to improved medicines? Chemical Communications 1889–1896. https://doi.org/10.1039/b402150a
- Afroz Z, Faizan M, Alam MJ, et al (2018) Synthesis, structural, hirshfeld surface, spectroscopic studies and quantum chemical calculation of the proton transfer complex between 2-amino-4-hydroxy-6-methylpyrimidine and salicylic acid. Journal of Molecular Structure 1171:438–448. https://doi.org/10.1016/j.molstruc.2018.06.020
- Cherukuvada S, Kaur R, Guru Row TN (2016) Co-crystallization and small molecule crystal form diversity: From pharmaceutical to materials applications. CrystEngComm 18:8528–8555. https://doi.org/10.1039/c6ce01835a
- Mirzaei M, Sadeghi F, Molčanov K, et al (2020) Recurrent Supramolecular Motifs in a Series of Acid-Base Adducts Based on Pyridine-2,5-Dicarboxylic Acid N-Oxide and Organic Bases: Inter- And Intramolecular Hydrogen Bonding. Crystal Growth and Design 20:1738–1751. https://doi.org/10.1021/acs.cgd.9b01475
- Nguyen TP, Shim JH, Lee JY (2015) Density functional theory studies of hole mobility in picene and pentacene crystals. Journal of Physical Chemistry C 119:11301–11310. https://doi.org/10.1021/jp511484d
- Rani TD, Rajkumar M, Vinitha G, et al (2020) Synthesis, structural, thermal, mechanical, laser damage threshold and DFT investigations on bis (2-methylimidazolium-4-aminobenzoate) single crystal. Journal of Molecular Structure 1200:127045. https://doi.org/10.1016/j.molstruc.2019.127045
- Roy DK, Saha A, Mukherjee AK (2005) Spectroscopic and thermodynamic study of charge transfer complexes of cloxacillin sodium in aqueous ethanol medium. Spectrochimica Acta - Part A: Molecular and Biomolecular Spectroscopy 61:2017–2022. https://doi.org/10.1016/j.saa.2004.08.001
- Song N, Dares CJ, Sheridan M V., Meyer TJ (2016) Proton-Coupled Electron Transfer Reduction of a Quinone by an Oxide-Bound Riboflavin Derivative. Journal of Physical Chemistry C 120:23984–23988. https://doi.org/10.1021/acs.jpcc.6b08176
- Ahuja D, Svärd M, Lusi M, Rasmuson ÅC (2020) Solution and calorimetric thermodynamic study of a new 1 : 1 sulfamethazine–3-methylsalicylic acid co-crystal. CrystEngComm 22:3463–3473. https://doi.org/10.1039/d0ce00498g
- Prabha D, Karunathan R, Sathyanarayanamoorthi V (2017) Experimental and theoretical perspectives on 2-amino 5-bromopyridinium salicylate: a third order nonlinear optical material. Journal of Materials Science: Materials in Electronics 28:9675–9687. https://doi.org/10.1007/s10854-017-6718-8
- Ashfaq M, Tahir MN, Kuznetsov A, et al (2020) DFT and single crystal analysis of the pyrimethamine-based novel co-crystal salt: 2,4-diamino-5-(4-chloro-phenyl)-6-ethylpyrimidin-1-ium:4-hydroxybenzoate:methanol:hydrate (1:1:1:1) (DEHMH). Journal of Molecular Structure 1199:127041. https://doi.org/10.1016/j.molstruc.2019.127041
- Zulkarnain, Miyan L, Ahmad A, et al (2017) Synthesis, single-crystal, DNA interaction, spectrophotometric and spectroscopic characterization of the hydrogen-bonded charge transfer complex of 2-aminopyrimidine with π-acceptor chloranilic acid at different temperature in acetonitrile. Journal of Photochemistry and Photobiology B: Biology 174:195–208. https://doi.org/10.1016/j.jphotobiol.2017.07.002
- Wagner E, Al-Kadasi K, Zimecki M, Sawka-Dobrowolska W (2008) Synthesis and pharmacological screening of derivatives of isoxazolo[4,5-d]pyrimidine. European Journal of Medicinal Chemistry 43:2498–2504. https://doi.org/10.1016/j.ejmech.2008.01.035
- Glidewell C, Low JN, Melguizo M, Quesada A (2003) Hydrogen bonding in 2-amino-4-methoxy-6-methylpyrimidine, 2-benzylamino-4-benzyloxy-6-methylpyrimidine and 4-benzylamino-2,6-bis(benzyloxy)pyrimidine: π-stacked chains of fused r22(8) rings, and centrosymmetric r22(8) dimers. Acta Crystallographica Section C: Crystal Structure Communications 59:9–13. https://doi.org/10.1107/S0108270102020206
- Jeevaraj M, Sivajeyanthi P, Edison B, et al (2018) Crystal structure, hydrogen bonding and Hirshfeld surface analysis of 2-amino-4-methoxy-6-methylpyrimidinium 4-chlorobenzoate. Acta Crystallographica Section E: Crystallographic Communications 74:656–659. https://doi.org/10.1107/S2056989018005583
- Rajam A, Muthiah PT, Butcher RJ, et al (2018) Design of two series of 1:1 cocrystals involving 4-amino-5-chloro-2,6-dimethylpyrimidine and carboxylic acids. Acta Crystallographica Section C: Structural Chemistry 74:1007–1019. https://doi.org/10.1107/S2053229618009154
- Odiase I, Nicholson CE, Ahmad R, et al (2015) Three cocrystals and a cocrystal salt of pyrimidin-2-amine and glutaric acid. Acta Crystallographica Section C: Structural Chemistry 71:276–283. https://doi.org/10.1107/S2053229615004283
- Montis R, Hursthouse MB (2012) Surprisingly complex supramolecular behaviour in the crystal structures of a family of mono-substituted salicylic acids. CrystEngComm 14:5242–5254. https://doi.org/10.1039/c2ce25336d
- Ray D, Paul BK, Guchhait N (2012) Effect of biological confinement on the photophysics and dynamics of a proton-transfer phototautomer: An exploration of excitation and emission wavelength-dependent photophysics of the protein-bound drug. Physical Chemistry Chemical Physics 14:12182–12192. https://doi.org/10.1039/c2cp41292f
- Darious S, Muthiah T (2018) Supramolecular interactions in 2 , 6-diamino-4- research communications. 237–241. https://doi.org/10.1107/S2056989018001196
- Bruker (2006) APEX2, SAINT, and SADABS
- Sheldrick GM (2008) A short history of SHELX. Acta Crystallographica Section A: Foundations of Crystallography 64:112–122
- Sheldrick GM (2015) Crystal structure refinement with SHELXL. Acta Crystallographica Section C: Structural Chemistry 71:3–8. https://doi.org/10.1107/S2053229614024218
- Dolomanov O V., Bourhis LJ, Gildea RJ, et al (2009) OLEX2: A complete structure solution, refinement and analysis program. Journal of Applied Crystallography 42:339–341. https://doi.org/10.1107/S0021889808042726
- Spek AL (2003) Single-crystal structure validation with the program PLATON. Journal of Applied Crystallography 36:7–13. https://doi.org/10.1107/S0021889802022112
- Macrae CF, Edgington PR, McCabe P, et al (2006) Mercury: Visualization and analysis of crystal structures. Journal of Applied Crystallography 39:453–457. https://doi.org/10.1107/S002188980600731X
- Che Khalib N, Thanigaimani K, Arshad S, et al (2018) Hydrogen-bonded Supramolecular Association in Organic Acid-base Pyrimidine Salt and Hirshfeld Surface Analysis. Journal of Physics: Conference Series 1083:. https://doi.org/10.1088/1742-6596/1083/1/012048
- Kalaiarasi C, Sangeetha P, Pavan MS, Kumaradhas P (2018) Crystal structure and theoretical charge density studies of dilantin molecule. Journal of Molecular Structure 1170:105–118. https://doi.org/10.1016/j.molstruc.2018.05.030
- Spackman MA, Jayatilaka D (2009) Hirshfeld surface analysis. CrystEngComm 11:19–32. https://doi.org/10.1039/b818330a
- Spackman MA, McKinnon JJ (2002) Fingerprinting intermolecular interactions in molecular crystals. CrystEngComm 4:378–392. https://doi.org/10.1039/b203191b
- Becke AD (1993) Density-functional thermochemistry. III. The role of exact exchange. The Journal of Chemical Physics 98:5648–5652. https://doi.org/10.1063/1.464913
- The I, Lee F (1972) CHAPTER 3
- Lee C, Yang W, Parr RG (1988) Development of the Colle-Salvetti correlation-energy formula into a functional of the electron density. Physical Review B 37:785–789. https://doi.org/10.1103/PhysRevB.37.785
- Gaussian 16, Revision C.01, M. J. Frisch, G. W. Trucks, H. B. Schlegel, G. E. Scuseria, M. A. Robb, J. R. Cheeseman, G. Scalmani, V. Barone, G. A. Petersson, H. Nakatsuji, X. Li, M. Caricato, A. V. Marenich, J. Bloino, B. G. Janesko, R. Gomperts, B. Mennu and DJF (2016) Gaussian03
- Bader RFW (1994) Atoms in Molecules; A quantum theory. Clarendon Press
- Keith TA (2017) AIMALL
- Stash A, Tsirelson V (2002) WinXPRO: A program for calculating crystal and molecular properties using multipole parameters of the electron density. Journal of Applied Crystallography 35:371–373. https://doi.org/10.1107/S0021889802003230
- Stahl PH, Wermuth G (2002) Handbook of Pharmaceutical Properties , Selection , and Use Salts : Green Chemistry — the Japanese transla- tion of the special topic issue of Pure and Applied Chemistry ( Vol . 72 , No . 7 , 2000 ). 24:7312
- Sarma B, Nath NK, Bhogala BR, Nangia A (2009) Synthon competition and cooperation in molecular salts of hydroxybenzoic acids and aminopyridines. Crystal Growth and Design 9:1546–1557. https://doi.org/10.1021/cg801145c
- Lemmerer A, Govindraju S, Johnston M, et al (2015) Co-crystals and molecular salts of carboxylic acid/pyridine complexes: Can calculated pKa’s predict proton transfer? A case study of nine complexes. CrystEngComm 17:3591–3595. https://doi.org/10.1039/c5ce00102a
- Aakeröy CB, Desper J, Urbina JF (2005) Supramolecular reagents: Versatile tools for non-covalent synthesis. Chemical Communications 6081:2820–2822. https://doi.org/10.1039/b503718b
- Aakeröy CB, Schultheiss NC, Rajbanshi A, et al (2009) Supramolecular synthesis based on a combination of hydrogen and halogen bonds. Crystal Growth and Design 9:432–441. https://doi.org/10.1021/cg8006712
- Aakeröy CB, Forbes S, Desper J (2012) The effect of water molecules in stabilizing co-crystals of active pharmaceutical ingredients. CrystEngComm 14:2435–2443. https://doi.org/10.1039/c2ce06506a
- Aakeröy CB, Fasulo ME, Desper J (2007) Cocrystal or salt: Does it really matter? Molecular Pharmaceutics 4:317–322. https://doi.org/10.1021/mp060126o
- Delori A, Galek PTA, Pidcock E, et al (2013) Knowledge-based hydrogen bond prediction and the synthesis of salts and cocrystals of the anti-malarial drug pyrimethamine with various drug and GRAS molecules. CrystEngComm 15:2916–2928. https://doi.org/10.1039/c3ce26765b
- Ebenezer S, Muthiah PT (2012) Design of co-crystals/salts of aminopyrimidines and carboxylic acids through recurrently occurring synthons. Crystal Growth and Design 12:3766–3785. https://doi.org/10.1021/cg3005954
- Shattock TR, Arora KK, Vishweshwar P, Zaworotko MJ (2008) Hierarchy of supramolecular synthons: Persistent carboxylic acid⋯pyridine hydrogen bonds in cocrystals that also contain a hydroxyl moiety. Crystal Growth and Design 8:4533–4545. https://doi.org/10.1021/cg800565a
- Zaworotko M (2008) Crystal engineering of co-crystals and their relevance to pharmaceuticals and solid-state chemistry. Acta Crystallographica Section A Foundations of Crystallography 64:C11–C12. https://doi.org/10.1107/s0108767308099637
- Thanigaimani K, Muthiah PT, Lynch DE (2007) Hydrogen-bonding patterns in the cocrystal 2,4-diamino-6-phenyl-1,3,5- triazine-sorbic acid (1/1). Acta Crystallographica Section E: Structure Reports Online 63:. https://doi.org/10.1107/S1600536807052543
- Robert JJ, Raj SB, Muthiah PT (2001) N—H...O and O—H...O hydrogen bonds in crystal engineering: trimethoprim hydrogen glutarate. Acta Crystallographica Section E Structure Reports Online 57:o1206–o1208. https://doi.org/10.1107/s1600536801018001
- Jeevaraj M, Edison B, Kavitha SJ, et al (2016) data reports 2-Amino-4-methoxy-6-methylpyrimidin-1-ium trifluoroacetate. 9:x161010. https://doi.org/10.1107/S2414314616010105
- Kantouch A, El-Sayed AA, Salama M, et al (2013) Salicylic acid and some of its derivatives as antibacterial agents for viscose fabric. International Journal of Biological Macromolecules 62:603–607. https://doi.org/10.1016/j.ijbiomac.2013.09.021
- Bernstein J, Davis RE, Shimoni L, Chang N ‐L (1995) Patterns in Hydrogen Bonding: Functionality and Graph Set Analysis in Crystals. Angewandte Chemie International Edition in English 34:1555–1573. https://doi.org/10.1002/anie.199515551
- Thanigaimani K, Khalib NC, Arshad S, Razak IA (2013) 2-Amino-5-bromopyridinium 5-chloro-2-hydroxybenzoate. Acta Crystallographica Section E: Structure Reports Online 69:2–9. https://doi.org/10.1107/S160053681300665X
- Scheme1.png
Scheme 1: Molecular structure of salt I & II.
- Scheme2.png
Scheme 2: Chemical structures of salts with their pKa values and corresponding salts with their ∆pKa values
- SupportingInformation.docx
- checkcifreport.docx