Minimum inhibitory concentration of bacteriocin
According to the results obtained, MIC was in the range of 2200 to 2400 µg against S. aureus and E. coli. Higher activity against S. aureus (228.6 AU/mg) and E. coli (114.3 AU/mg) was noticed in bacteriocin of L. plantarum Cu2-PM7, followed by L. fermentum Cu3-PM8 (139.1 and 69.6 AU/mg against S. aureus and E. coli respectively). Enterococcus faecium DB-b2-15b displayed lowest activity (38.1 and 38.1 AU/mg against S. aureus and E. coli respectively). Based on the data, three cultures viz., Enterococcus durans DB-1aa, L. plantarum Cu2-PM7 and L. fermentum CU3-PM8, showing higher activities were selected for further study.
Proteinaceous nature of antimicrobial peptide from probiotic culture
Proteinaceous nature of the neutralized CFS was confirmed by treating with proteinase K. According to the results obtained, the activity was not lost after neutralization but was significantly reduced on treating with proteinase K. This confirms that the inhibitory activity was not due to acidity but was due to proteinaceous compound.
Growth kinetics and bacteriocin production
The selected cultures entered the late exponential phase in 24 h and remained constant in stationary phase upto 5 days. The OD (optical density) at 600nm is presented in Table 1. Inhibition zone in the range of 12-16 mm dia was observed upto 3 days against S. aureus. On day 4th and 5th, no activity was observed. MIC against S. aureus was 2400 µg for all the tested bacteriocins after 24 h of growth (Table 1). However on the 5th day MIC was 5200, 5000 and 3800 µg for bacteriocin from DB-1aa, Cu2-PM7 and Cu3-PM8 respectively. Activity was highest at 24th h, later the activity gradually decreased. According to the data obtained, maximum activity (266.02 AU/mg) was noticed in L. plantarum Cu2-PM7. The bacteriocin of Cu2-PM7 and Cu3-PM8 showed inhibitory activity against E. coli upto 5 days, but DB-1aa displayed zone of inhibition upto 3 days (Table 1). With increase in incubation days, a gradual reduction in the size of inhibition zone was observed. The MIC was 2400 µg on the 1st day but displayed 5600, 5200 and 3800 µg on the 5th day. The activity was maximum (133.01 AU/mg) with L. plantarum Cu2-PM7 after 24 h of incubation.
Table 1. Antimicrobial activity of selected cultures during growth
|
Culture
|
Incubation period (hours)
|
Optical density at 600 nm
|
Inhibition zone (mm in dia)
|
MIC (µg)
|
Activity (AU/mg protein)
|
|
S. aureus
|
E. coli
|
S. aureus
|
E. coli
|
S. aureus
|
E. coli
|
|
DB-1aa
|
24
|
3.45 ± 0.01
|
16 ± 0.00
|
16 ± 0.01
|
2400 ± 0.02
|
2400 ± 0.11
|
96.00 ± 0.06
|
96.00 ± 0.17
|
|
|
48
|
3.48 ± 0.21
|
14 ± 0.01
|
14 ± 0.01
|
2500 ± 0.04
|
2500 ± 0.05
|
75.90 ± 0.11
|
75.90 ± 0.28
|
|
|
72
|
3.79 ± 0.22
|
12 ± 0.00
|
12 ± 0.00
|
2800 ± 0.12
|
2800 ± 0.06
|
26.04 ± 0.02
|
26.04 ± 0.05
|
|
|
96
|
4.06 ± 0.12
|
-
|
-
|
4900 ± 0.05
|
4900 ± 0.11
|
-
|
-
|
|
|
120
|
3.76 ± 0.11
|
-
|
-
|
5200 ± 0.06
|
5600 ± 0.12
|
-
|
-
|
|
Cu2-PM7
|
24
|
3.38 ± 0.21
|
16 ± 0.01
|
16 ± 0.00
|
2400 ± 0.05
|
2400 ± 0.11
|
266.02 ± 0.11
|
133.01 ± 0.04
|
|
|
48
|
3.48 ± 0.12
|
16 ± 0.01
|
16 ± 0.01
|
2400 ± 0.12
|
2400 ± 0.23
|
198.03 ± 0.14
|
99.01 ± 0.02
|
|
|
72
|
3.61 ± 0.03
|
16 ± 0.01
|
14 ± 0.01
|
2400 ± 0.22
|
2400 ± 0.14
|
80.58 ± 0.12
|
40.29 ± 0.18
|
|
|
96
|
4.18 ± 0.05
|
-
|
12 ± 0.01
|
4500 ± 0.11
|
4500 ± 0.12
|
-
|
37.30 ± 0.11
|
|
|
120
|
4.27 ± 0.11
|
-
|
12 ± 0.00
|
5000 ± 0.22
|
5200 ± 0.11
|
-
|
15.04 ± 0.02
|
|
Cu3-PM8
|
24
|
3.48 ± 0.12
|
15 ± 0.00
|
16 ± 0.00
|
2400 ± 0.15
|
2400 ± 0.15
|
178.8 ± 0.14
|
89.39 ± 0.01
|
|
|
48
|
3.61 ± 0.22
|
15 ± 0.00
|
16 ± 0.00
|
2400 ± 0.12
|
2400 ± 0.21
|
141.9 ± 0.12
|
71.00 ± 0.01
|
|
|
72
|
3.70 ± 0.14
|
15 ± 0.01
|
14 ± 0.01
|
2500 ± 0.14
|
2500 ± 0.05
|
67.32 ± 0.17
|
67.32 ± 0.05
|
|
|
96
|
4.10 ± 0.06
|
-
|
12 ± 0.01
|
3800 ± 0.22
|
3800 ± 0.06
|
-
|
52.57 ± 0.06
|
|
|
120
|
4.25 ± 0.05
|
-
|
12 ± 0.01
|
3800 ± 0.05
|
3800 ± 0.01
|
-
|
25.00 ± 0.11
|
Values are average of two experiments performed individually (Mean ± SD). ‘-‘ indicate no activity.
Extraction of bacteriocin from selected cultures
Bacteriocin from selected cultures was extraction by four different techniques to determine the best method for extraction. Ethanol precipitation did not show any inhibitory activity against S. aureus, however against E. coli lesser zone of inhibition (10 mm dia) was observed (Fig. S1). Comparatively, sample after ammonium sulphate precipitation-dialysis displayed maximum zone of inhibition than chloroform extract and butanol extract (Table 2). MIC against S. aureus was in the range of 1900 – 2200 µg and 2000 – 2300 µg against E. coli. According to the data obtained, ammonium sulphate precipitation-dialysis was found to be the best method for extraction which showed an activity of 155.27, 212.72 and 179.80 AU/mg with E. durans DB-1aa, L. plantarum Cu2-PM7 and L. fermentum Cu3-PM8 respectively. Hence, further step of purification was carried out after ammonium sulphate precipitation and dialysis.
Table 2. MIC and activity of bacteriocin extracted with various methods
|
Culture
|
Extraction method
|
Inhibition zone (mm in dia)
|
MIC (µg)
|
Activity (AU/ mg protein)
|
|
S. aureus
|
E. coli
|
S. aureus
|
E. coli
|
S. aureus
|
E. coli
|
|
E. durans DB-1aa
|
1
|
-
|
10 ± 0.01
|
6200 ± 0.12
|
2800 ± 0.11
|
-
|
60.39 ± 0.11
|
|
|
2
|
12 ± 0.01
|
15 ± 0.02
|
2400 ±0.11
|
2300 ± 0.23
|
34.50 ± 0.00
|
69.00 ± 0.02
|
|
|
3
|
-
|
12 ± 0.01
|
6800 ± 0.21
|
2200 ± 0.12
|
-
|
15.79 ± 0.00
|
|
|
4
|
15 ± 0.01
|
14 ± 0.00
|
2200 ± 0.11
|
2300 ± 0.11
|
155.27 ± 0.02
|
155.27 ± 0.15
|
|
L plantarum Cu2-PM7
|
1
|
-
|
10 ± 0.01
|
6000 ± 0.22
|
3200 ± 0.22
|
-
|
80.47 ± 0.11
|
|
|
2
|
14 ± 0.01
|
15 ± 0.01
|
2300 ± 0.03
|
2300 ± 0.11
|
92.31 ± 0.01
|
92.31 ± 0.09
|
|
|
3
|
12 ± 0.02
|
12 ± 0.00
|
2800 ± 0.05
|
2800 ± 0.05
|
20.29 ± 0.03
|
20.29 ± 0.00
|
|
|
4
|
18 ± 0.01
|
14 ± 0.01
|
1900 ± 0.06
|
2200 ± 0.21
|
319.08 ± 0.11
|
212.72 ± 0.15
|
|
L fermentum Cu3-PM8
|
1
|
-
|
10 ± 0.01
|
6000 ± 0.09
|
3000 ± 0.03
|
-
|
31.76 ± 0.11
|
|
|
2
|
14 ± 0.01
|
14 ± 0.00
|
3200 ± 0.11
|
3200 ± 0.05
|
83.01 ± 0.02
|
83.01 ± 0.11
|
|
|
3
|
12 ± 0.02
|
10 ± 0.01
|
3800 ± 0.12
|
3800 ± 0.11
|
22.33 ± 0.00
|
22.33 ± 0.02
|
|
|
4
|
18 ± 0.02
|
18 ± 0.02
|
2000 ± 0.11
|
2000 ± 0.09
|
179.80 ± 0.11
|
179.80 ± 0.21
|
Values are average of two experiments performed individually (Mean ± SD). ‘-‘ indicate no activity. Extraction methods (1) Ethanol precipitation; (2) Chloroform extract (3) Butanol extraction (4) Ammonium Sulphate precipitation-dialysis
Purification of bacteriocin by ion exchange chromatography
An increase in the inhibition zone size was observed in the dialyzed sample (Fig. S2). Further, ion-exchange chromatography was carried out using DEAE cellulose column as a next step of bacteriocin purification. As shown in Fig. 1, the sample from each culture was separated into three fractions. Protein fraction of DB-1aa was eluted between 0.06 – 0.2 M (fraction 1), 0.24 – 0.4 M (fraction 2) and 0.4 – 1.0 M (fraction 3). In case of Cu2-PM7 elute from 0.06-0.36 M, 0.45 – 0.6 M and 0.63 – 1.0 M was considered as fraction 1, 2 and 3 respectively. Similarly, in Cu3-PM8 fractions from 0.06 – 0.33 M, 0.48 – 0.6 M and 0.63 – 1.0 M was selected. The elute of each peak was collected and concentrated by lyophilization. The antimicrobial activity assay confirmed the zone of inhibition in fraction 1 and 2 of all the three culture against S. aureus and E. coli (Fig. 1). The data obtained revealed highest inhibition zone of 20 and 18 mm against S. aureus and E. coli by fraction-1 of L. plantarum Cu2-PM7 with MIC of 1200 and 1300 µg respectively. The details of purification data are summarized in Table 3. The final yield of bacteriocin obtained after ion-exchange chromatography was 0.4, 0.5 and 0.4% for DB-1aa, Cu2-PM7 and Cu3-PM8 respectively against S. aureus. Correspondingly, a final yield of 0.35, 0.76 and 0.68% was found against E. coli.
Table 3. Summary of bacteriocin purification from selected cultures
|
Isolate
|
Purification step
|
Volume (ml)
|
Activity (AU/ml)
|
Total activity
(AU)
|
Yield (%)
|
Protein (mg/ml)
|
Total protein
(mg)
|
Specific activity
(AU/mg)
|
Purification factor
|
|
DB-1aa
|
CFS
|
5000
|
160
|
800000
|
100.00
|
1.8
|
9000
|
88.90
|
1
|
|
|
AS
|
50
|
160
|
8000
|
1.00
|
1.03
|
51.50
|
155.34
|
1.75
|
|
|
IE
|
5
|
640
|
3200
|
0.4
|
2.62
|
13.10
|
244.27
|
2.75
|
|
Cu2-PM7
|
CFS
|
5000
|
320
|
1600000
|
100.00
|
1.4
|
7000
|
228.57
|
1
|
|
|
AS
|
50
|
240
|
12000
|
0.75
|
0.75
|
37.50
|
320.00
|
1.40
|
|
|
IE
|
5
|
1600
|
8000
|
0.5
|
3.74
|
18.70
|
427.81
|
1.87
|
|
Cu3-PM8
|
CFS
|
5000
|
320
|
1600000
|
100.00
|
2.3
|
11500
|
139.13
|
1
|
|
|
AS
|
50
|
160
|
8000
|
0.5
|
0.89
|
44.50
|
179.77
|
1.29
|
|
|
IE
|
5
|
1280
|
6400
|
0.4
|
4.8
|
24.00
|
266.67
|
1.92
|
|
DB-1aa
|
CFS
|
5000
|
160
|
800000
|
100.00
|
1.8
|
9000
|
88.9
|
1
|
|
|
AS
|
50
|
160
|
8000
|
1.00
|
1.03
|
51.50
|
155.34
|
1.75
|
|
|
IE
|
5
|
560
|
2800
|
0.35
|
2.62
|
13.10
|
213.74
|
2.4
|
|
Cu2-PM7
|
CFS
|
5000
|
160
|
800000
|
100.00
|
1.4
|
7000
|
114.29
|
1
|
|
|
AS
|
50
|
160
|
8000
|
1.00
|
0.75
|
37.50
|
213.33
|
1.87
|
|
|
IE
|
5
|
1216
|
6080
|
0.76
|
3.74
|
18.70
|
325.13
|
2.84
|
|
Cu3-PM8
|
CFS
|
5000
|
160
|
800000
|
100.00
|
2.3
|
11500
|
69.56
|
1
|
|
|
AS
|
50
|
160
|
8000
|
1.00
|
0.89
|
44.50
|
179.77
|
2.58
|
|
|
IE
|
5
|
1088
|
5440
|
0.68
|
4.8
|
24.00
|
226.67
|
3.26
|
Effect of temperature and pH on bacteriocin activity
According to the results obtained, the bacteriocins from all the tested cultures were active in all the temperature tested (Table 4). However, bacteriocin from Cu3-PM8 showed slight reduction in the activity at higher temperature. Further, the pH stability of bacteriocin purified from selected probiotic culture was analyzed at various pH ranging from pH 3-10 (Table 5). The data revealed that the inhibitory activity was more active at acidic pH (inhibition zone ranging from 14-20 mm dia). As the pH approached neutral, the activity reduced and was completely inhibited at alkaline pH.
Table 4. Stability of bacteriocin at different temperature
|
Temperature (°C)
|
Inhibitory activity against Staphylococcus aureus
|
|
Inhibition zone (mm dia)
|
Activity (AU/mg protein)
|
|
DB-1aa
|
Cu2-PM7
|
Cu3-PM8
|
DB-1aa
|
Cu2-PM7
|
Cu3-PM8
|
|
30
|
15 ± 0.01
|
15 ± 0.00
|
15 ± 0.01
|
240.12 ± 0.09
|
426.20 ± 0.11
|
263.12 ± 0.01
|
|
40
|
15 ± 0.00
|
15 ± 0.00
|
15 ± 0.01
|
244.12 ± 0.12
|
429.30 ± 0.12
|
265.73 ± 0.11
|
|
50
|
15 ± 0.02
|
15 ± 0.01
|
15 ± 0.01
|
242.03 ± 0.11
|
425.20 ± 0.11
|
261.42 ± 0.15
|
|
60
|
15 ± 0.01
|
15 ± 0.02
|
15 ± 0.00
|
252.02 ± 0.14
|
419.70 ± 0.15
|
260.12 ± 0.12
|
|
70
|
15 ± 0.01
|
15 ± 0.01
|
15 ± 0.02
|
241.15 ± 0.05
|
415.60 ± 0.21
|
261.12 ± 0.21
|
|
80
|
15 ± 0.01
|
15 ± 0.00
|
15 ± 0.02
|
252.05 ± 0.12
|
411.07 ± 0.15
|
260.09 ± 0.14
|
|
90
|
15 ± 0.01
|
15 ± 0.01
|
15 ± 0.00
|
226.70 ± 0.11
|
409.10 ± 0.06
|
255.02 ± 011
|
|
|
Inhibitory activity against E. coli
|
|
|
DB-1aa
|
Cu2-PM7
|
Cu3-PM8
|
DB-1aa
|
Cu2-PM7
|
Cu3-PM8
|
|
30
|
12 ± 0.00
|
15 ± 0.00
|
12 ± 0.01
|
239.72 ± 0.12
|
322.15 ± 0.11
|
220.09 ± 0.11
|
|
40
|
12 ± 0.01
|
15 ± 0.00
|
12 ± 0.01
|
242.43 ± 0.15
|
325.60 ± 0.21
|
227.12 ± 0.21
|
|
50
|
12 ± 0.02
|
15 ± 0.01
|
15 ± 0.01
|
241.03 ± 0.16
|
322.30 ± 0.11
|
225.03 ± 0.11
|
|
60
|
10 ± 0.02
|
15 ± 0.02
|
12 ± 0.01
|
223.12 ± 0.11
|
320.46 ± 0.22
|
222.12 ± 0.11
|
|
70
|
10 ± 0.11
|
15 ± 0.02
|
10 ± 0.00
|
212.06 ± 0.16
|
319.60 ± 0.06
|
209.73 ± 0.11
|
|
80
|
10 ± 0.00
|
15 ± 0.01
|
10 ± 0.00
|
207.05 ± 0.21
|
319.00 ± 0.09
|
152.42 ± 0.06
|
|
90
|
10 ± 0.00
|
15 ± 0.01
|
10 ± 0.01
|
200.18 ± 0.11
|
312.90 ± 0.11
|
169.12 ± 0.09
|
Values are average of two experiments performed individually (Mean ± SD).
Table 5. Stability of bacteriocin at different pH
|
pH
|
Inhibitory activity against Staphylococcus aureus
|
|
Inhibition zone (mm dia)
|
Activity (AU/mg protein)
|
|
DB-1aa
|
Cu2-PM7
|
Cu3-PM8
|
DB-1aa
|
Cu2-PM7
|
Cu3-PM8
|
|
3
|
15 ± 0.00
|
15 ± 0.01
|
18 ± 0.01
|
242.12 ± 0.11
|
422.12 ± 0.11
|
269.72 ± 0.02
|
|
4
|
15 ± 0.01
|
15 ± 0.00
|
15 ± 0.00
|
245.72 ± 0.05
|
427.32 ± 0.21
|
266.32 ± 0.11
|
|
5
|
15 ± 0.01
|
15 ± 0.00
|
15 ± 0.01
|
248.62 ± 0.11
|
426.32 ± 0.14
|
265.42 ± 0.22
|
|
6
|
14 ± 0.01
|
14 ± 0.01
|
14 ± 0.01
|
240.12 ± 0.14
|
412.43 ± 0.06
|
252.42 ± 0.09
|
|
7
|
-
|
10 ± 0.01
|
-
|
110.12 ± 0.21
|
400.23 ± 0.06
|
112.6 ± 0.11
|
|
8
|
-
|
-
|
-
|
12.13 ± 0.11
|
32.0 ± 0.05
|
-
|
|
9
|
-
|
-
|
-
|
-
|
-
|
-
|
|
10
|
-
|
-
|
-
|
-
|
-
|
-
|
|
|
Inhibitory activity against E. coli
|
|
DB-1aa
|
Cu2-PM7
|
Cu3-PM8
|
DB-1aa
|
Cu2-PM7
|
Cu3-PM8
|
|
3
|
14 ± 0.00
|
20 ± 0.02
|
12 ± 0.00
|
240.12 ± 0.12
|
326.70 ± 0.12
|
220.60 ± 0.14
|
|
4
|
14 ± 0.01
|
14 ± 0.01
|
12 ± 0.01
|
244.72 ± 0.06
|
322.42 ± 0.05
|
222.60 ± 0.15
|
|
5
|
14 ± 0.01
|
14 ± 0.00
|
12 ± 0.01
|
242.62 ± 0.14
|
319.06 ± 0.11
|
226.00 ± 0.12
|
|
6
|
14 ± 0.01
|
14 ± 0.00
|
12 ± 0.00
|
240.32 ± 0.06
|
315.20 ± 0.22
|
215.90 ± 0.15
|
|
7
|
14 ± 0.00
|
-
|
-
|
239.63 ± 0.15
|
109.20 ± 0.21
|
109.30 ± 0.06
|
|
8
|
-
|
-
|
-
|
62.02 ± 0.12
|
32.60 ± 0.11
|
22.60 ± 0.02
|
|
9
|
-
|
-
|
-
|
-
|
-
|
-
|
|
10
|
-
|
-
|
-
|
-
|
-
|
-
|
Values are average of two experiments performed individually (Mean ± SD). ‘-‘ indicate no activity
Effect of enzymes on bacteriocin activity
According to the data obtained, the inhibitory activity was retained in all the three bacteriocin after treating with a-amylase and lipase. However, in presence of trypsin 55, 34 and 43% activity was retained.
SDS-PAGE analysis of antimicrobial compound
Molecular weight of the antimicrobial compound from selected probiotic culture (Cu2-PM7 and Cu3-PM8) was determined by SDS-PAGE (Fig. 2). Accordingly, apparent molecular weight of both antimicrobial peptide was found to be 3.5 kDa. Inhibition zone corresponding to their respective protein bands was developed on performing activity assay by overlaying indicator strain (Fig. 2).
Detecting plantaricin gene by PCR
PCR analysis of plantaricin gene was carried out in Cu2-PM7 using plnA and P1/P4 primer. A good amplification of 450 bp was observed with plnA F/R primer. On the other hand, no amplification was detected with P1/P4 primer. The control culture, E. durans DB-1aa did not show any amplification in presence of any of the tested primer. Further, the PCR product was sequenced and the obtained sequence was subjected to BLASTn search in NCBI database and aligned with hit sequences. The results indicated 100% homology with plantaricin plnA sequence of Lactobacillus plantarum strain EG.LP 18.7 (MN172266.1) (Fig. 3).
The nucleotide sequence was translated to amino acid sequence and checked for homology with BLAST search. Translated partial amino acid sequence of plnA gene of Cu2-PM7 displayed 48 amino acid sequence which had 100% similarity with plantaricin A of L. plantarum (WP_0036419). Fig. 4 represents the similarity of plnA-PM7 amino acid sequence with related sequence from NCBI data base.
Bacteriocin peptide analysis
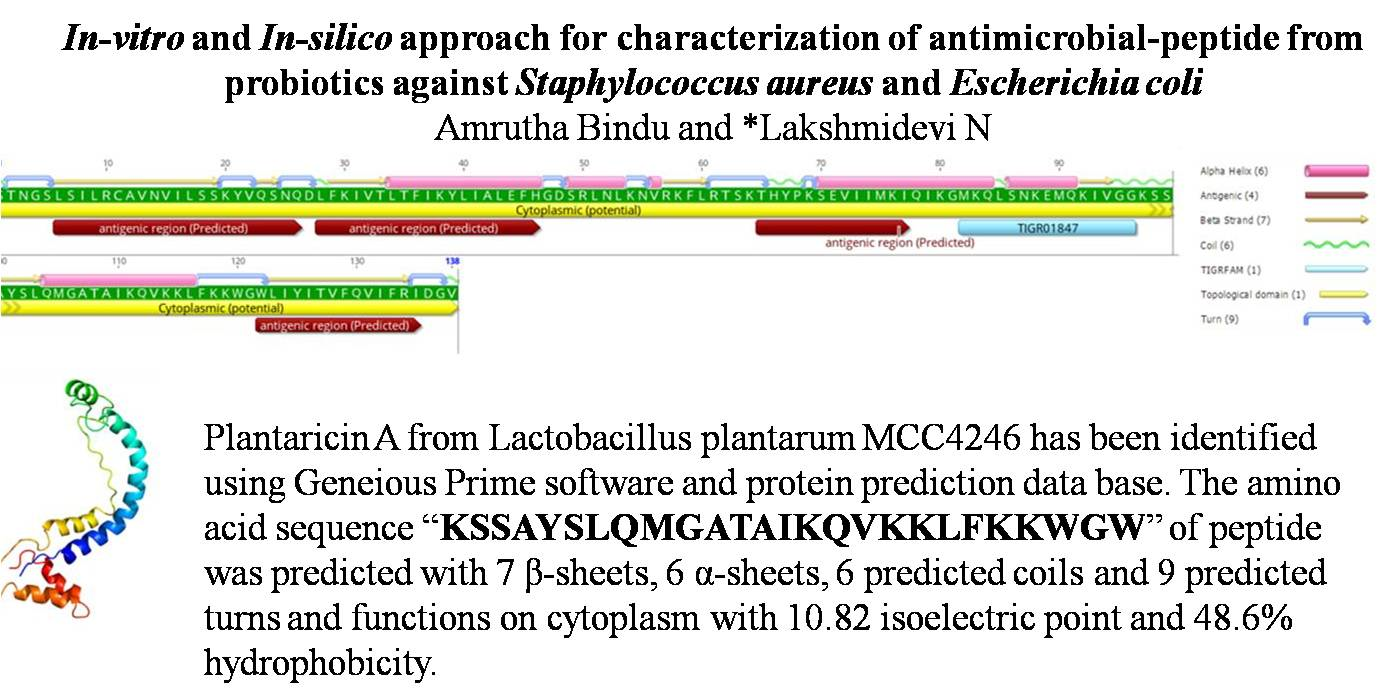
The translation of plnA gene sequence gave 138 amino acids which were studied for its structural and functional properties. It was observed that the partial sequence of Cu2-PM7 possessed isoelectric point of 10.82 and 48.6% hydrophobicity. The sequence possessed 7 β sheets, 6 α sheets, 6 predicted coils and 9 predicted turns and functions on cytoplasm. One topological domain, which encodes the bacteriocin-like signal sequence (MKQLSNKEMQKIVGG) was noticed with a GG cleavage motif at their N-terminal region. Further, four antigenic regions were detected in the acquired sequence which were located at sites 6-26, 28-46, 65-77 and 122-135 with sequence read LSILRCAVNVILSSKYVQSNQ, LFKIVTLTFIKYLIALEFH, THYPKSEVIIMKI and WLIYITVFQVIFRIDGV, respectively. A 3D structure for the bacteriocin-like peptide was inferred from Phyre2 and indicated alpha and beta sheet structure fragments (Fig. 5). The protein-predict database showed maximum homology towards bacteriocin plantaricin A of Lactobacillus plantarum WCFS1, with the ID P80214. Hence, it can be perceived that the amino acid sequence stretch of our native isolate Cu2-PM7 possessed “KSSAYSLQMGATAIKQVKKLFKKWGW” peptide showing a molecular weight of 3 kDa.