There were a total of 168 deliveries in the hospital in February 2014, of which 51 women delivered spontaneously, 10 had instrumental delivery (forceps in 8 cases and vacuum in 2 cases), and 107 went through C-section. The final number of women who consented to participate in our survey was 117 (69.64%). Their demographic characteristics are presented in Table 1. The majority of respondents were between 26 and 35 years of age (63.3%), worked in the private sector, either as employees or business owners (69.3%), and were graduates of higher education (67.5%). 63.9% of them were in the middle-income category (64.1%) at the time of the survey, married (81.2%), and lived in urban areas (79.5%).
3.1. Preferred versus actual mode of delivery
Parenting classes were pursued by 22.2% (n=26) of respondents, 95.7% (n=112) mentioned having undergone laboratory tests, and 92.3% (n=108) mentioned a full ultrasound screening. In the third trimester of pregnancy, for all women, a birth plan was established with the doctor. Patients may state their delivery options, including C-section on request. The C-section on request is not reimbursed by the National Health Insurance House in Romania, and it cannot be specified in the partograph.
On the day of labor ward admission, 70.1% (n=82) of women preferred vaginal birth, 28.2% (n=33) preferred C-section and two women (1.7%) did not respond to this question. Younger and more educated women, mostly living in urban areas and in the low to middle-income categories, showed a higher preference for vaginal birth (Table 2).
Out of the 117 respondents, 55.6% (n=65) had vaginal births and 44.4% (n=52) had C-sections (Table 3 and Figure 1). For 19 cases, the preferred way of delivery was different from the actual mode of delivery. None of the women who chose C-section had undergone vaginal birth.
The non-parametric significance tests show that the initial preferences of women for vaginal birth versus C-section were significantly different, and the highest preference was for a vaginal birth – Chi-square test value=60.61, p<0.05). The V-square test, which corrects for sample size and uncertainty, confirms the results of the Chi-square test (value=59.64, p<0.05) The McNemar Chi-square test shows a significant difference (value=9.81, p<0.05) between the preference for a delivery method and the actual birth method.
Concerning the patients’ understood indication for C-section, the profile of the 41 respondents is the following: 83.7% were aged below 35 years, lived in urban areas, had lower to middle income, and were more educated (76.7% were graduates of tertiary education). Out of them, 16 (39%) preferred natural birth, and 25 (60.9%) preferred C-section. Of the 16 women that preferred natural birth and stated an indication for C-section, 3 (18.7%) gave birth by vaginal way, and 13 (81.3%) gave birth by C-section. All women that preferred C-section and declared an indication for C-section gave birth this way.
C-section on request was preferred by 6.8% (n=8) of women. They were aged below 35 years, were graduates of higher education, and 6 out 8 had middle to high income and lived in urban areas. Five out of 8 were married, two were in a partnership, and all were giving birth to their first child. Seven out of these 8 women stated they did not have an indication for C-section, and 1 declared an indication. For all 8 women, C-section indications were not concordant when patients’ and doctors’ indications in medical records were compared.
Scarred uterus is the most frequent indication for C-section (30.76 % of C-sections) and all breech presentations were delivered by C-section, although some patients would have preferred a natural birth. Taking out the indications for scarred uterus and breech presentation, there were 22 primipara s with non-concordant C-section indications between preferred and actual mode of birth, 7 of them (31.8%) preferred natural birth and 15 (68. 2%) preferred C-section. The most frequent non-concordant C-section indications when patients’ and medical records were compared were: placenta praevia, oligohydramnios < 39 weeks and failed induction of labor.
Almost half of women that preferred vaginal birth (49=59.8%) and 48.5% of women that preferred C-section chose epidural anesthesia. Most women that preferred vaginal birth also preferred epidural anesthesia - 59.5% (n=49); 38 of them (77.6%) had vaginal birth, while 11 (22.4%) had C-section.Eighteen out of 33 women (54.5%) that preferred C-section were primipara, and all of them gave birth by C-section.
The professional doctor's degree is an essential factor from the perspective of preferred versus actual type of birth. There were 58 (49.6%) patients attended by consultants, 29 (24.8%) attended by specialists, 18 (15.4%) by young senior doctors, and the remaining 12 (10.3%) by residents. Differences between preferred versus actual birth modes of delivery occurred for consultants (8 cases), specialists (7 cases), and young senior doctors (2 cases).
The time spent in the labor room was between 30 minutes (13 women = 11.2%) to more than 24 hours (1 woman = 0.9%). We used a cut-off of 5 hours to divide the patients; 46.1% of our respondents spent more than 5 hours in the labor room, while 53% of them spent less than 5 hours.
Fifty-two women (44.4%) gave birth during working hours (DW) (8 a.m. – 3 p.m.), 39 births (33.3%) occurred during the evening shift (AOD - 3 to 10 p.m.) and 26 births (22.2%) during the night shift (AON - 10 p.m. to 8 a.m.). There were more C-sections than vaginal births performed DW, but more vaginal births than C-sections were performed after working hours. The concordant births (preferred versus preferred) took place mostly AOD for vaginal births (25), but DW for C-sections (23) – Figure 2.
3.2. Modes of delivery and patients' birth perception
Respondents had a good and very good assessment on giving birth in the hospital assessed on a 0-10 scale– 64.1% (n=75) offerred a grade of 9 or 10 out of 10 (Very good), and 17.9 % (n=21) graded giving birth by a 7 or 8 (Good). Only 3 patients (2.6%) offered a non-satisfactory grade (below 5 out of 10). Similarly, 41 patients (35.0%) rate the pain felt during birth as having very low intensity (Very good), and 26 (22.2%) rated the pain as having low intensity (Good). Still, 18 patients (15.4%) appreciated the pain as having very high intensity (Not satisfactory), and 14 considered it intense (12.0%) and graded it as Satisfactory.
The two assessments are highly correlated – see Table 4, as most patients that rated the birth with Very good and Good also evaluated the pain on high satisfaction note (63=53.8%). Mean scores for birth assessment are different (p≤0.05) for Very good and Satisfactory, as well as between Good and Satisfactory birth pain assessments.
Both birth and birth pain assessments are linked to the preferred and actual modes of delivery. 81.7% of women that preferred vaginal birth and 81.8% of women that preferred C-section rated birth with Very good and Good. Proportions are very similar when we consider the actual mode of delivery. Patients that preferred C-section rated higher their birth experience than women preferring vaginal birth – mean score 9.206 (SD=1.633) versus 8.743 (SD=1.843), p>0.05. Similar results are obtained based on patients’ actual mode of delivery.
Patients distinguish clearly between birth pain alone and their overall birth experience; they rate pain on the lower part of the scale, although birth experience is evaluated on a higher note. Patients' mean scores for their birth pain depending on their preferred mode of delivery are 7.535 (SD=2.756) for vaginal birth and 6.111 (SD=3.745) for C-section; thus, patients that would have chosen C-section assessed lower their birth pain (p<0.05). The mean scores based on the actual mode of delivery are 7.625 (SD=2.666) for vaginal birth and 6.511 (SD=3.501) for C-section (p>0.05).
Also, the concordance between modes of delivery (preferred versus actual) plays a role in patients' assessment of their birth and birth pain. The percentage of patients that gave birth by their desired mode and rated their birth experience Good and Very good is 82.8%, against only 75% for patients that gave birth by C-section but would have preferred vaginal birth. 57.6% of patients whose modes of delivery are concordant rated birth pain as Good and Very good, compared to 56.3% of patients that gave birth by C-section but stated a preference for vaginal birth. Women with concordant modes of delivery have a slightly lower average score than women that gave birth by the other mode - 8.855 (SD=1.693) to 9.000 (SD=2.449), not statistically different -, but birth pain scores are identical for both categories: for vaginal birth 7.143 (SD=3.10) and C-section 7.143 (SD=3.25).
The epidural anesthesia during labor changes patients' perception of birth significantly, but not of birth pain. The average birth score of patients with epidural anesthesia was 9.22 (SD=1.15) and the average score of patients without anesthesia was 8.35 (SD=2.30) - both in the Good category (p≤0.05). However, the average score for birth pain of patients without epidural anesthesia is higher than the score patients without anesthesia (7.57 (SD=2.94) against 6.79 (SD=3.08).
Most women that spent less than 5 hours in the labor room - 83% (n=39) – rate their birth as Very good compared to 61.4% (n=35) women that spent more than 5 hours in the room. Less time spent in the labor room leads to a better assessment of birth experience - 9.15 (SD=1.73) against 8.63 (SD=1.80) -, but a longer time spent in the labor room means a better score for birth pain - 7.73 (SD=2.74) against 6.57 (SD=3.29).
The relationship between birth assessment and birth time is shown in Figure 3. Women that gave birth DW rated higher their birth (74.4% rate birth as Very good), followed by women that gave birth AOD (69.4%), and patients that gave birth AON (68.2%). The highest percentage of women that were not satisfied with their births is also found for births DW (10.6%). Birth pain ranking is maintained for very satisfied patients: births AOD (47.1%), births DW (38.4%), and births AON (32%). If we include Good assessments of birth and birth pain, women that gave birth AON were the most satisfied by their birth experience followed by patients that gave birth AOD, and patients that were giving birth DW. Birth pain was best perceived by women giving birth AOD, followed by women giving birth AON and women giving birth DW. The largest proportion of unsatisfied women by their birth pain is found for patients that gave birth DW. The average scores of patients' assessment of their birth and birth pain depending on the time of birth indicate that women rate the highest births AON (9.04) compared to births during daytime (8.83 is the score for DW and AOD). Birth pain is best rated for AOD (7.73), followed by AON (7.33) and DW (6.59).
Doctors' professional categories, birth experience, and birth pain scores are compared in Figure 4. Young senior doctors and residents received the best scores for birth – 9.00 (SD=1.46) and 9.08 ((SD=1.08) - and birth pain – 8.06 (SD=1.98) and 7.82 (SD=2.32). Specialist doctors had the lowest mean score for birth – 8.80 (SD=1.86), but only a slightly higher mean score for birth pain compared to consultants – 7.04 (SD=3.17) against 6.72 (SD=3.48).
3.3. Relationship between patients and medical personnel in the delivery room
Patients rated the obstetricians highly – mean score 9.93 (SD=0.35). Anesthetists were appreciated with a mean score of 9.69 (SD=0.80). In the case of midwives, 88.9% were very good rated, 6% were rated good, and one patient rated the midwife as satisfactory – mean score 9.73 (SD=0.76). The scores are significantly different (p≤0.05) between obstetricians and anesthetists, as well as between obstetricians and midwives. The patient that offered lower ratings for the obstetrician delivered by vaginal birth, as desired, and rated the birth with an 8 and birth pain with a 7.
Patients that preferred C-section offered higher mean scores for the medical personnel, compared to patients that preferred vaginal birth (p>0.05) – 9.97 (SD=0.400) against 9.91 (SD=0.18) for obstetricians, 9.69 (SD=0.99) against 9.69 (SD=0.68) for anaesthetists, and 9.75 (SD=0.67) versus 9.72 (SD=0.80) for midwives. Similarly, patients that gave birth by C-section scored higher the medical personnel than patients that had a vaginal birth (p>0.05) – 9.98 (SD=0.45) against 9.88 (0.14) for obstetricians, 9.76 (SD=0.84) against 9.59 (SD=0.74) for anaesthetists, and 9.76 (SD=0.68) versus 9.71 (SD=0.82) for midwives. Although non-concordant birth patients assessed higher the obstetricians compared to concordant birth patients, concordance is not a discriminatory factor for medical personal assessment.
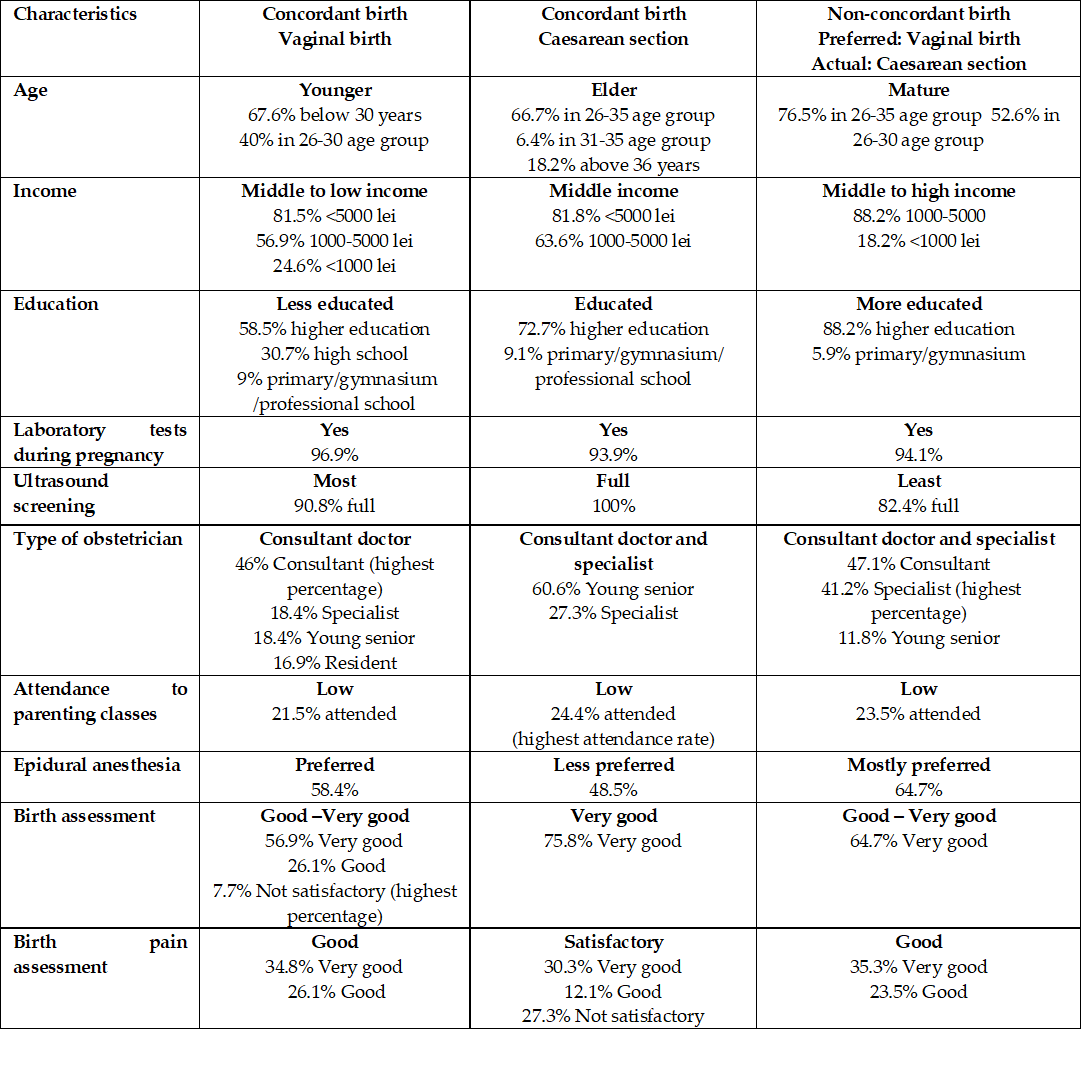
3.4. Patients' profiles regarding preferred versus the actual way of birth
Patients with concordant vaginal births are younger, in the middle to low-income category, less educated, but have undergone all recommended screening during their pregnancies (Table 5). They were attended mostly by consultants and preferred epidural anesthesia. They assessed birth experience as Good to Very good and birth pain as Good.
Patients with C-section as preferred and actual mode of delivery (concordant) are in an elder group, with middle income mostly, and educated. They had laboratory tests, and all of them underwent a full ultrasound screening. They were attended mostly by consultants, but also specialists, and were the group with the lowest preference for epidural anesthesia. They highly assessed their birth but rated birth pain as Satisfactory only.
The patients with non-concordant modes of delivery (they preferred vaginal birth, but gave birth by C-section) were mature women (mostly aged between 26 and 35 years old), in the middle to high-income category, more educated than the ones in the previous two groups (88.2% of them were graduates of tertiary education). Although almost all had laboratory tests during their pregnancies, 17.6% did not have a full ultrasound screening. Most preferred epidural anesthesia, and assessed their birth as Good to Very good and their birth pain as Good.
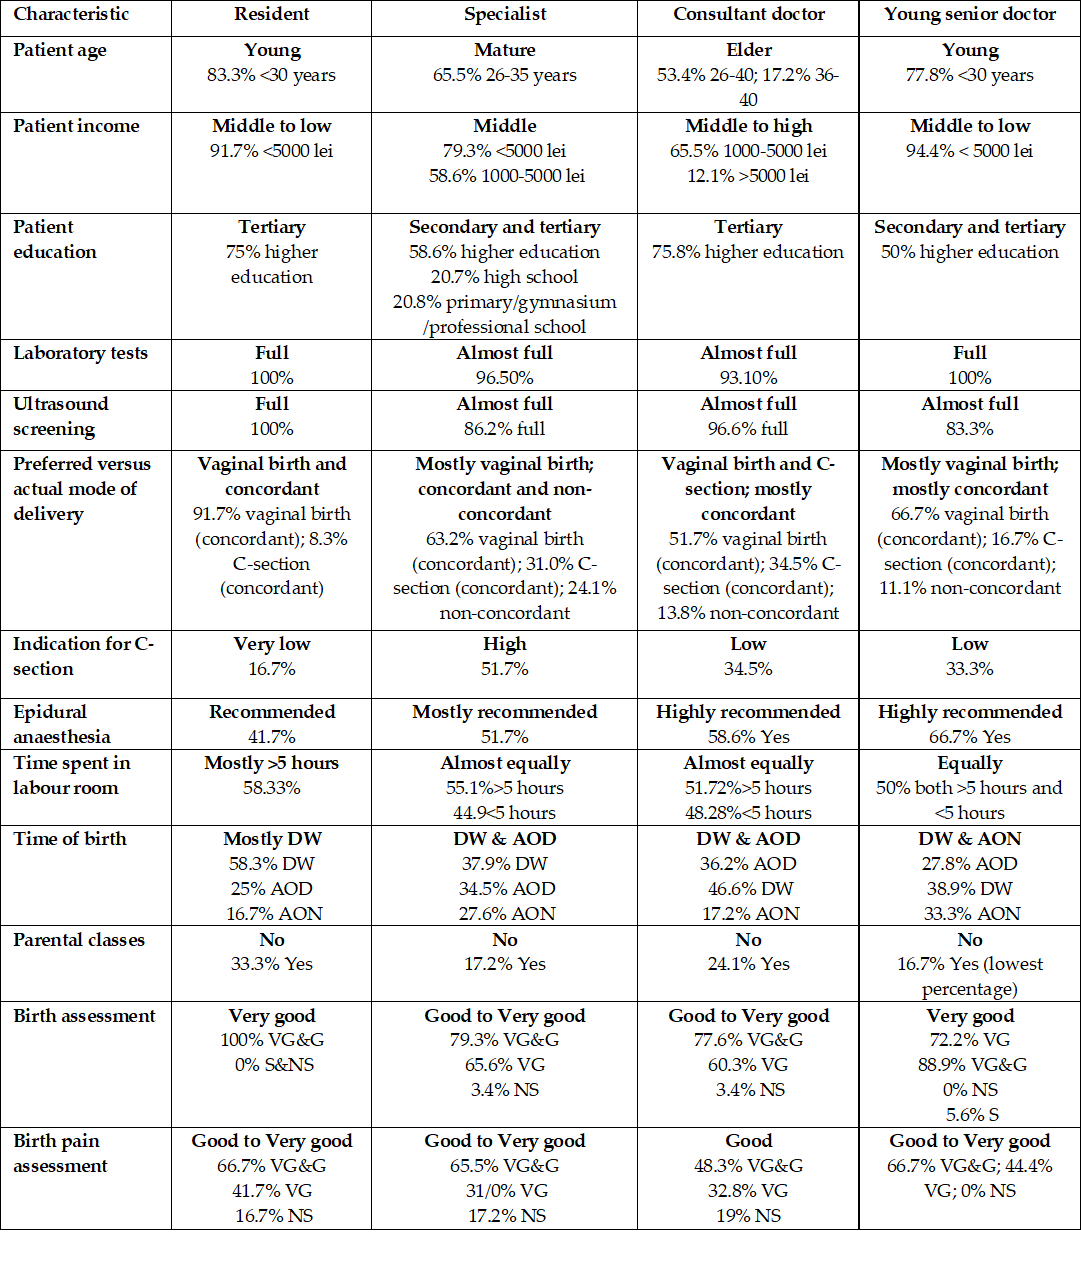
3.5. Doctors' professional degree and birth characteristics
Resident and young senior doctors tend to be somewhat similar in profile – Table 6. They both attended younger patients, in the middle to the low-income category, which have undergone full sets of laboratory tests during pregnancy. Their birth is mostly vaginal and concordant, and they received Good to Very good assessment for deliveries and birth pain.
Specialists and consultant doctors also share characteristics. The women they attended were more mature, in the middle to high-income category, mostly with higher education and with full prenatal test screenings. These doctors attended the largest share of non-concordant births. Their patients assessed in somewhat similar manner birth experiences and birth pain (Good to Very good for both types of doctors in case of birth; birth pain is considered Good to Very good for specialists, but only Good for primary doctors).