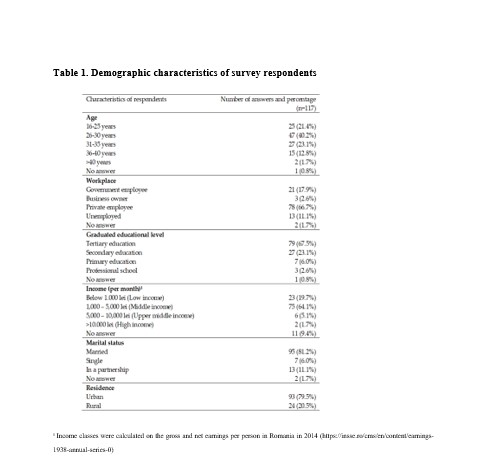
There were 168 deliveries in the hospital in February 2014, of which 51 spontaneously, 10 instrumental vaginal delivery (forceps in 8 cases and vacuum in 2 cases), and 107 through C-section. The final number of women who consented to participate in our survey was 117 (69.64%). Their demographic characteristics are presented in Table 1. 63.3% of respondents were between 26 and 35 years of age (worked in the private sector, as employees or business owners (69.3%), and were higher education graduates (67.5%). 64.1% of them were in the middle-income category, married (81.2%), and lived in urban areas (79.5%).
Table 1. Demographic characteristics of survey respondents
On the day of labor ward admission, according to the birth plan established in the third trimester with the doctor, 70.1% (n=82) of women preferred vaginal birth, 28.2% (n=33) preferred C-section and two women (1.7%) did not respond. Younger and more educated women, mostly living in urban areas and the low to middle-income categories, showed a higher preference for a vaginal birth (Table 2).
Table 2. Respondents' characteristics depending on the mode of delivery choice
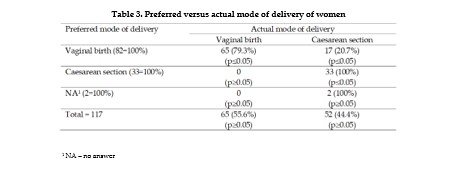
Out of the 117 respondents, 55.6% (n=65) had vaginal births and 44.4% (n=52) had C-sections (Table 3 and Figure 1). For 19 patients, the preferred and actual ways of delivery were different. None of the women who chose C-section had undergone vaginal birth.
Table 3. Preferred versus actual mode of delivery of women
Figure 1. Sample structure based on preferred versus actual mode of delivery
The non-parametric significance tests show that the initial preferences of women for vaginal birth versus C-section were significantly different, and the highest preference was for vaginal birth – Chi-square test value=60.61, p<0.05). The V-square test, which corrects for sample size and uncertainty, confirms the results of the Chi-square test (value=59.64, p<0.05). The McNemar Chi-square test shows a significant difference (value=9.81, p<0.05) between the preference for a delivery method and the actual birth method.
Concerning patients’ stated indication for C-section, the profile of the 41 respondents is the following: 83.7% were aged below 35 years, lived in urban areas, had lower to middle income, and were more educated (76.7% were graduates of tertiary education). Out of them, 16 (39%) preferred natural birth, and 25 (60.9%) preferred C-section. Of the 16 women that preferred natural birth and stated an indication for C-section, 3 (18.7%) gave birth by vaginal way, and 13 (81.3%) gave birth by C-section. All women that preferred C-section and declared an indication for C-section gave birth this way.
C-section on request was preferred by 6.8% (n=8) of women. They were aged below 35 years, were higher education graduates, 6 out 8 had middle to high income and lived in urban areas. Five out of 8 were married, two were in a partnership, and all were giving birth to their first child. Seven out of these 8 women stated no indication for C-section, and 1 declared an indication. For all 8 women, C-section indications were not concordant when patients’ and doctors’ indications in medical records were compared.
Scarred uterus is the most frequent indication for C-section (30.76 % of C-sections) and all breech presentations were delivered by C-section, although some patients would have preferred a natural birth. Besides these indications, there were 22 primiparas with non-concordant C-section indications between preferred and actual mode of birth; 7 of them (31.8%) preferred natural birth and 15 (68. 2%) preferred C-section. The most frequent non-concordant C-section indications were placenta praevia, oligohydramnios < 39 weeks, and failed induction of labor.
Almost half of women that preferred vaginal birth (49=59.8%) and 48.5% of women that preferred C-section chose epidural anesthesia. Most women that preferred vaginal birth also preferred epidural anesthesia - 59.5% (n=49); 38 of them (77.6%) had vaginal birth, while 11 (22.4%) had C-section. Eighteen out of 33 women (54.5%) that preferred C-section were primipara, and all of them gave birth by C-section.
Time spent in the labor ward, birth pain perception and professional doctors’ degree are presented from women’s perspective of preferred versus actual type of birth (Table 4). Patients with concordant vaginal births are younger, in the middle to low-income category, less educated, but have undergone all recommended screening during their pregnancies. They were attended mostly by consultants and preferred epidural anesthesia. They assessed birth experience as Good to Very good and birth pain as good. Patients with concordant C-section are in an elder group, with middle income mostly, and educated. They were attended mostly by consultants and specialists, and have the lowest preference for epidural anesthesia. They assess highly their birth but rate birth pain as Satisfactory only. The patients with non-concordant modes of delivery are mature women (mostly aged between 26 and 35 years old), in the middle to high-income category, and more educated. They mostly preferred epidural anesthesia, assessed their birth as Good to Very good, and their birth pain as Goo
Table 4. Patients' profiles depending on preferred versus actual mode of delivery
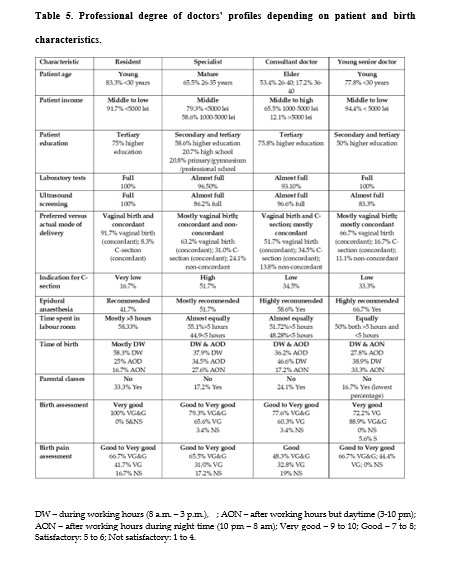
Table 5 presents professional degree of doctors' profiles depending on patient and birth characteristics. Resident and young senior doctors attended younger patients, in the middle to low-income category, which have undergone full sets of laboratory tests during pregnancy. They delivered mostly vaginal and concordant births, and received Good to Very good assessment for deliveries and birth pain. Specialists and consultant doctors attended more mature women, in the middle to high-income category, mostly with higher education and full prenatal test screenings. They attended the largest share of non-concordant births. Their patients assess in a somewhat similar manner birth experiences and birth pain.
Table 5. Professional degree of doctors' profiles depending on patient and birth characteristics.
Fifty-two women (44.4%) gave birth during working hours (DW – 8 a.m. – 3 p.m.), 39 births (33.3%) occurred during the evening shift (AOD - 3 to 10 p.m.) and 26 births (22.2%) during the night shift (AON - 10 p.m. to 8 a.m.). There were more C-sections than vaginal births performed DW, but more vaginal births than C-sections were performed after working hours. Concordant births took place mostly AOD for vaginal births (25), but DW for C-sections (23) – Figure 2.
Figure 2. Preferred versus actual modes of delivery and birth times
Patients distinguish clearly between birth pain alone and their overall birth experience; they rate pain on the lower part of the scale, although birth experience is evaluated on a higher note. Patients' mean scores for their birth pain are 7.535 (SD=2.756) for vaginal birth and 6.111 (SD=3.745) for C-section; thus, patients that would have chosen C-section assessed lower their birth pain (p<0.05). The mean scores based on the actual mode of delivery are 7.625 (SD=2.666) for vaginal birth and 6.511 (SD=3.501) for C-section (p>0.05).
Birth pain is best rated for AOD (7.73), followed by AON (7.33) and DW (6.59). The largest proportion of unsatisfied women by their birth pain is found for patients that gave birth DW. The average scores of patients' assessment of their birth and birth pain depending on the time of birth indicate that women rate the highest births AON (9.04) compared to births during daytime (8.83 is the score for DW and AOD).
Patients that preferred C-section offer higher mean scores for the medical personnel, compared to patients that preferred vaginal birth (p>0.05) – 9.97 (SD=0.40) against 9.91 (SD=0.18) for obstetricians, 9.69 (SD=0.99) against 9.69 (SD=0.68) for anaesthetists, and 9.75 (SD=0.67) versus 9.72 (SD=0.80) for midwives. Similarly, patients that gave birth by C-section scored higher the medical personnel than patients that had a vaginal birth (p>0.05) – 9.98 (SD=0.45) against 9.88 (0.14) for obstetricians, 9.76 (SD=0.84) against 9.59 (SD=0.74) for anaesthetists, and 9.76 (SD=0.68) versus 9.71 (SD=0.82) for midwives. Overall, though, concordance is not a discriminatory factor for personal medical assessment.