Clinical characteristics and pyrosequencing data summary
Characteristics of the 28 IR patients, 30 INR patients and 36 health controls, including demographics, clinical characteristics, and pyrosequencing results were summarized in Table 1. There was no significant difference between the rate of the transmission route in the IR and INR groups (p=0.779). The rate of MSM transmission route was 57.1% vs 51.7% in the INR and IR group, while the rate of the heterosexual (HTS) transmission route was 20.7% vs 21.4%, and others were missing from their records. The viral load of all HIV-infected individuals on ART was not detected. Nadir and current CD4+ T cell counts were significantly higher in the IR group than that of INR group (Table 2). No differences in duration of ART and ongoing ART regimen were observed between the IR and INR groups. Other characteristics such as gender, age and body mass index (BMI) were generally matched among the IR, INR and control group.
Total 3,549,077 high-quality sequences were obtained (average sequence length 440 bp) from 94 participants. Average of 38,849 sequences per sample from the control subjects, while 35,947 and 38,134 sequences per sample were obtained from the IR and INR patients. Rarefaction was conducted on the OTU table to 30,174 reads per sample to avoid methodological artefacts. Specifically, 609 OTUs in the control group, while 486 OTUs and 567 OTUs in IR and INR group respectively were defined at a 97% similarity level. Significant difference of bacterial diversity (Shannon, Simpson, and Sobs), richness (ACE, Chao1) and Good’s coverage were observed among the three groups, while there was no significant difference found between the IR and INR groups. The summary information was shown in Table 2.
Compositional analysis of fecal microbiota
Principal coordinate (PCoA) analysis by weighted UniFrac matrices showed obvious differentiation of bacterial communities between the IR and control groups (PERMANOVA, pseudo-F: 8.99, R2=0.13, P =0.001, Fig.1a), the INR and control groups (PERMANOVA, pseudo-F: 8.77, R2=0.12, P =0.001, Fig.1b); while no significant difference were observed between the IR and INR groups (PERMANOVA, pseudo-F: 0.80, R2=0.01, P =0.71, Fig. 1c).
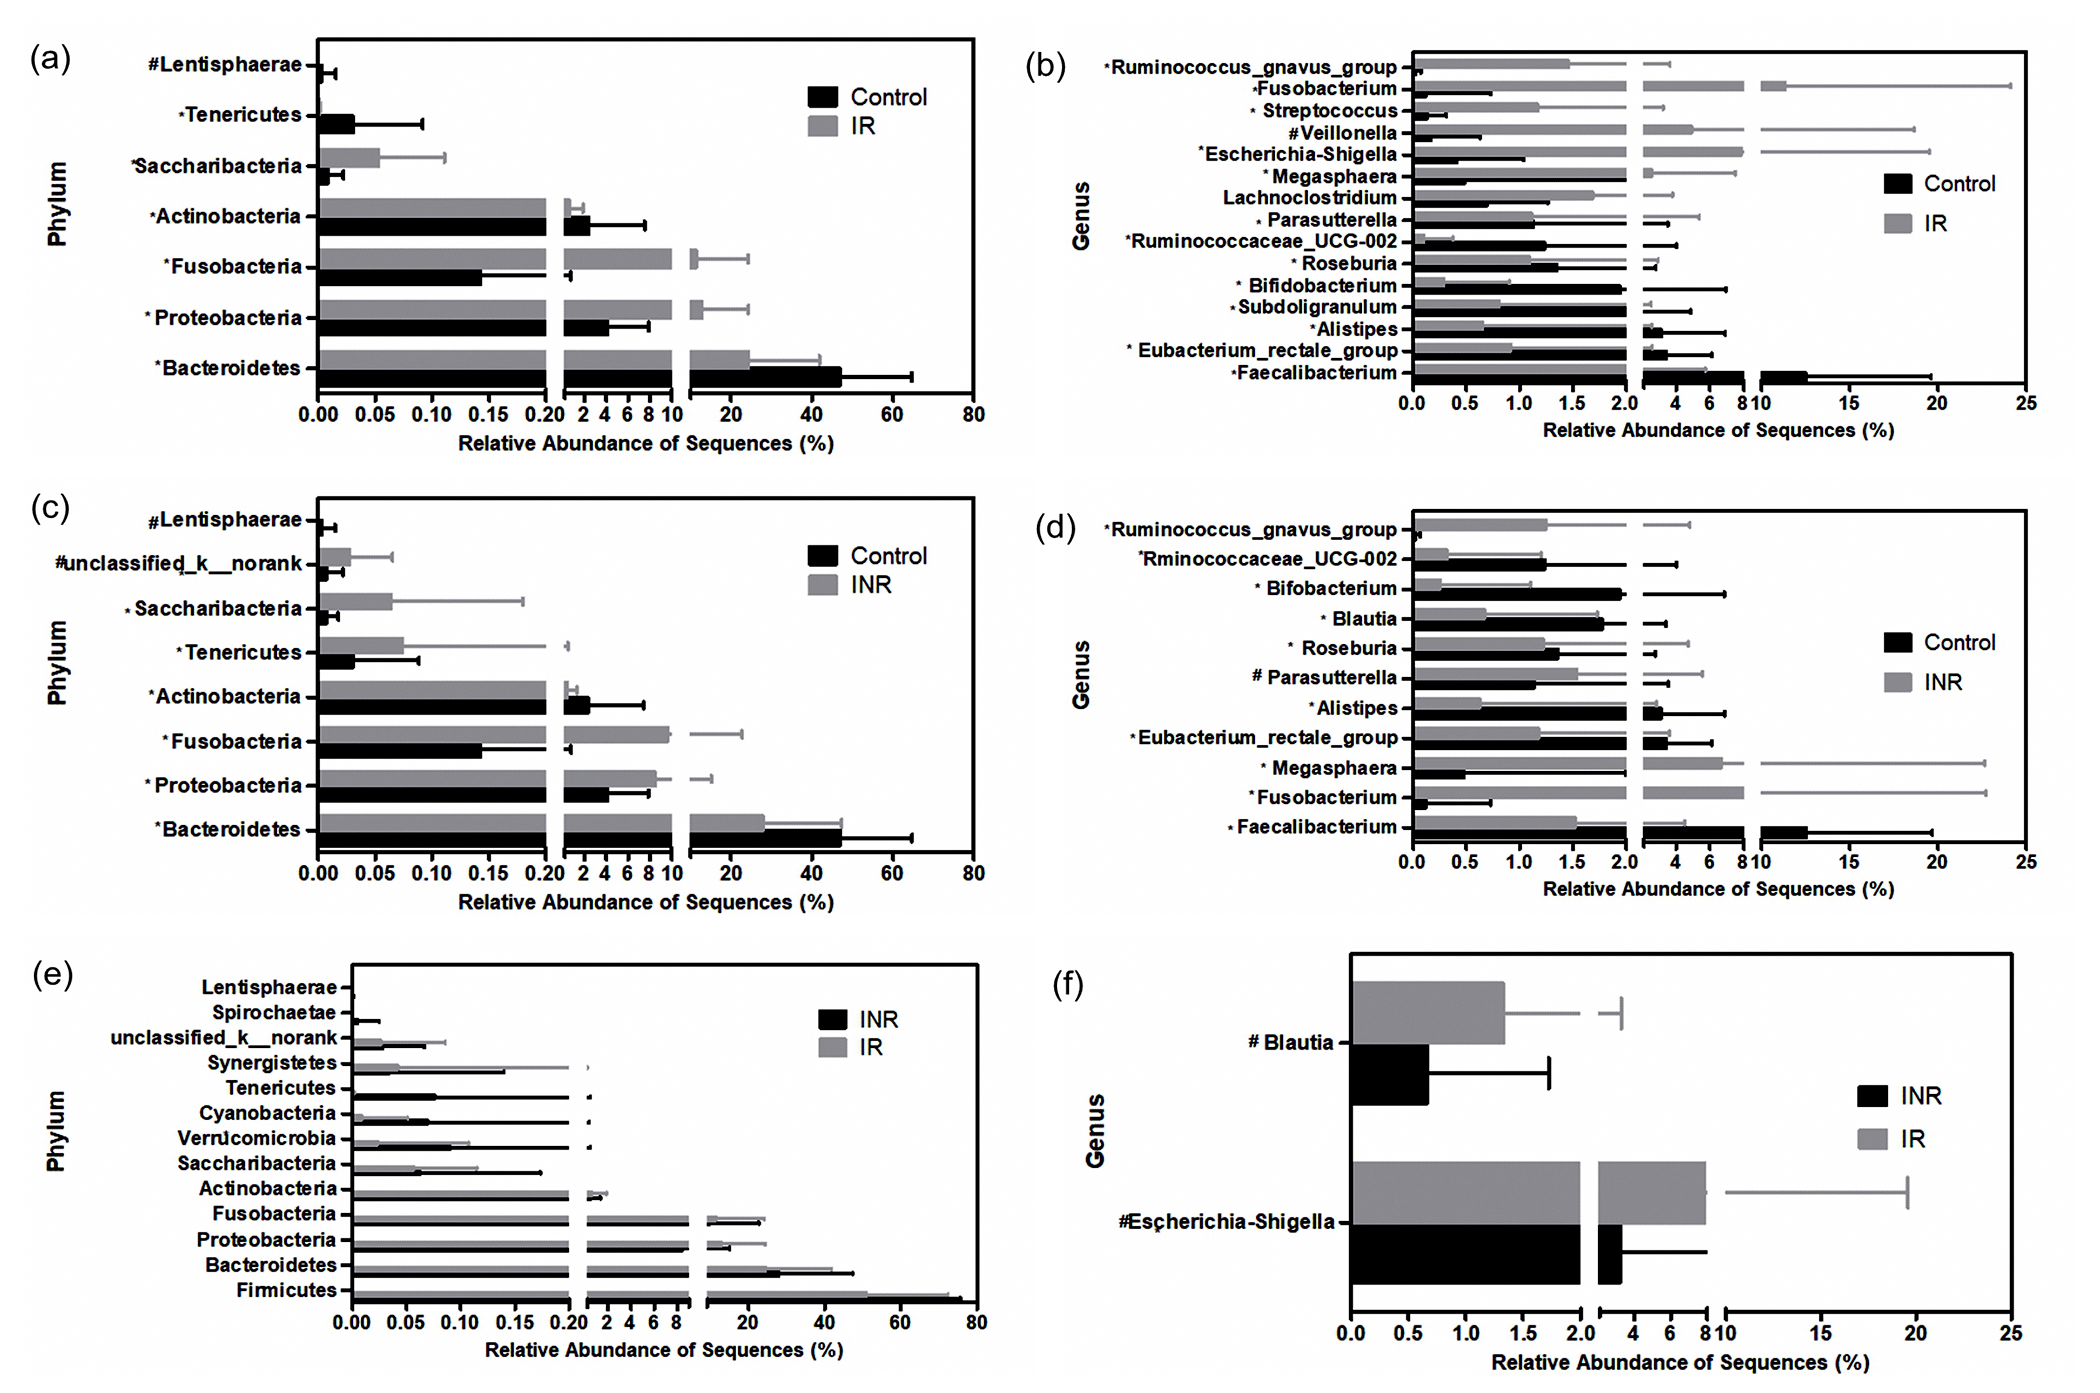
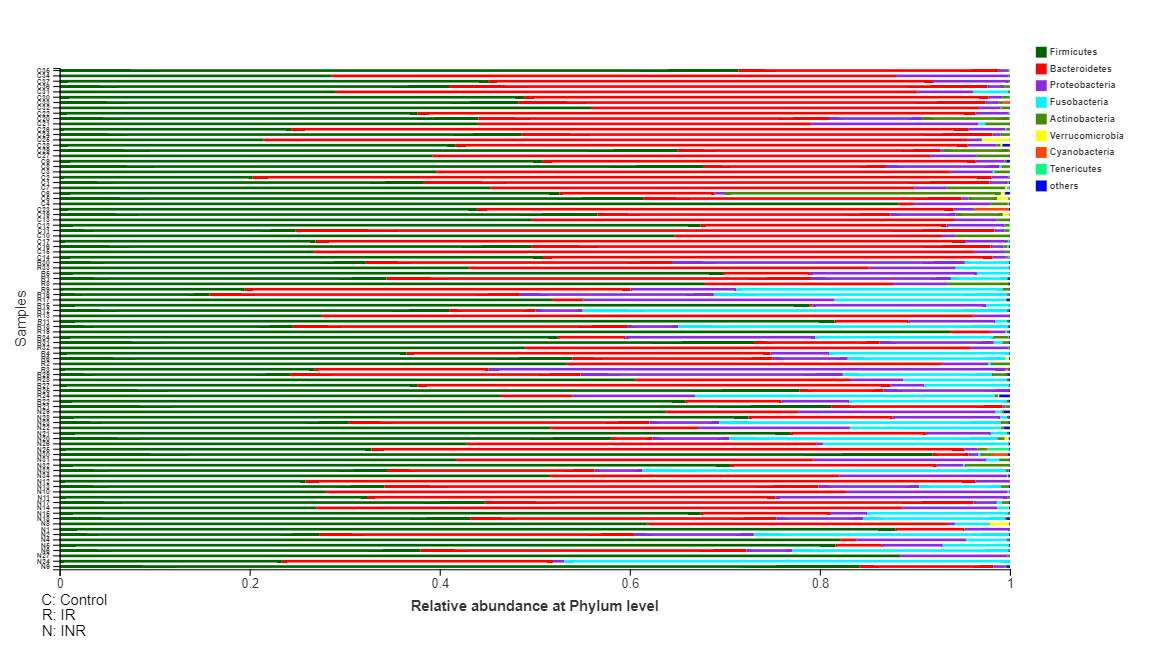
The average relative abundance of each bacterial phylum and genus in patients and controls were showed respectively (Fig. 2; Fig. 3; S1, S2 and S3 Fig; S1 and S2 Table). The Wilcoxon rank sum test was used to detect taxa with significant differences in relative abundance among groups (confidence interval method). At the phylum level, Bacteroidetes, Actinobacteria, Tenericutes and Lentisphaerae were more abundant in the control group than the IR group. The relative abundances of Proteobacteria, Fusobacteria and Saccharibacteria were significantly higher in the IR group (Fig. 2 and S1 Fig. 2a) than that in the control group. The relative abundance of 11 families was significantly different between the IR and control groups. The relative abundances of 93 genera, including 15 predominant (>1% of the total sequences in either group) and 78 less-predominant genera, were significantly different between the control and IR groups. Among the different predominant genera, Lachnoclostridium, Megasphaera, Escherichia-Shigella, Veillonella, Streptococcus, Fusobacterium, and Ruminococcus_gnavus were found overrepresented in the IR group. The relative abundances of Faecalibacterium, Eubacterium_rectale_group, Alistipes, Subdoligranulum, Bifidobacterium, Roseburia, Ruminococcaceae and Parasutterella were higher in the control group (Fig. 3 and S1 Fig. 2b) than in the IR group. A taxonomy-based bacterial comparison was conducted to define the differences between the control and INR groups. At the phylum level, Bacteroidetes, Actinobacteria, Lentisphaerae were more abundant in the control group than that in INR group, while Proteobacteria, Fusobacteria, Tenericutes, Saccharibacteria and unclassified k norank were more abundant in the INR group than that in the control group (Fig. 3 and S1 Fig. 2c). At the genus level, the relative abundances of 83 genera (including 11 predominant genera) were different between the control and INR groups. The relative proportions of Faecalibacterium, Eubacterium_rectale_group, Alistipes, Bifidobacterium, Blautia, Roseburia and Ruminococcaceae were more abundant in the control group than that in the INR group. Parasutterella, Megasphaera, Fusobacterium, and Ruminococcus_gnavus were found overrepresented in the INR group (Fig. 3 and S1 Fig. 2d). Although there was no significant difference between the IR and INR group at the phylum level (Fig. 2 and S1 Fig. 2e), the abundance of 12 genera (including 2 predominant genera) differed between the IR and INR groups. The abundances of two predominant genera Escherichia-Shigella and Blautia were significantly higher in the IR than that in the INR group (Fig. 3 and S1 Fig. 2f).
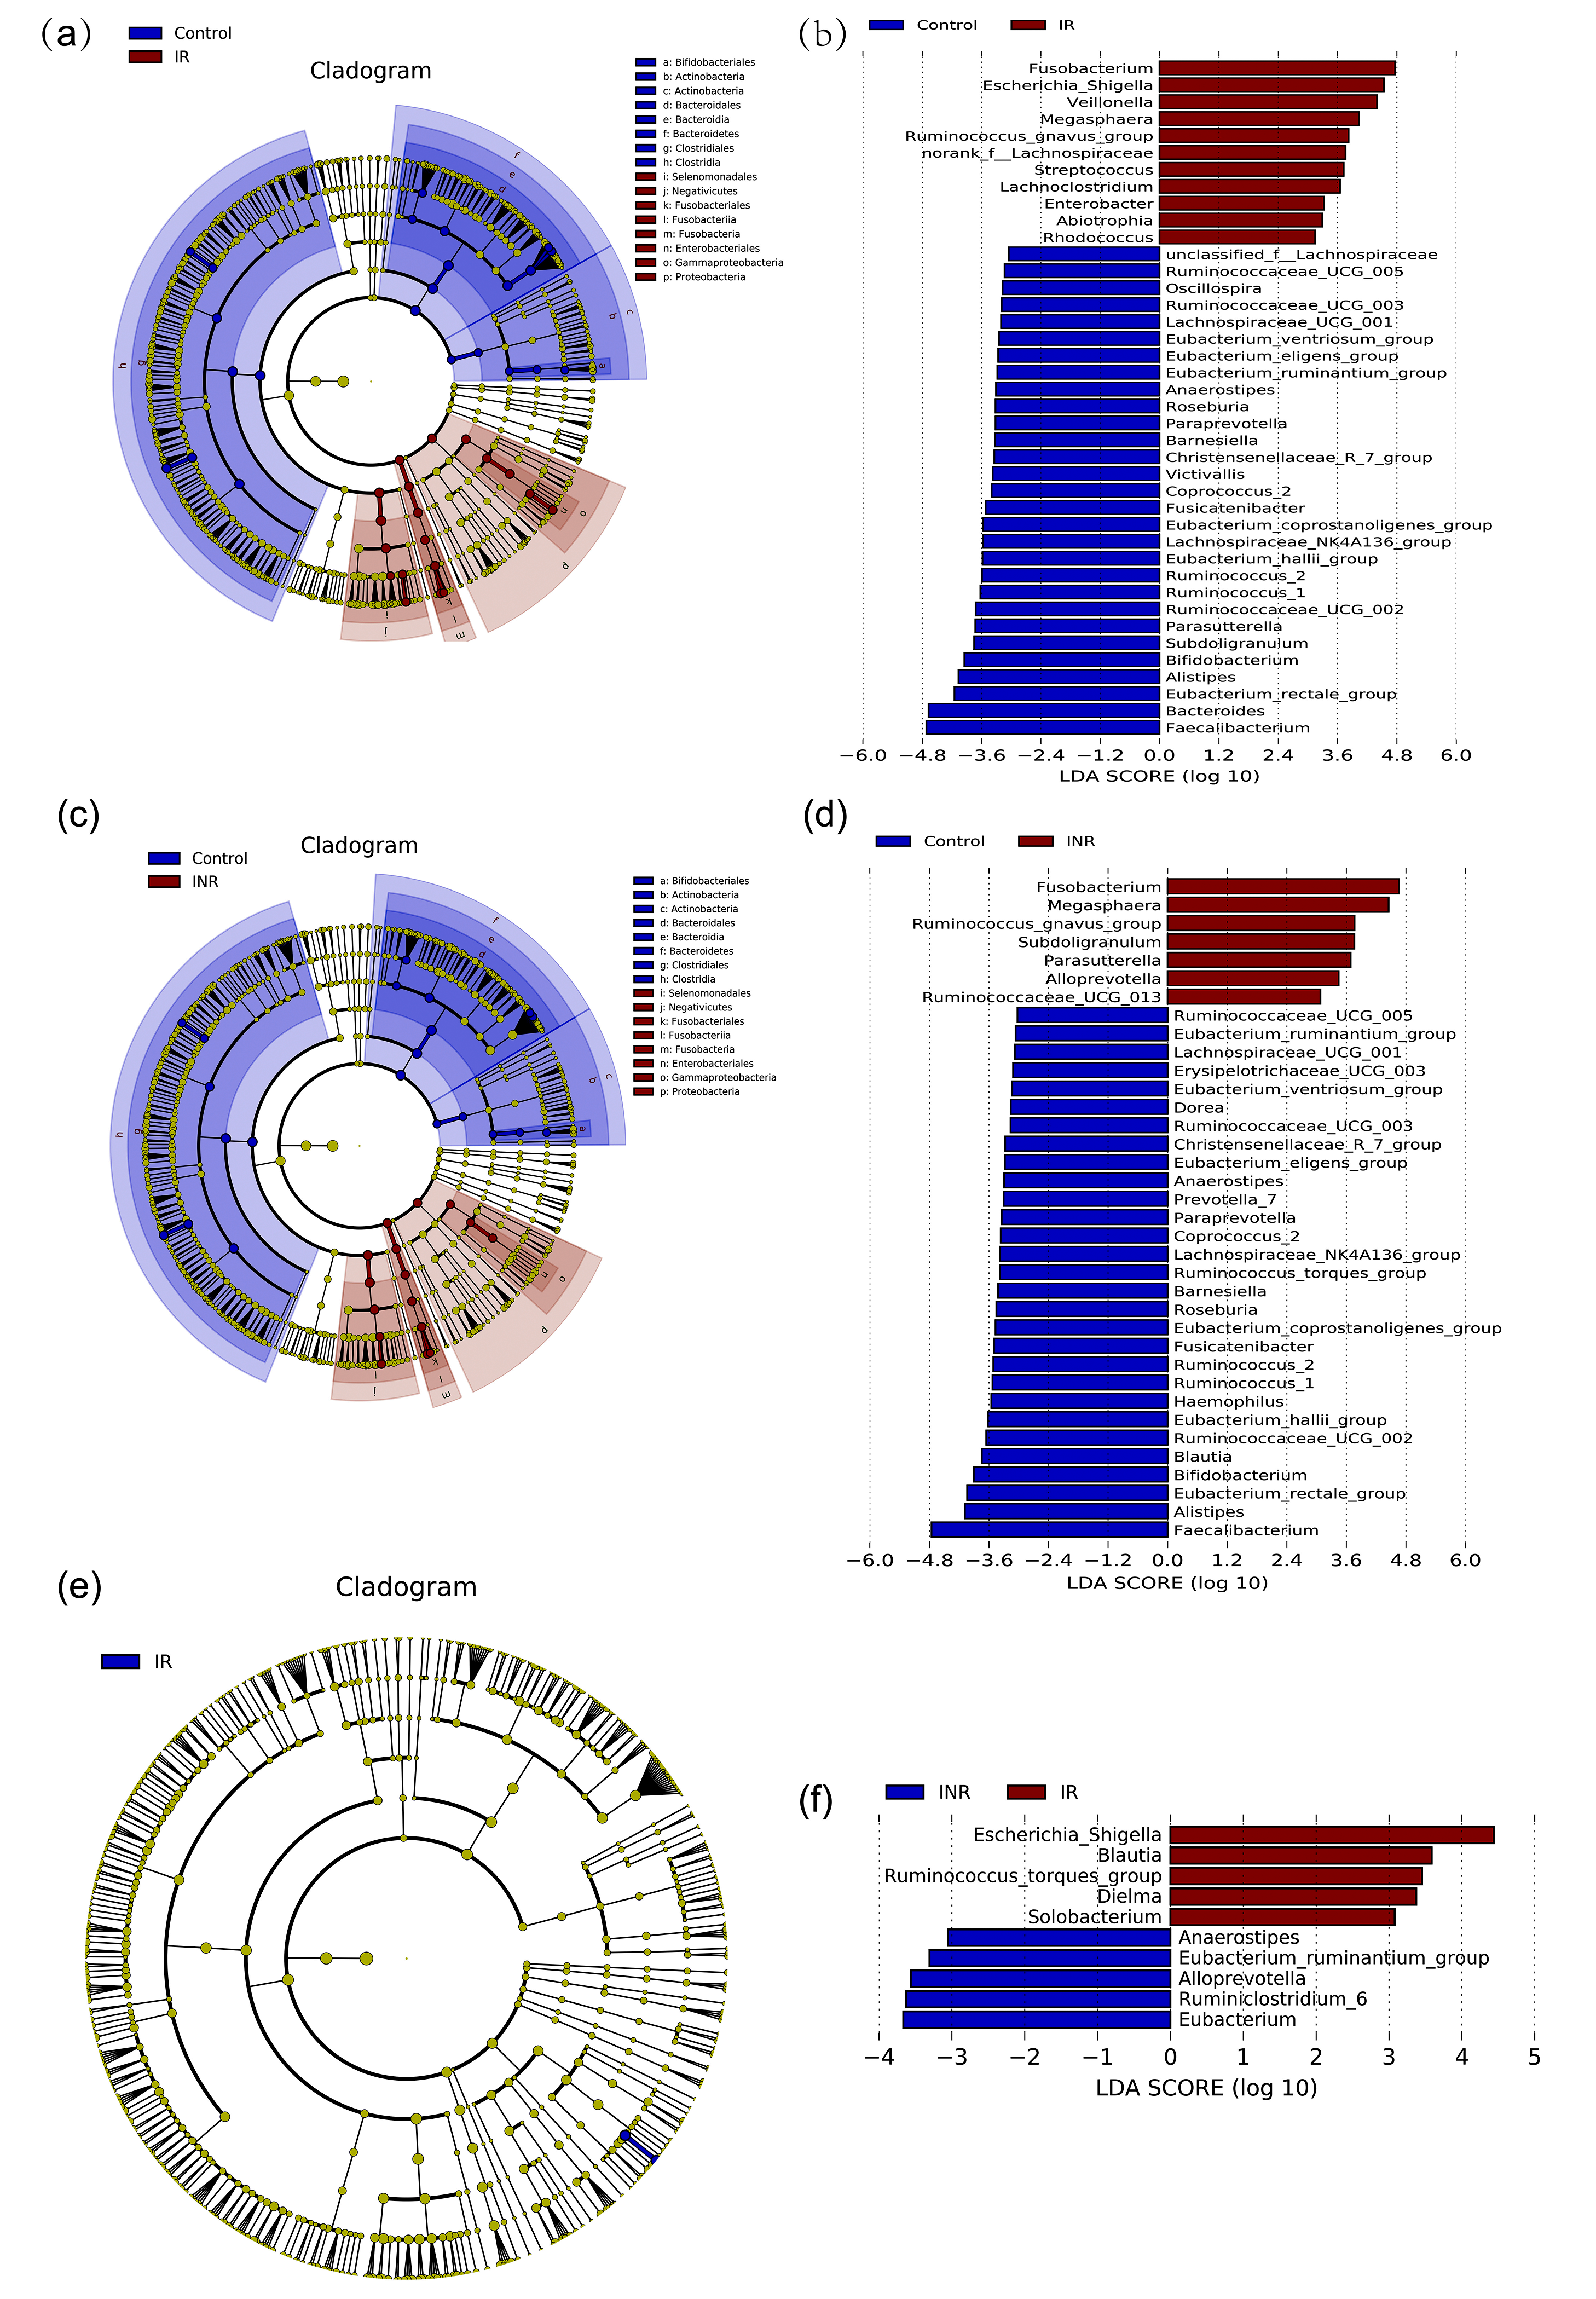
In order to identify the key phylotypes responsible for the difference in distinguishing fecal microbiota of different groups, linear discriminant analysis (LDA) effect size (LEfSe) was performed and an effect-size threshold of 3 was used. Taxonomic cladograms that represent the microbiota structure and predominant bacteria in the three groups were displayed; and the largest differences between the two communities were shown in S4 Fig.
Compare of T-cell activation in the IR and INR groups
As expected, nadir CD4+ T-cell, current CD4+ T-cell counts and CD4/CD8 ratio were lower in the INR group than in the IR group (p<0.0001). The proportion of CD8+CD57+ T-cell in the INR group was significantly lower than in the IR group (p<0.001). The proportion level of CD4+ and CD8+ T-cells immune activation (CD4/8+ T-cell by expression of CD25+, HLA-DR+, and HLA-DR+/CD38+) was similar in the INR and IR groups (Table 1).
Bacterial translocation markers and inflammation profiles comparison
Lipopolysaccharide (LPS) which translocated from the gut to blood stream was commonly used as the major antigens driving chronic immune activation. The level of LPS was significantly increased in the INR group when compared with others (p<0.0001). However, the soluble immune activation marker sCD14 was not different between the groups. Of the 13 markers studied, the level of IL-13 was not different among groups and twelve markers (IL-2, IL-4, IL-5, IL-6, IL-9, IL10, IL-17A, IL-17F, IL-21, IL-22, IFN-γ and TNF-α) were shown to be significantly higher in the INR and IR groups when compared with the control, but there was no significant difference between the INR and IR groups (Table 1).
Association between fecal microbiota and immune activation
Spearman correlations among the relative abundance of bacteria genera and levels of T-cell activation, inflammation or translocation biomarkers were evaluated (Fig. 4). Interestingly, nadir CD4+ T-cell counts were positively correlated with the abundance of Ruminococcaceae and Alistipes, while current CD4+ T-cell counts were strongly positively correlated with the abundance of Ruminococcaceae and Subdoligranulum. The genus Fusobacterium was negatively correlated with nadir and current CD4+ T-cell. The CD4/CD8 ratio was positively correlated with the genus Faecalibacterium and Ruminococcaceae, but negatively correlated with Escherichia-Shigella. Moreover, the CD8+CD57+ T-cell counts was positively correlated with Escherichia-Shigella, but was negatively correlated with the genus Ruminococcaceae and Alistipes. The genus Roseburia and Blautia were negatively associated with nadir CD4+ T-cell and positively associated with CD8+CD57+ T-cell counts. Inflammation markers and LPS were positively correlated with the Ruminococcus and Fusobacterium, but were negatively correlated with the genus Faecalibacterium (Fig. 4).