Whole-Genome Sequencing of Bamei Mutton Sheep for Screening the Genes and SNPs Associated with Litter Size under Selection

DOI: https://doi.org/10.21203/rs.3.rs-48882/v1

Abstract

Background: Bamei mutton sheep is a Chinese domestic sheep breed developed by crossing German Mutton Merino sheep and indigenous Mongolian sheep for meat production. Here, we focused on increasing the litter size of this breed to improve the efficiency of mutton production.

Results: We selected five high- and five low-fecundity Bamei mutton sheep for whole-genome resequencing to identify candidate genes for sheep prolificacy. We used the FST and XP-EHH statistical approach to detect the selective sweeps between these two groups. Combining the two selective sweep methods, the reproduction-related genes JUN, ITPR3, PLCB2, HERC5, and KDM4B were detected. JUN, ITPR3, and PLCB2 play vital roles in GnRH, oxytocin, and estrogen signaling pathway. Moreover, KDM4B, which had the highest FST value, exhibits demethylase activity. It can affect reproduction by binding the promoters of estrogen-regulated genes, such as FOXA1 and ESR1. Notably, one nonsynonymous mutation (p.S936A) specific to the high-prolificacy group was identified at the TUDOR domain of KDM4B.

Conclusion: These observations provide a new opportunity to research the genetic variation influencing fecundity traits within a population evolving under artificial selection. The identified genomic regions of KDM4B that are responsible for litter size can in turn be used for further selection. 

Background

Sheep were the first grazing animals bred for their meat. Mutton still has major economic value for sheep production. The domestication of sheep was initiated approximately ~ 9000 years ago in Southwest Asia, in present-day Iran and Turkey (1). Sheep husbandry began ~ 5000–5700 years ago in the Mongolian Plateau in China (2). China has various sheep resources, including 42 indigenous sheep breeds (3). These breeds are well adapted to the local plateau and desert environments (4), but the meat yield of these Chinese indigenous sheep breeds is so poor that it fails to meet the increasing consumer demand for mutton.

From the 1960s, in Bayannur of the Inner Mongolia Autonomous Region, German Mutton Merino sheep were imported and bred with indigenous Mongolian sheep to improve their meat yield. After 40 years of selection and improvement, in 2007, a novel breed, Bamei mutton sheep, was created and showed good genetic stability (5). Under grazing conditions, Bamei mutton sheep is well adapted to dry and chilly winters in the Inner Mongolia Autonomous Region. Approximately 57,000 sheep of this type are raised mainly in this region. The lambs of Bamei mutton sheep grow faster than those of Small-Tail Han sheep. In terms of the live weight, they can reach about 53 kg at the age of 8 months and their average daily gain was found to be 199.54 g from 4 to 8 months of age under intensive feeding patterns (6). Bamei mutton sheep are an important male breed in commercial hybrid sheep production in Bayannur (7). The meat trait performance of this breed is excellent, but there is large variation in its reproductive abilities. The average lambing rate of the Bamei mutton nucleus group was over 150% (8). The maintenance of high levels of fertility is vital for efficient sheep production (9). Therefore, improving the level of fecundity of this new breed is a major focus of breeders.

Litter size has a major impact on desirable economic traits of sheep (e.g., meat, wool, and milk). Increasing litter size can improve the efficiency of sheep production (9). The main factors affecting sheep fecundity include ovulation, uterine capacity, and placental efficiency. Litter size is a complex trait, but some major genes affecting prolificacy have been discovered in recent years. The FecB (bone morphogenetic protein 1B receptor, BMPR1B) gene was the first major gene found to affect prolificacy. Subsequently, many major genes, such as FecX (bone morphogenetic protein 15, BMP15), FecG (growth differentiation factor 9, GDF9), FecL (glycosylation enzyme beta-1,4-N-acetyl-galactosaminyltransferase 2, B4GALNT2), and LEPR (leptin receptor), were also reported (10, 11).

As reported in Science, the first high-quality 2.61 Gb reference genomes of domestic sheep were sequenced and assembled in 2014. They can help in identifying genomic signatures of domestic traits in sheep (12). By performing whole-genome resequencing on phenotypically divergent sheep populations, some selective sweeps were identified relating to important traits targeted by artificial selection during domestication, such as horn (1, 13), coat color (14), tail morphology and fat deposition (3, 15, 16) and variation of thoracic vertebrae (17).

Regarding reproductive traits, using selection tests in pigs, previous studies demonstrated some strong selective signals belonging to the TGF-β signaling pathway (18, 19). In addition, in goats, the genes regulating seasonal reproduction and litter size have been specifically selected(20, 21). Moreover, some fecundity-related genes revealed a strong selection signature in sheep from Ethiopia and Europe(22, 23).

Against this background, we performed whole-genome resequencing of 10 ewes selected to have extreme fecundity and sweeping analysis to identify the underlying variants and genes responsible for the litter size of Bamei mutton sheep under the influence of artificial selection.

Results

Sequencing and mapping of the ten sheep

We sequenced five monotocous and five polytocous sheep to an average depth of 5.5 × using an Illumina HiSeq2500 sequencer, generating a total of 627.16 million raw read pairs, comprising 180.16 Gb of raw data. After filtering out the low-quality reads, each sheep was mapped to the sheep reference genome, with an average alignment rate of 93.76% (92.79–94.34%). The percentages of reads sequenced at least once per bp varied from 87.38–94.55%. The percentage of reads sequenced at least four times per bp was > 61.82% (Supplementary Table S3).

Identification of the variation of the ten sheep

We obtained about 21.39 million SNPs and 2.04 million insertions and deletions (indels) for all sheep in the two groups. Most SNPs (~ 71.7%) were located within intergenic regions, while only a few (~ 0.6%) were located within coding regions. The exonic SNPs were identified (Supplementary Table S4). There were 45,775 vs. 48,265 SNPs involving nonsynonymous mutations, 742 vs. 785 involving stop-gain variation, and 45 vs. 52 involving stop-loss nonsense variation in the polytocous and monotocous sheep, respectively. The rates of heterozygosity of the polytocous and monotocous groups were 30.02% and 30.07%, respectively. The transition-to-transversion ratios (ts/tv) were almost identical between the two groups (2.4346 for the polytocous population versus 2.4352 for the monotocous population) (Supplementary Table S5).

Population structure analysis

The levels of genome-wide genetic diversity, Tajima’s D, and the minor allele frequency (MAF) distribution indicated that high-frequency minor alleles constitute a small proportion of the total but are slightly more abundant in polytocous sheep than in monotocous ones (Supplemental Fig. S1). Additionally, haplotype analysis indicated that the polytocous sheep have slower decay of pairwise correlation coefficient (r2) and higher integrated haplotype homozygosity (iHH) than the monotocous sheep (Supplemental Fig. S2).

To determine the phylogenetic relationship between monotocous and polytocous sheep, a neighbor-joining tree was constructed using high-quality SNPs. When the tree was generated using the SNPs for the whole genome, monotocous and polytocous sheep formed a mixed clade (Fig. 1A). This indicated that the pairwise distances within each group were larger than those between the groups and there was no significant distinction between the two groups. However, in the phylogenetic tree constructed using SNP data selected based on FST score, the monotocous and polytocous sheep were classified into two genetically different groups (Fig. 1B). The results of the two trees show that the population genetic structure was not associated with the litter size and that the breeding time of high-fecundity Bamei mutton sheep was relatively short. 

Analysis of the selected loci and candidate genes

To find selection signals associated with high prolificacy, the average FST values were calculated for nonoverlapping 50 kb windows on the autosomes and X chromosome. After Z-transforming the values, we selected the windows with Z(FST) > 5 across the genome, as in previous studies (24). In total, we identified 85 unique autosomal regions and 2 X-chromosome regions containing 81 candidate genes. The region with the strongest selective signal (FST = 0.6639187, ZFST = 10.65708746) between the monotocous and polytocous sheep was located on chromosome 5 (16750000–16800000 bp), which contains KDM4B (lysine demethylase 4B) (Fig. 2A, Supplementary Table S6).

 We also estimated the XP-EHH statistic for the monotocous and polytocous groups using monotocous sheep as a control. An XP-EHH value greater than zero indicates that these sites have been selected for in the monotocous population, while a value less than zero indicates that selection has occurred in the polytocous population. We scanned the regions using the threshold |XP-EHH| > 2 as candidate regions. A total of 198 regions including 162 genes were found to have undergone positive selection in the XP-EHH analysis, with 155 regions having undergone selection in the polytocous population. A region of chromosome 6 (36200000–36250000 bp) associated with strong selection was found to have the largest |XP-EHH| value (XP-EHH = − 3.963) (Fig. 2B, Supplementary Table S7).

We combined the genes obtained by the two methods described above. A total of 221 genes were found to have been selected in total. Overall, 14 genes were positively selected across both of the two methods (Supplementary Table S8).

Gene Ontology (GO) and KEGG pathway analyses were performed to further study the functions of the selected genes identified by the two methods. The enriched GO terms and KEGG pathways are shown in Supplementary Tables S9 and S10. By the Functional Annotation Clustering tool of DAVID 6.8, we identified two annotation clusters (classification stringency: Medium). Annotation cluster 2 contained GnRH signaling pathway, estrogen signaling pathway, and oxytocin signaling pathway. The reproductive hormones in these pathways are involved in regulating sheep estrus, follicle development, and ovulation. JUN (JUN proto-oncogene, AP-1 transcription factor subunit), ITPR3 (inositol 1,4,5-trisphosphate receptor type 3), and PLCB2 (phospholipase C beta 2) were enriched in all three pathways (Table 1).

Table 1

The functional annotation clusters of similar biological meanings sharing common gene members enriched by DAVID.

Annotation Cluster 1

Enrichment Score: 1.95


Category

Term

Count

Genes

PValue

KEGG_PATHWAY

oas04660:T cell receptor signaling pathway

8

CD3D CD3E CD3G JUN MALT1 CARD11 MAP3K14 PAK6

1.35E-05

KEGG_PATHWAY

oas05142:Chagas disease (American trypanosomiasis)

5

CD3D CD3E CD3G JUN PLCB2

0.013

KEGG_PATHWAY

oas05166:HTLV-I infection

6

ATM CD3D CD3E CD3G JUN MAP3K14

0.072

KEGG_PATHWAY

oas05162:Measles

4

CD3D CD3E CD3G ADAR

0.094

KEGG_PATHWAY

oas04640:Hematopoietic cell lineage

3

CD3D CD3E CD3G

0.157

Annotation Cluster 2

Enrichment Score: 0.67


Category

Term

Count

Genes

PValue

KEGG_PATHWAY

oas04912:GnRH signaling pathway

3

JUN ITPR3 PLCB2

0.151

KEGG_PATHWAY

oas04915:Estrogen signaling pathway

3

JUN ITPR3 PLCB2

0.188

KEGG_PATHWAY

oas04921:Oxytocin signaling pathway

3

JUN ITPR3 PLCB2

0.340

Mutations in the KDM4B gene

KDM4B is located in the highly differentiated region with the highest FST value between the monotocous and polytocous groups. A selected mutation that goes to fixation tends to reduce variation in linked sites in the process of a selective sweep (25). Therefore, we determined the Hp value of the window (chr 5: 16750000–16800000 bp) around KDM4B. The Hp value of the polytocous group (Hp = 0.0818) decreased in the KDM4B region and was the lower than in the monotocous group (Hp = 0.22923) (Fig. 3A).

 To identify SNVs subjected to selection, we screened the exonic mutations of the KDM4B gene in both monotocous and polytocous groups. SNVs that can alter protein translation, structure, and even function may contribute to rapid evolution in domestic animals (26). Here, 13 synonymous SNVs, 3 nonsynonymous SNVs, and 1 frameshift deletion were identified. All of the three nonsynonymous SNVs cause amino acid sequence changes p.S570G (FST = 0.11), p.S924L (FST = 0), and p.S936A (FST = 0.45) in the translated protein (in accordance with Ensembl gene annotation) (Supplementary Table S11).

We compared the FST values of the three nonsynonymous SNVs; only mutation p.S936A had high divergence of allele frequency within our population: monotocous sheep 50% (n = 5) and polytocous sheep 90% (n = 5). To confirm these frequencies based on Illumina sequencing, alleles of additional samples were genotyped by Sanger sequencing. The results showed a similar trend: monotocous sheep 40% (n = 15) and polytocous sheep 60% (n = 14) (Fig. 3B). This indicates that the nonsynonymous mutations may be associated with the selective sweep at KDM4B.

p.S936A affected the TUDOR domain (Fig. 3C). This domain can bind to specific lysine methylation marks on histone proteins (H3-K4me3, H3-K23me3, and H4-K20me3). It plays a vital role in chromatin localization and the regulation of enzymatic function (27). Thus, we aligned the KDM4B protein mutant with its ortholog in diverse vertebrates to evaluate the functional effects of the variants. The results reveal that p.S936A is quite well conserved, being invariant among all of the other mammals that we used (Fig. 3C). All of the results indicate that p.S936A is an important mutation for the reproduction-related KDM4B sweep.

Discussion

Continuous artificial selection in production-oriented breeding has left selective signatures and genomic variability in domesticated sheep. In this study, we performed whole-genome sequencing of 10 Bamei mutton sheep with different litter sizes from the same population. In this population, reproductive traits have undergone intensive selection via the breeding strategy. In this research, numerous mutations were selected in the population after screening, but the rates of heterozygosity did not differ between the two populations. When a neighbor-joining tree was constructed using SNPs selected based on FST score, these two groups were differentiated into two genetic clusters. Most quantitative traits are known to respond quickly to artificial selection, and this population subjected to selection of litter size might have evolved in opposite directions with soft sweeps (28, 29).

Selective sweeps can identify important genomic regions that have been swept in the recent past. Some genes associated with complex, economically important traits have been identified with the help of selected sweep analysis by whole-genome sequencing. We used the XP-EHH test to detect alleles near fixation within a Bamei mutton sheep population. Upon undergoing recent selection, the selected allele generally reaches a high frequency or fixation in one group, but remains polymorphic in the whole population (30). In this research, we discovered 155 regions selected for in the polytocous population, which was greater than the 43 regions screened in the monotocous population. Using fixed window selection of FST and XP-EHH, 221 candidate genes were found to be associated with the prolificacy trait. In a previous study using a segregated flock based on QTL and GWAS mapping, some mutations (FecB, FecX, and FecG) were identified to affect ovulation in sheep (11). However, here we did not identify any mutations previously reported to increase the number of ovulations in sheep. The litter size per breeding ewe is not only influenced by ovulation, but also affected by a number of factors including fertilization rate and pregnancy loss (in the embryonic and fetal development period). Recently, the LEPR gene, estrogen receptor 1 (ESR1) gene, and prolactin (PRL) gene were found to be associated with fecundity, as revealed by a selective sweep analysis in European commercial and semi-feral breeds and a Chinese indigenous breed distributed in different ecoregions (23, 31, 32).

JUN, ITPR3, and PLCB2 in the selected region were enriched in GnRH, oxytocin, and estrogen signaling pathway associated with the complex process from estrus to lambing. This process is organized by complex communication among the hypothalamus, pituitary, ovary, and uterus. Gonadotrophin releasing hormone (GnRH), secreted by the hypothalamus, regulates the synthesis and release of gonadotrophins, follicle-stimulating hormone (FSH), and luteinizing hormone (LH) from the pituitary (33). FSH and LH support the growth and maturation of follicles. Estradiol and progesterone secreted by the corpus luteum inhibit GnRH release by feedback modulation. During the follicular phase, following luteolysis, estradiol reaches a critical threshold and stimulates the preovulatory gonadotrophin surge, appearing to help the ovulation of mature follicles (11).

PLCB is involved in a wide range of signals of reproductive processes, being regulated by many hormones (FSH, LH, GnRH, oxytocin). PLCB2 as a member of the PLCB subfamily is activated by G-protein-linked receptors and can hydrolyze phosphatidylinositol 4,5-bisphosphate to form inositol-1,3,4-trisphosphate (IP3) and diacylglycerol (DAG), which stimulate Ca2+ release and protein kinase C activity, respectively (34). ITPR3 is a member of the IP3 receptor family. IP3, as an intracellular secondary messenger, mobilizes Ca2+ from endoplasmic reticulum stores, which transduces several calcium-dependent cascades. IP3 receptor downregulation induced by GnRH can suppress the secretion of LH/FSH (35, 36).

JUN is one of three JUN members [JUN (c-JUN), JUNB, and JUND] constituting the AP-1 family of heterodimeric transcription factors by combining with four FOS members [FOS (c-Fos), FOSB, FRA1, and FRA2]. GnRH can stimulate the expression of JUN by rapidly and transiently binding to the AP1 site in the FSHB promoter and then stimulating FSHB transcription (36). Conditional knockout of JUN in mice resulted in subfertility in both sexes, such as impaired spermatogenesis in males, diminished corpora lutea in females, and lower gonadal steroid (GnRH and LH) levels (37).

The nonsynonymous mutation p.S936A at KDM4B was discovered and confirmed in monotocous and polytocous sheep; it may be the reason for the signal of a selective sweep at the KDM4B locus. KDM4B belonging to the KDM4/JMJD2 family of histone demethylases contains a JmjN domain, JmjC domain, tandem plant homeodomains (PHD), and tandem Tudor domains. KDM4B catalyzes the demethylation of H3K9me3 and H3K9me2 at or near regulated promoters to promote expression of the downstream pathway induced by multiple different extracellular stimuli (38). KDM4B plays a central role in regulating the ER signaling cascade by controlling expression of the ER and FOXA1 genes. These two important genes can maintain the estrogen-dependent phenotype (39). In the developing ovarian follicle, granulosa cells are the main producers of estrogen. KDM4B is expressed in granulosa cells at early stages of folliculogenesis and its level is correlated with pregnancy failure in IVF patients (40). KDM4B expression in the uterus is also associated with recurrent pregnancy loss in women (41). The identified intersection between steroid hormones and KDM4B in the ovary and uterus sheds new light on the regulation of reproduction.

Conclusions

Following high-throughput sequencing, SNPs and indels were identified from two sheep populations. The sequencing data revealed the genetic diversity and population differentiation of the Bamei mutton sheep population experiencing selection for litter size. The genomic selection scan detected some interesting candidate genes and pathways under artificial selection, which might have increased litter size. This genome-wide research provides valuable information for future whole-genome selection for fecundity in this sheep breed.

Methods

Animals and DNA preparation

In this study, we collected whole-blood samples from the jugular vein of 10 Bamei mutton sheep at the Xianghe Bamei mutton sheep-breeding park, Bayannur, China. These blood samples were placed in EDTA vacutainer tubes for storage. These ewes were about 3 years old and selected from among 500 sheep. Only ewes with litter size showing that they had given birth more than three times were sampled. The selected ewes were grouped into two categories based on the phenotype of litter size (monotocous sheep giving birth to only one lamb in three consecutive parities and polytocous sheep giving birth to more than two lambs in two consecutive parities). Then, genomic DNA was extracted from 200 µL of sheep blood using a QIAamp DNA Blood Mini Kit (Qiagen, Hilden, Germany), in accordance with the manufacturer’s instructions.

Genome sequencing

High-quality DNA for Illumina sequencing library construction was randomly sheared into small pieces (300–400 bp). After end-repair, “A”-tailing and ligating to Illumina sequencing adapters, 400–500 bp ligated products were amplified by ligation-mediated PCR (LM-PCR). Then, 2 × 100 bp paired-end sequencing was carried out on an Illumina HiSeq 2500 sequencer and the original data were analyzed by Illumina HiSeq Control Software.

Read processing and variant calling

NGS QC Toolkit v2.3.3 was used for quality control of the raw reads following three steps (42). First, reads with > 70% low-quality bases (score < 20) in the FASTQ files were filtered out. Second, reads containing N residues were filtered out. Third, low-quality ends (scores < 20) were trimmed. After this trimming, if the read length was < 35, the read was removed. After this quality control, the reads of each sheep were mapped to the sheep genome assembly v3.1 (ftp://ftp.ncbi.nlm.nih.gov/genomes/all/GCA_000298735.1_Oar_v3.1/GCA_000298735.1_Oar_v3.1_genomic.fna.gz) using BWA v0.6.2 (43). The .bam file was sorted by chromosome and duplicated reads were removed using SAMtools v0.1.19 (44).

Mapped reads of all samples were pooled for variant calling using SAMtools, with the parameters “mpileup –u –C50 –DS –q20.” The .vcf file was generated by bcftools view with the parameter “-evcgN.” Then, vcfutils.pl with minimum depth “-d 20” and maximum depth “-D 300” was used to filter raw variants. Finally, the variants were annotated by ANNOVAR (45) version 2014-11-12, in accordance with Ensembl gene annotation (Oar_v3.1).

Population genetics analysis

The samples were separated into two groups (five monotocous individuals, five polytocous individuals). The SNP densities, minor allele frequencies, and Tajima’s D of each group were calculated by VCFtools v0.1.12b (46). Only SNPs in autosomes were preserved for the phylogenetic analysis. A phylogenetic tree of all samples was generated using SNPhylo (47) version 20160204, based on the maximum likelihood method. A total of 500,000 SNPs were randomly selected for calculating the linkage disequilibrium (LD) r2 using Haploview (48) with parameters set as follows: “--missingCutoff 0.2 --dprime --minMAF 0.1.” The SNP pairs were clustered based on the physical distances of these genes. The average LD (e.g., 0–1 kb) of each group was represented by the mean r2.

Selective sweep analysis

The pooled heterozygosity Hp was calculated over 10 kb windows using the formula

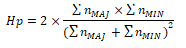
where ΣnMAJ denotes the sum of major allele frequencies in a selected window and ΣnMIN  denotes the sum of minor allele frequencies(49).

FST values were calculated between monotocous individuals and polytocous individuals for individual SNPs using a method that adjusts for a small sample size (50). We averaged FST values over 50 kb sliding windows along the genome with the Bio::PopGen::PopStats Package in BioPerl (51) and Z-transformed the resultant distribution. Putative selection targets were extracted from the extreme tail of the distribution by applying a Z(FST) > 5 cut-off (24).

fastPHASE v1.4.0 was used to phase the genotypes of all samples with the parameters “-T10 –K8” (52). Then, the phased data were used to calculate the cross-population extended haplotype homozygosity (XP-EHH) value by XP-EHH (53). XP-EHH values were averaged over 50 kb sliding windows. These scores approximately followed a normal distribution; the threshold to locate putatively selected regions was two times the XP-EHH distribution standard deviation (|XP-EHH| > 2). Manhattan plots for FST and XP-EHH were generated with the R package gap.

A phylogenetic tree was generated using all variants located in these regions. Candidate genes targeted by positive selection were defined as genes overlapping with sweep regions (ZFST > 5 and |XP-EHH| > 2). GO and KEGG enrichment analyses for candidate genes were performed by DAVID 6.8 (54), and P values were corrected using the Benjamini–Hochberg method. Protein-altering mutations in these genes were listed and ranked by their single-site FST value. The protein-altering mutations of the candidate sweep gene KDM4B were localized to regions that are evolutionarily conserved among mammalian species.

Sanger sequencing validation

To confirm the SNPs detected in exons of the genes selected by sweep analysis, we selected eight SNPs from six genes and designed primers for their Sanger sequencing (Supplementary Table S1). Then, we outsourced the amplification and screening of SNPs in 15 monotocous and 14 polytocous sheep of this group to GENENODE (Wuhan, China).

Abbreviations

FSH

follicle-stimulating hormone

FST

the proportion of the total genetic variance contained in a subpopulation relative to the total genetic variance

GnRH

Gonadotrophin releasing hormone

GO

Gene Ontology

Hp

The pooled heterozygosity

KEGG

Kyoto Encyclopedia of Genes and Genomes

LD

Linkage disequilibrium

LH

luteinizing hormone

SNPs

Single-nucleotide polymorphisms

SNVs

Single Nucleotide Variants

XP-EHH

Cross Population Extended Haplotype Homozogysity

Declarations

Ethics approval and consent to participate

The sheep owners volunteered to participate and provided oral consent for blood collection and DNA analysis of sheep. All experimental procedures in this study were approved by and performed in accordance with the guidelines of the Animal Management Committee (in charge of animal welfare issue) of the Institute of Animal Science, Chinese Academy of Agricultural Sciences (IAS20160322; IAS-CAAS, Beijing, China).

Consent for publication

Not applicable.

Availability of data and materials

The raw genomic sequencing data from this work have been uploaded to the NCBI SRA database with accession number PRJNA560632 (https://www.ncbi.nlm.nih.gov/sra/PRJNA560632).

Competing interests

The authors declare no conflict of interest.

Funding

This work was supported by The Genetically Modified Organisms Breeding Major Program of China (2016ZX08009-003-006), by the Major Science and Technology Program of Inner Mongolia Autonomous Region of China, by the National Natural Science Foundation of China (No. 31501926, No. 31772580, No. 31572371, No. 31861143012), by the Central Public-interest Scientific Institution Basal Research Fund (No. Y2017JC24, No. 2015ywf-zd-8, No. 2018-ywf-yb-2), by The Agricultural Science and Technology Innovation Program of China (No. ASTIP-IAS13), by The Earmarked Fund for China Agriculture Research System (No. CARS-38), by The Youth Innovative Research and Experimental Project of Tianjin Academy of Agricultural Sciences (No. 201915), and by Joint Funds of The National Natural Science Foundation of China and The Government of Xinjiang Uygur Autonomous Region of China (No. U1130302). The funding bodies played no role in the design of the study and collection, analysis, and interpretation of data and in writing the manuscript.

Authors’ contributions

X.W., Z.P., and M.C. conceived the study. Z.P., X.G., and X.H. contributed to sample collection. X.W., Y.Y., and Q.L. analyzed the data. X.W. and Y.Y. wrote the manuscript. X.W., Y.Y., R.D., Q.L., W.H., S.G., and M.C. revised the manuscript. All authors read and approved the final manuscript.

Acknowledgments

We thank Liwen Bianji, Edanz Group China (www.liwenbianji.cn/ac), for editing the English text of a draft of this manuscript.

References

  1. Kijas JW, Lenstra JA, Hayes B, Boitard S, Porto Neto LR, San Cristobal M, et al. Genome-Wide Analysis of the World's Sheep Breeds Reveals High Levels of Historic Mixture and Strong Recent Selection. PLOS Biology. 2012;10(2):e1001258.
  2. Zhao Y-X, Yang J, Lv F-H, Hu X-J, Xie X-L, Zhang M, et al. Genomic Reconstruction of the History of Native Sheep Reveals the Peopling Patterns of Nomads and the Expansion of Early Pastoralism in East Asia. Mol Biol Evol. 2017;34(9):2380–95.
  3. Wei C, Wang H, Liu G, Wu M, Cao J, Liu Z, et al. Genome-wide analysis reveals population structure and selection in Chinese indigenous sheep breeds. BMC Genomics. 2015;16:194.
  4. Yang J, Li W-R, Lv F-H, He S-G, Tian S-L, Peng W-F, et al. Whole-Genome Sequencing of Native Sheep Provides Insights into Rapid Adaptations to Extreme Environments. Mol Biol Evol. 2016;33(10):2576–92.
  5. Jin X, Su R, Zhang W, Li J. The identification and assessment on genetic characteristics in grading breeding sheep populations with microsatellite markers. Agricultural Science Technology. 2008;9(6):21–4.
  6. Zhao T, Zhang H, Wang W, Chen H, Jiang H, Ma Y, et al. Comparison of meat-productivities between Bamei Sheep and Small-tall Han Sheep under intensive feeding pattern. Journal of China Agricultural University. 2014;19(4):121–8.
  7. Zhang H, Liu S, Jin Y, Jin Z, Yuan Q, Jia X. Study on growth and meat output in different carcass levels of Bamei mutton sheep and their hybrid progeny. Meat industry. 2013;2013(4):17–20.
  8. Tan X, Li B, Zhao Y. Current Status and Developing Prospect of Sheep and Goat Breeding in China. Chinese Journal of Animal Science. 2015;51(16):15–9.
  9. Notter DR. Genetic aspects of reproduction in sheep. Reprod Domest Anim. 2008;43(Suppl 2):122–8.
  10. Liu Q, Pan Z, Wang X, Hu W, Di R, Yao Y, et al. Progress on major genes for high fecundity in ewes. Frontiers of Agricultural Science Engineering. 2014;1(4):282–90.
  11. Juengel JL. How the quest to improve sheep reproduction provided insight into oocyte control of follicular development. Journal of the Royal Society of New Zealand. 2018:1–21.
  12. Jiang Y, Xie M, Chen W, Talbot R, Maddox JF, Faraut T, et al. The sheep genome illuminates biology of the rumen and lipid metabolism. Science. 2014;344(6188):1168–73.
  13. Pan Z, Li S, Liu Q, Wang Z, Zhou Z, Di R, et al. Whole-genome sequences of 89 Chinese sheep suggest role of RXFP2 in the development of unique horn phenotype as response to semi-feralization. GigaScience. 2018;7(4).
  14. Fariello MI, Servin B, Tosser-Klopp G, Rupp R, Moreno C, San Cristobal M, et al. Selection signatures in worldwide sheep populations. PloS one. 2014;9(8):e103813.
  15. Moioli B, Pilla F, Ciani E. Signatures of selection identify loci associated with fat tail in sheep. Journal of animal science. 2015;93(10):4660–9.
  16. Pan Z, Li S, Liu Q, Wang Z, Zhou Z, Di R, et al. Rapid evolution of a retro-transposable hotspot of ovine genome underlies the alteration of BMP2 expression and development of fat tails. BMC Genomics. 2019;20(1):261-.
  17. Li C, Li M, Li X, Ni W, Xu Y, Yao R, et al. Whole-Genome Resequencing Reveals Loci Associated With Thoracic Vertebrae Number in Sheep. Frontiers in Genetics. 2019;10(674).
  18. Li X, Ye J, Han X, Qiao R, Li X, Lv G, et al. Whole-genome sequencing identifies potential candidate genes for reproductive traits in pigs. Genomics. 2019.
  19. Li W-T, Zhang M-M, Li Q-G, Tang H, Zhang L-F, Wang K-J, et al. Whole-genome resequencing reveals candidate mutations for pig prolificacy. Proceedings of the Royal Society B: Biological Sciences. 2017;284(1869):20172437.
  20. Guan D, Luo N, Tan X, Zhao Z, Huang Y, Na R, et al. Scanning of selection signature provides a glimpse into important economic traits in goats (Capra hircus). Sci Rep. 2016;6:36372.
  21. Lai F-N, Zhai H-L, Cheng M, Ma J-Y, Cheng S-F, Ge W, et al. Whole-genome scanning for the litter size trait associated genes and SNPs under selection in dairy goat (Capra hircus). Sci Rep. 2016;6:38096.
  22. Dolebo AT, Khayatzadeh N, Melesse A, Wragg D, Rekik M, Haile A, et al. Genome-wide scans identify known and novel regions associated with prolificacy and reproduction traits in a sub-Saharan African indigenous sheep (Ovis aries). Mamm Genome. 2019;30(11):339–52.
  23. Ruiz-Larrañaga O, Langa J, Rendo F, Manzano C, Iriondo M, Estonba A. Genomic selection signatures in sheep from the Western Pyrenees. Genetics Selection Evolution. 2018;50(1):9.
  24. Axelsson E, Ratnakumar A, Arendt M-L, Maqbool K, Webster MT, Perloski M, et al. The genomic signature of dog domestication reveals adaptation to a starch-rich diet. Nature. 2013;495(7441):360–4.
  25. Nielsen R. Molecular Signatures of Natural Selection. Annu Rev Genet. 2005;39(1):197–218.
  26. Wu J, Jiang R. Prediction of Deleterious Nonsynonymous Single-Nucleotide Polymorphism for Human Diseases. The Scientific World Journal. 2013;2013:10.
  27. Upadhyay AK, Judge RA, Li L, Pithawalla R, Simanis J, Bodelle PM, et al. Targeting lysine specific demethylase 4A (KDM4A) tandem TUDOR domain – A fragment based approach. Bioorg Med Chem Lett. 2018;28(10):1708–13.
  28. Burke Molly K. How does adaptation sweep through the genome? Insights from long-term selection experiments. Proceedings of the Royal Society B: Biological Sciences. 2012;279(1749):5029-38.
  29. Johansson AM, Pettersson ME, Siegel PB, Carlborg Ö. Genome-Wide Effects of Long-Term Divergent Selection. PLOS Genetics. 2010;6(11):e1001188.
  30. Sabeti PC, Varilly P, Fry B, Lohmueller J, Hostetter E, Cotsapas C, et al. Genome-wide detection and characterization of positive selection in human populations. Nature. 2007;449(7164):913–8.
  31. Nosrati M, Asadollahpour Nanaei H, Amiri Ghanatsaman Z, Esmailizadeh A. Whole genome sequence analysis to detect signatures of positive selection for high fecundity in sheep. Reprod Domest Anim. 2019;54(2):358–64.
  32. Liu Z, Ji Z, Wang G, Chao T, Hou L, Wang J. Genome-wide analysis reveals signatures of selection for important traits in domestic sheep from different ecoregions. BMC Genomics. 2016;17(1):863.
  33. Clarke IJ, Arbabi L. New concepts of the central control of reproduction, integrating influence of stress, metabolic state, and season. Domest Anim Endocrinol. 2016;56:165-S79.
  34. Filis P, Lannagan T, Thomson A, Murray AA, Kind PC, Spears N. Phospholipase C-β1 Signaling Affects Reproductive Behavior, Ovulation, and Implantation. Endocrinology. 2009;150(7):3259–66.
  35. Cao Z, Fan R, Meng B, Xing Z, Liu M, Gao M, et al. Comparative proteomic analysis of hypothalamus tissue from Huoyan geese between pre-laying period and laying period using an iTRAQ-based approach. Anim Sci J. 2018;89(7):946–55.
  36. Stamatiades GA, Carroll RS, Kaiser UB. GnRH—A Key Regulator of FSH. Endocrinology. 2018;160(1):57–67.
  37. Jonak CR, Lainez NM, Boehm U, Coss D. GnRH Receptor Expression and Reproductive Function Depend on JUN in GnRH Receptor–Expressing Cells. Endocrinology. 2018;159(3):1496–510.
  38. Wilson C, Krieg AJ. KDM4B: A Nail for Every Hammer? Genes. 2019;10(2):134.
  39. Gaughan L, Stockley J, Coffey K, O’Neill D, Jones DL, Wade M, et al. KDM4B is a Master Regulator of the Estrogen Receptor Signalling Cascade. Nucleic Acids Res. 2013;41(14):6892–904.
  40. Krieg AJ, Mullinax SR, Grimstad F, Marquis K, Constance E, Hong Y, et al. Histone demethylase KDM4A and KDM4B expression in granulosa cells from women undergoing in vitro fertilization. J Assist Reprod Genet. 2018;35(6):993–1003.
  41. Krieg SA, Fan X, Hong Y, Sang Q-X, Giaccia A, Westphal LM, et al. Global alteration in gene expression profiles of deciduas from women with idiopathic recurrent pregnancy loss. Mol Hum Reprod. 2012;18(9):442–50.
  42. Patel RK, Jain M. NGS QC, Toolkit. A Toolkit for Quality Control of Next Generation Sequencing Data. PloS one. 2012;7(2).
  43. Li H, Durbin R. Fast and accurate short read alignment with Burrows-Wheeler transform. Bioinformatics. 2009;25(14):1754–60.
  44. Li H, Handsaker B, Wysoker A, Fennell T, Ruan J, Homer N, et al. The Sequence Alignment/Map format and SAMtools. Bioinformatics. 2009;25(16):2078–9.
  45. Wang K, Li MY, Hakonarson H. ANNOVAR: functional annotation of genetic variants from high-throughput sequencing data. Nucleic Acids Res. 2010;38(16).
  46. Danecek P, Auton A, Abecasis G, Albers CA, Banks E, DePristo MA, et al. The variant call format and VCFtools. Bioinformatics. 2011;27(15):2156–8.
  47. Lee TH, Guo H, Wang XY, Kim C, Paterson AH. SNPhylo: a pipeline to construct a phylogenetic tree from huge SNP data. BMC genomics. 2014;15.
  48. Barrett JC, Fry B, Maller J, Daly MJ. Haploview: analysis and visualization of LD and haplotype maps. Bioinformatics. 2005;21(2):263–5.
  49. Rubin C-J, Zody MC, Eriksson J, Meadows JRS, Sherwood E, Webster MT, et al. Whole-genome resequencing reveals loci under selection during chicken domestication. Nature. 2010;464(7288):587–91.
  50. Weir BS, Cockerham CC. Estimating F-Statistics for the analysis of population structure. Evolution. 1984;38(6):1358–70.
  51. Stajich JE, Block D, Boulez K, Brenner SE, Chervitz SA, Dagdigian C, et al. The bioperl toolkit: Perl modules for the life sciences. Genome Res. 2002;12(10):1611–8.
  52. Scheet P, Stephens M. A fast and flexible statistical model for large-scale population genotype data: Applications to inferring missing genotypes and haplotypic phase. Am J Hum Genet. 2006;78(4):629–44.
  53. Pickrell JK, Coop G, Novembre J, Kudaravalli S, Li JZ, Absher D, et al. Signals of recent positive selection in a worldwide sample of human populations. Genome Res. 2009;19(5):826–37.
  54. Huang DW, Sherman BT, Lempicki RA. Systematic and integrative analysis of large gene lists using DAVID bioinformatics resources. Nat Protoc. 2008;4:44.