Process characterization for ethanol precipitation of Salviae Miltiorrhizae Radix et Rhizoma using 1H NMR spectroscopy and chemometrics

DOI: https://doi.org/10.21203/rs.3.rs-57475/v1

Abstract

Background

Quality control of the herbal medicines (HMs) still hits technical bottlenecks due to their complicated multi-step pharmaceutical processes. Nuclear magnetic resonance (NMR) spectroscopy could serve as a powerful technique able to obtain comprehensive information of chemical compounds in the manufacturing process of HMs by a single analytical test. In this study, ethanol precipitation of Salvia miltiorrhiza Radix et Rhizoma (Danshen in China), a critical purification process of a particularly commonly used herbal medicinal material, was employed as the research subject.

Methods

Processed with different variables, including ethanol-material ratio, apparent ethanol concentration and moisture concentration of the raw material, 40 lab-scale experiments of ethanol precipitation were orchestrated by a full factor design with additional central composite circumscribed experiments. After 1H NMR tests, chemometrics methods, including orthogonal partial least squares-discriminant analysis (OPLS-DA), principle component analysis (PCA) and multiple linear regression (MLR), were applied to analyze the spectra of samples.

Results

16 metabolites were recognized as the most critical potential chemical markers in the process of Danshen ethanol precipitation by 1H NMR spectra and OPLS-DA, including γ-aminobutyrate, pyroglutamate, succinate, acetate, malonate, fructose, sucrose, raffinose, stachyose, mannotriose, danshensu, lithospermic acid, protocatechuic aldehyde, rosmarinic acid, salvianolic acid A and B. PCA reasonably distinguished all the process intermediates as a function of different process variables adopted during the ethanol precipitation. MLR made the statistical interpretation by quadratic equations to characterize how do significant variables affect the chemical markers.

Conclusions

Our study indicates that NMR can track detailed potential chemical markers of ethanol precipitation process, which could promote the further understanding of ethanol precipitation process and open up possibilities to develop a more effective process quality control and consistency evaluation methodology of an HM, through providing a more in-depth and improved theoretical process understanding and characterization.

1. Introduction

Herbal medicines (HMs) have been playing a pivotal role in maintaining human health and widely used in all regions of the world since ancient times. In the progress of modernization and globalization of HMs, the crux is their quality consistency and controllability 1, 2. Herbal medicine technology is used for converting botanicals materials into HMs, where standardization and quality control with proper integration of modern scientific techniques and traditional knowledge, which is essential for realizing consistency and controllability of product quality 3. However, quality control of HMs still faces a great challenge because their chemical composition is very complex and chemical changes take place during their production processes 4, 5. A general understanding of the effects of production processes of an HM on chemical changes attracts more attention, out of it is essential and of great significance to ensure the efficacy and safety of HM. The typical unit operations of manufacturing HMs include extraction, concentration, purification and so on. In order to reduce the dosage and improve the efficacy and safety of herbal medicinal preparations, the crude decoction of raw botanical materials is required to be further purified.

As a simple and effective way to remove impurities, ethanol precipitation has been extensively applied in the industry of foods and herbal products for purification process. Removal of the ingredients with poor solubility in ethanol is the main purification mechanism of ethanol precipitation 6–10. With the addition of ethanol, proteins, resins, starches, saccharides and other poorly ethanol-soluble components, will precipitate. After this operation unit, the supernatant with improved purity is obtained. Nonetheless, loss of some bioactive compounds would be unavoidable during the process of ethanol precipitation. The knowledge of the compounds affected by this process is an important part of the research and development of HMs. To understand the process of ethanol precipitation, numerous studies have tested how precipitation conditions, such as temperature, ethanol consumption, concentration of ethanol, stirring speed and the attributes of materials, affect the process performance in recently years 11–16. Most of these studies focused on the retention of one or a few bioactive compounds, impurity removal rate, and other performance attributes of precipitation. In these studies, for evaluating the performance of ethanol precipitation, combination of diverse analytical methods was used to determine contents of various components, such as HPLC-UV for bioactive compounds with UV chromophores, HPLC-ELSD for nonvolatile compounds lacking chromophores, and phenol–sulfuric acid method for total saccharide. However, few studies investigated the effect of precipitation conditions on global chemical components or achieved comprehensive process characterization.

Among all the analytical methods, nuclear magnetic resonance (NMR) spectroscopy stands out as a powerful technique able to monitor most types of chemical compounds by a single experiment. NMR is non-destructive and owns high-throughput analytical ability to provide qualitative and quantitative information with no or little pretreatment 17–20. It provides comprehensive information of metabolites in a sample because the area of signal peak directly proportional to the number of nucleus in all proton-bearing compounds. A lot of previous researches have proved that NMR has the potential for quantitative, semi-quantitative and extensive qualitative analysis on multiple components in herbal medicinal products 21, 22. Due to highly complex NMR data from herbal product matrices and the inherent overlapping and similarity, chemometric analysis has become essential tools to extract information from NMR spectra 23–25.

This study was aimed to demonstrate the potential of 1H NMR spectroscopy of monitoring chemical changes and promoting the understanding of the process of ethanol precipitation. Salvia miltiorrhiza Radix et Rhizoma (Danshen in China), a widely used herbal medicinal material for cardiovascular diseases treating 26, was employed as an example. According to our previous research, ethanol precipitation was identified as the critical control point in the multi-step manufacturing chain of Danshen preparation 27. However, most of the previous studies for ethanol precipitation were focused on improving the retention rate of a few important activity compounds, and indirectly controlling the retention of impurities by controlling the retention of total solids or total sugars without individualized indicators 11–16. A comprehensive investigation of the retention trend of various metabolites in ethanol precipitation have not come up to realize deep understanding of the process, which is a research gap in process quality control of ethanol precipitation. This article was mainly set up to propose an NMR assisted novel process characterization strategy focusing on the transfer and transformation of the multiple potential chemical markers, including primary metabolites and secondary metabolites, in Danshen extracts going through the process of ethanol precipitation. Firstly, typical peak signals in ethanol precipitation were screened out by bucketed 1H NMR spectra and orthogonal partial least squares-discriminant analysis (OPLS-DA) among the designed experimental samples at the lab scale. After these peak signals assigned to corresponding compounds specifically, these typical compounds were identified as the potential chemical markers of the process. Then, by principal component analysis (PCA) and hierarchical classification analysis (HCA) tree as a visually methodology, supernatant samples from a set of design experiments were analyzed and clustered. Finally, multiple linear regression (MLR) was applied to evaluate and explain the impacts of process variables and their interaction on the chemical markers, which help with characterizing the process in detail.

2. Materials And Methods

2.1. Reagents and materials

Deuterium oxide (D2O, 99.9 atom % D) containing 3-(trimethylsilyl) propionic-2, 2, 3, 3-d4 acid sodium salt (TSP, 0.05 wt%) was purchased from Sigma-Aldrich, Co. (St Louis, MO, USA) for 1H NMR analytical sample preparation. Analytical pure ethanol was purchased from Shanghai Lingfeng Chemical Reagent Co., Ltd. (Shanghai China) for conducting the ethanol precipitation process. Amino acids were purchased from Sigma-Aldrich, Co. (St Louis, MO, USA), and the rest reference reagents, including several saccharides and Danshen phenolic acids, were purchased from Shanghai Winherb Medical Technology Co., Ltd. (Shanghai China) for metabolite typical signal assignment. Ultrapure water was prepared using a Millipore Milli-Q System. Crude extract of Danshen as the raw material of the ethanol precipitation were provided by Guizhou Baite Pharmaceutical Co. Ltd (Guiyang, China).

2.2 General experimental procedures

2.2.1. Experiment operation

The detailed process of conducting the ethanol precipitation at laboratory scale was as follows:

The 8.0 g concentrated crude extract of Danshen with different solid concentration was placed into a 50 mL reaction reactor as the raw material for ethanol precipitation. During the process, a certain concentration and volume of ethanol-water solution was added into the tube with continuous and vigorous mechanical stirring. Then the mixture is refrigerated in a low-temperature thermostat bath for a period of time. After that, the solid-liquid mixture was filtered by a high - speed centrifuge. The obtained supernatant was the process product that we need to collect to perform further NMR analysis. All intermediate products of ethanol precipitation process were stored at -20 ℃ until analysis and would be thawed to room temperature for sample preparation.

2.2.2. Experimental Design

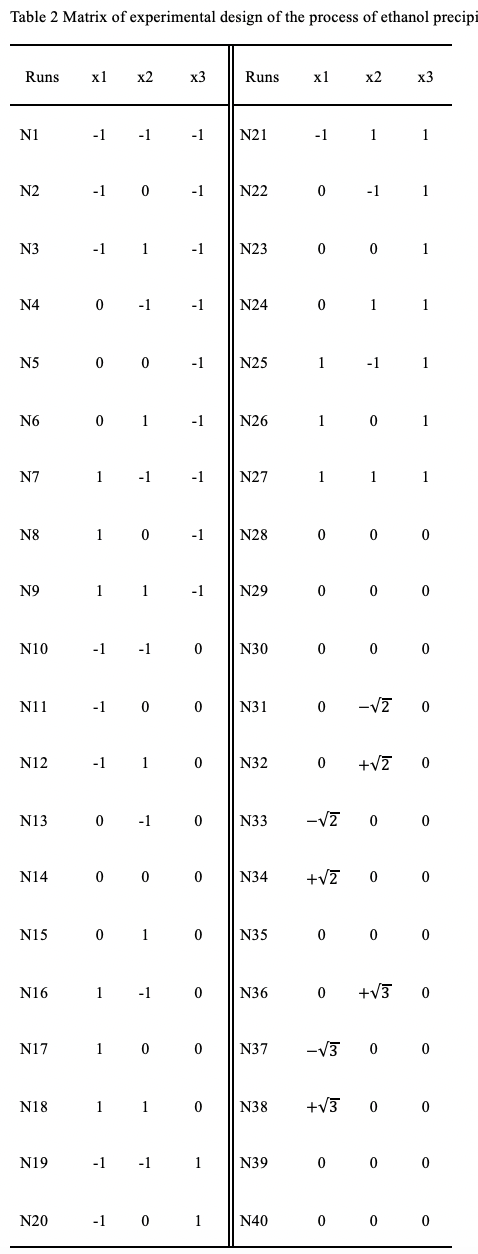
To obtain reasonably distributed and representative enough samples, as well as to facilitate process statistical modeling, the experimental design was carried out in this study. The most significant variables affecting the process of ethanol precipitation were identified as ethanol-material ratio (EMR), apparent ethanol concentration (AEC) of the ethanol-material mixture and moisture concentration (MC) of the raw material 13–15. Then, a three-level full factor design with additional central composite circumscribed experiments were orchestrated, using the software MODDE (Version Pro 12, Umetrics, Umeå, Sweden). 

The experimental matrix was designed with 7 repeated central points, and the variables were tested at three coded levels: 1, 0, and 1, while the level of special “star points” in the design were .

The range and levels (coded and true) of variables are given in Table 1. All of the runs except the center points were performed in triplicate, and the mean values were used for analysis. The design matrix is shown in Table 2.

Table 1

Variables and their levels in the full factor design of the process of ethanol precipitation

Variables

to be studied

Symbols

Coded levels

Coded

Truth Value

-1

0

+ 1

AEC (%)

x1

X1

65.00

72.50

80.00

EMR (g•g− 1)

x2

X2

1.50

2.50

3.50

MC (g•g− 1)

x3

X3

0.38

0.45

0.52

2.3. Sample Preparation

When sampling from each ethanol precipitation supernatant, weight of different sample was adjusted to a quantity equal to 0.08 g per gram dry matter in the raw material as a standard unit. In such a mass-normalized way, peak area of the same compound at the same chemical shift in different samples became quantitatively comparable, which can help with calculating the retention rate of compound by comparing the specific peak area.

To weaken the effects of residual water and/or ethanol in the solution, ethanol precipitation supernatant was weighed and dried using a centrifugal vacuum concentrator at 60 °C for 2 h. The dehydrated sample was added into exactly 540 µL of ultrapure water and 60 µL of D2O (containing 0.05% TSP). The mixture was dissolved by ultrasound for 3 minutes and centrifuged at 3 500 r/min for 10 min to remove insoluble substances. Then, the supernatant solution was transferred into a standard 5‑mm NMR tube for measurement.

2.4. 1H NMR analysis

2.4.1. 1H NMR analysis conditions

All 1H NMR spectra were recorded by a Bruker AVANCE III NMR spectrometer (Bruker, Karlsruhe, Germany) operating at 500.13 MHz at room temperature. The NMR probe was frequency tuned and impedance matched before each acquisition. Two 1H NMR pulse sequences applied in this study were as follows: a presaturation sequence PROTON to suppress the residual water signal and a standard NOESYPR1D pulse sequence to obtain 1H NMR spectra. They were both from Bruker pulse program library.

Preparative test was conduct to select acquisition and processing parameters of 1H NMR spectra in this work. Relevant parameters were adjusted to an appropriate combination, so as to obtain accurate and precise measurements. Each 1H NMR spectrum with 32 K data points required 6‑min acquisition time and employed following parameters: sampling time 2.980 s, pulse width 12 ppm, relaxation delay 2.0 s, 90° pulse width of 14.75 µs. Receiver gain value was at 57 and free induction decay (FID) was acquired 64 times for increasing signal-to-noise ratio (S/N) without causing baseline distortion. A 13C NMR experiment and a 2-dimensional (2D) 1H-13C heteronuclear single quantum coherence (HSQC) were acquired for the auxiliary reference to assist the identification of the constituents within the Danshen extracts and processed with similar parameters as described previously.

2.4.2 1H NMR data processing

Bruker Topspin (version 3.2.6, Bruker Biospin Corporation, Billerica, MA, USA) was used for data preprocessing. FIDs were weighted by an exponential function with a 0.3-Hz line broadening factor prior to Fourier Transformation. Phase corrections, baseline correction and displacement rectification were performed manually for ensuring a better evaluation of the signals. When carrying out the displacement rectification, the peak of TSP was setting at 0.00 ppm as internal reference to achieve unified peak alignment. The manual mode was applied also for the signal integration process choosing the same width for each compound.

MestReNova (version 14.0.0, Mestrelab Research, Santiago de Compostella. Spain) was used to segment (bin) every spectrum by 0.02 ppm of bucket width across the chemical shift δ 0.50–10.00 ppm. The signal intensity in each region were integrated by peak mode. The regions of δ 4.90–4.70 and δ 1.28–1.21 were excluded from the analysis to avoid the effects of the residual solvent (H2O and CH3CH2OH) resonance. Subsequently, because of the overlapping of proton signals, a deconvolution method was adopted to quantify the typical peak area of chemical markers in all the samples for more precise process interpretation, using linearly fitting coupled with the Lorentzian and Gaussian mixed function.

2.5. Chemometric analysis

2.5.1 Sample classification analyses

OPLS-DA was applied to explore differential metabolites between the samples collected before and after ethanol precipitation. After the alignment of all the NMR spectra according to the TSP typical signal at 0.00 ppm, the spectra region between δ = 0.50 and 10.00 ppm of process intermediates obtained before and after the ethanol precipitation were partitioned (“bucketed”) into 475 regions of 0.02 ppm. All the buckets were integrated by peak of intensities and scaled to total intensity in scaling process. Then the pretreated spectra were exported to the software SIMCA (Version 14.1, Umetrics, Umeå, Sweden) to conduct further chemometrics analysis. Then, Pareto scaling method, which uses the square root of standard deviation as the scaling factor 28, was used before two-class OPLS-DA in order to balance the importance of high value metabolites and low value metabolites while keeping the structure of the data partially intact. A permutation test was performed using 50 permutations to check overfitting of the OPLS-DA model and confirm whether the model was valid or not. Unsupervised principal component analysis (PCA) and corresponding hierarchical classification analysis (HCA) tree were applied to classify the designed samples and get an overview of differences or similarities between sample profiles and to detect possible outliers.

2.5.2 Multiple regression between process variables and chemical markers

The experimental results were analyzed using multiple regression technique in the software MODDE by MLR models, which would use typical features in the dataset to establish a relationship to known how the variables impact on the transfer and transformation of chemical markers, and the process efficiency 29.

Because of the mass-normalized sample preparation method mentioned in Sect. 2.3, every retention ratio of compound through a specific ethanol precipitation process, taken as the response of the MLR model, was calculated by Eq. (1):

   (1)

where  and are the typical quantitative peak area of the compound in the NMR sample of the raw material and ethanol precipitation supernatant, respectively. A study on methodology of the method is shown in the Table S1.

Every predicted retention ratio of chemical marker through a specific ethanol precipitation process fitted by the regression model is listed as the quadratic empirical equation (2):

   (2)

where  is a constant, , and  are the linear, quadratic and interactive coefficients, respectively,  and  are the coded values of the variables. Equations would be used to explain the classification rule displayed in the PCA model.

All the statistical analysis was based on the confidence level of 95%.

3. Results And Discussion

3.1. Identification of the metabolites in the Danshen ethanol precipitation intermediate

To exploit effective information and achieve further process understanding, detailed component assignment was called for. For the reader's convenience, a typical 1H NMR spectrum of ethanol precipitation supernatant was divided into three different regions and displayed in enlarged and detailed mode, consisting of 34 labelled metabolites in the aromatic region (Fig. 1A), fatty hydrocarbon region (Fig. 1B), as well as organic and amino acid region (Fig. 1C). The 34 labelled metabolites in Fig. 3 were identified in this work and their detailed information regarding these metabolites, including chemical shifts and peak multiplicity, was provided in Table 3. Most of these metabolites were identified by referring to the reported data in published pertinent literatures and our previous studies 27, 30, 31. The U.S. National Library of Medicine (PubChem; https://pubchem.ncbi.nlm.nih.gov), 13C NMR and HSQC spectra a were also taken for confirmed reference for the metabolite assignments and are attached in the electronic supplementary information named as Fig. S1 and S2.

Table 3

Chemical shifts and metabolite assignments for metabolites identified in the 1H NMR spectra of the Danshen ethanol precipitation process intermediate

Peak no.

Metabolites

δ 1H (multiplicitya, J in Hz)

Assigned with

1

Leucine

0.96 (t, J = 6.0 Hz)

HSQC, Ref. Co., L&D

2

Isoleucine

1.01 (d, J = 7.0 Hz), 0.94 (s)

HSQC, Ref. Co., L&D

3

Valine

1.04 (d, J = 7.0 Hz), 0.99 (d, J = 7.0 Hz)

Ref. Co., L&D

4

Threonine

1.33 (d, J = 6.5 Hz)

Ref. Co., L&D

5

Alanine

1.48 (d, J = 7.2 Hz)

HSQC, Ref. Co.

6

γ-aminobutyrate

0.94 (m), 2.30 (d, J = 7.4 Hz), 0.99 (d, J = 7.5 Hz)

HSQC, L&D

7

Proline

3.43 (m), 3.34 (m), 2.35 (m), 2.03 (m)

Ref. Co., L&D

8

Glutamic acid

3.80 (t, J = 6.3 Hz), 2.5(m), 2.1(m)

HSQC, Ref. Co.

9

Glutamine

3.78 (t, J = 6.1 Hz), 2.5(m), 2.1 (m)

HSQC, Ref. Co.

10

Aspartic acid

4.05 (dd, J = 7.1, 4.5 Hz), 3.0 (m)

HSQC, Ref. Co., L&D

11

Asparagine

4.01 (dd, J = 7.8, 4.2), 2.9 (m)

HSQC, Ref. Co.

12

Tryptophan

3.30 (dd, J = 15.3, 8.1 Hz)

Ref. Co. L&D

13

Malonate

3.17 (s)

HSQC, Ref. Co., L&D

14

Acetate

1.97 (s)

Ref. Co., L&D

15

Glucose

5.24 (d, J = 3.7 Hz), 4.65 (d, J = 7.9 Hz), 3.8 (m), 3.47 (m), 3.25 (dd, J = 9.3, 7.9 Hz)

HSQC, Ref. Co.

16

Galactose

5.27 (d, J = 3.7 Hz), 4.59 (d, J = 7.9 Hz), 4.05 (m), 3.93 (d, J = 3.5 Hz), 3.77 (m), 3.65 (dd, J = 9.9, 3.5 Hz), 3.49 (dd, J = 9.9, 7.9 Hz)

HSQC, Ref. Co.

17

Fructose

4.05 (m), 3.85 (m), 3.64 (m)

HSQC, Ref. Co.

18

Sucrose

5.41 (d, J = 3.8 Hz), 4.22 (d, J = 8.8 Hz), 4.06 (t, J = 8.6 Hz), 3.87 (m), 3.77 (t, J = 9.5 Hz), 3.68 (s), 3.56 (dd, J = 10.0, 3.9 Hz), 3.48 (t, J = 9.3 Hz)

HSQC, Ref. Co.

19

Raffinose

5.43 (d, J = 3.9 Hz), 5.00 (d, J = 3.7 Hz), 4.23 (m, J = 8.8 Hz), 3.93 (d, J = 2.4 Hz), 3.68 (s), 3.57 (m).

HSQC, Ref. Co.

20

Stachyose

5.43 (d, J = 3.8 Hz), 4.99 (dd, J = 3.6, 2.2 Hz), 4.23 (d, J = 8.8 Hz), 4.14 (dd, J = 7.7, 4.6 Hz), 4.04 (m), 3.79 (m), 3.54 (m)

HSQC, Ref. Co.

21

Salvianolic acid B

(SaB)

δ 7.13–7.06 (m, 2H), 6.93 (d, J = 8.5 Hz, 1H), 6.92–6.86 (m, 4H), 6.80 (dd, J = 8.3, 2.1 Hz, 1H), 6.74 (dd, J = 8.1, 2.1 Hz, 1H), 6.46 (d, J = 8.1 Hz, 1H), 6.30 (d, J = 2.1 Hz, 1H), 6.12 (dd, J = 8.2, 2.1 Hz, 1H), 5.96–5.89 (m, 2H), 3.12 (dd, J = 14.5, 3.7 Hz, 1H), 3.04–2.92 (m, 2H), 2.62 (dd, J = 14.4, 11.2 Hz, 1H), 2.07 (s, 0H).

Ref. Co., L&D

22

Salvianolic acid A

(SaA)

δ 7.72 (d, J = 15.9 Hz, 2H), 7.06 (d, J = 1.9 Hz, 2H), 6.94 (d, J = 8.5 Hz, 2H), 6.90 (d, J = 16.5 Hz, 2H), 6.89–6.81 (m, 4H), 6.75 (d, J = 2.0 Hz, 2H), 6.72 (d, J = 8.5 Hz, 2H), 6.60 (d, J = 8.1 Hz, 2H), 6.50 (dd, J = 8.1, 2.1 Hz, 2H), 6.36 (d, J = 16.5 Hz, 2H), 6.11 (d, J = 15.9 Hz, 2H), 2.97 (dd, J = 14.4, 4.2 Hz, 2H), 2.88 (dd, J = 14.4, 8.1 Hz, 2H)

HSQC, L&D, Ref. Co.

23

Rosmarinic acid

(RA)

7.56 (d, J = 15.9 Hz, 1H), 7.45 (d, J = 16.2 Hz), 6.25 (dd, J = 15.9, 0.9 Hz, 1H), 3.15 (dd, J = 14.4, 4.6 Hz, 1H), 3.06 (dd, J = 14.4, 7.8 Hz, 1H)

HSQC, L&D, Ref. Co.

24

Lithospermic acid

(LA)

7.14 (d, J = 8.5 Hz, 1H), 6.93–6.83 (m, 5H), 6.82 (d, J = 15.4 Hz, 1H), 6.28 (dd, J = 16.0, 0.9 Hz), 5.92 (d, J = 4.6 Hz), 5.11 (dd, J = 8.2, 4.1 Hz), 3.13 (dd, J = 14.3, 4.1 Hz, 1H), 3.03 (dd, J = 14.4, 8.2 Hz, 1H), 2.08 (d, J = 0.7 Hz, 2H)

L&D, Ref. Co.

25

Protocatechuic Aldehyde

(PA)

9.62((s, 2H)), 7.41 (dd, J = 8.2, 2.0 Hz, 2H), 7.33 (d, J = 2.0 Hz, 2H), 6.99 (d, J = 8.2 Hz, 2H)

HSQC, L&D, Ref. Co.

26

Formate

8.45(s)

Ref. Co., L&D

27

Protocatechuic Acid

7.43–7.38 (m), 6.94 (d, J = 8.3 Hz).

HSQC, Ref. Co.

28

Danshensu (DSS)

6.78(d,J = 2.0 Hz), 2.78(dd,J = 14.1, 7.7 Hz)

HSQC, L&D, Ref. Co.

29

Mannotriose

4.68 (d, J = 7.9 Hz), 4.34–3.42 (m)

HSQC, L&D, Ref. Co.

30

Malate

2.63 (dd, J = 16.0, 4.2 Hz, 1H), 4.26(m)

HSQC, L&D, Ref. Co.

31

Succinate

2.59(s)

HSQC, L&D, Ref. Co.

32

Pyroglutamate

2.05(m), 2.42(m), 2.51(m)

HSQC, L&D, Ref. Co.

33

Lactate

1.34(d, J = 6.8 Hz)

HSQC, L&D, Ref. Co.

34

3-hydroxybutyrate

1.14(d, J = 6.3 Hz)

HSQC, L&D, Ref. Co.

* ‘Ref. Co.’ represents a comparison to reference compounds; ‘L&D’ stands for referring to relevant literature and publicly accessible metabolomics databases.

3.2. OPLS-DA for identification of potential critical chemical markers

Fig. 2 displayed two typical full 1H NMR spectra of process intermediate samples collected before and after the process of ethanol precipitation, in which the general signal distribution properties in the region δ 10.00–0.00 seemed to bear certain resemblance visually. However, the proportion of peak area in δ 4.50–3.00 in the whole spectrum was too high to discriminate the rest potential chemical markers in the other region of a spectrum. So, to realize a global and convictive identification of the process potential chemical markers, in this study, according to the spectrum feature of the Danshen preparation, we divided the full spectrum into three regions according to a general partition of organic extracts 19, 32, consisting of organic and amino acid region (δ 3.30–δ 0.50), fatty hydrocarbon region (δ 5.60–δ 3.30, excluding the δ 4.70–δ 4.90 region of residual H2O resonance), as well as the aromatic region (δ 10.00–δ 5.60) and then performed the chemometric analysis separately.

OPLS-DA was applied to identify the potential chemical markers through screening the metabolites in the process intermediates obtained before and after the process of ethanol precipitation. 1H NMR spectra of 3 raw material samples and 6 ethanol precipitation supernatant samples (central points in the design matrix of experiments) were used to construct the models. The three OPLS-DA models and corresponding S-plots (Fig. 3A, 3B and 3C respectively) were developed separately by the signal region of three different fields in the 1H NMR spectra. Each OPLS-DA model was established with one-predictive and one-orthogonal components as the best fitting model, with the p values of CV-ANOVA 1.954\(\times\)10−4, 1.649\(\times\)10−6 and 1.455\(\times\)10−5. The quality of the model was described by the cross-validation parameter Q2, indicating the predictability of the model, and R2X, representing the total explained variables for the X matrix. For the three models, R2X values were 0.936, 0.987, 0.901 and Q2 values were 0.992, 0.999, 0.998, respectively, indicating the good degree of fitting and predictivity of models because of the large R2 (pretty near to 1) and the large Q2 (much more than 0.5). Otherwise, corresponding permutation test plots were displayed in the Fig. 3D, 3E and 3F. The results strongly indicated that the models were valid and predicted the Y value well, since the R2 and Q2 values derived from the permuted data were lower than the original points to the right, as well as the regression of Q2 line intersected at below zero (\(-\)0.859, \(-\)0.491 and \(-\)0.490) on the vertical axis. 

In an S-plot, the data point with a high p(corr) value means a very high reliability while a high p(1) value was partly due to its high variance in the dataset. The positive and negative coefficients indicate positive and negative correlation in the concentration level, respectively. According to the corresponding S-plot, characteristic chemical markers varying more with the process of ethanol precipitation progressing were scattered in the full 1H NMR spectrum. We marked the chemical shift value of the corresponding bucket in the Fig. 1.

In the fatty hydrocarbon region, the chemical shift and coupling patterns of these signals correlate to oxygen-bearing protonated carbons, which are characteristic of protons from sugar moieties in glycosylated metabolites or sugars 33. Because of the severe signal overlap in this region, we can’t discriminate every bucket and its corresponding assignment precisely. However, we can observe decreasing tendency on the content of almost all of the saccharides (signal distribution in the region from 3.5- 4.0 ppm) after the ethanol precipitation. In the amino acid and organic acid region, compounds located in the buckets of 1.94, 2.00, 2.38, 2.40, 2.46, 2.48, 2.51, 3.17 and 3.23 to 3.27 ppm were identified as potential process chemical markers. In the aromatic region, buckets of 5.97, 6.79 to 6.83, 6.87 to 6.93 and 7.03 ppm were digged out as negligible variations with highly significant in the model.

3.3. PCA for ethanol precipitation sample classification

PCA was applied to research the similarities and differences by a global overview in different ethanol precipitation supernatants from the designed experiments. To enhance the interpretability of the PCA model, retention ratios of 27 compounds were used to constitute a data matrix X (n × m) in which n = 38 observations (experiments) and m = 27 variables (compounds) was obtained for subsequent multivariate statistical analysis. Similarity analysis between intermediates was performed by HCA through measuring the distance between all possible sample pairs in a high-dimensional space, using an iterative procedure that either associates or dissociates a group object by object to classify objects 34. The 40 samples were classified using Ward's method employing the Euclidean distance as a measurement for the HCA.

There were 2 principal components (PCs) in the PCA model with an R2X of 0.881 and a Q2 of 0.812, indicating significant explanatory and pretty satisfactorily predictability of the model. In the PCA scatter plot (Fig. 4A), which was generated by the first two PCs (PC1:78.45%; PC2: 9.64%), here was a clear separation of 5 groups, clustered by the similarity according to the height-sorted HCA tree.

N7, N8, N16, N31, N34, N38 were clustered to group 2 and distributed on the far right on t[1]. According to the actual ethanol precipitation operation parameters, in these experiments, the raw materials were to have the highest concentration of ethanol added, and the corresponding level of AEC were also higher than 80%, except for N31. However, the EMR of N31 was 1.15, a particularly low level in the design. Additionally, N7 was identified as outliers in the score plot. Combining the reality, it was an experiment with the most extreme conditions of operation: the highest level of AEC and the lowest level of EMR and MC, followed by the lowest retention ratios of all the compounds.

Experiment N4, N9, N13, N17, N22, N23, N25, N26 were clustered to group 1 and distributed on the left side of group 2 on t[1]. When conducting these experiments, higher level of AEC was adjusted to, with the values of AEC are 72.5% or 80.0%. The similarities between group 1 and 2 was that the concentration of ethanol added were all pretty high (more than 90.0%), and they all used lower MC and EMR, which leads to lower retention of chemical markers in ethanol precipitation supernatants.

On the contrary, experiment N2, N3, N11, N12, N19, N20, N21, N33, N37 were clustered to group 5. They located far away from group 1 in the PCA score plot, indicating the incompatible law of the retention of chemical markers. In these experiments, very low AEC was allocated when conducting the process. The add ethanol solution in this group were all below 80.0%, except for N10 and N19, whose EMR was at level − 1, indicating a potential interaction between EMR and AEC. As seen by these results, according to the sample distribution on t[1], in general, very acceptable discrimination among the samples were convinced that the quality variation was caused mainly by the ethanol related variation.

Experiment N5, N6, N14, N18, N27, N28, N29, N30, N35, N40 were clustered as group 3, in which N28, N29, N30, N35 and N40 went through the same processing as the central points of the experimental matrix. The accuracy of cluster result is verified to a certain extent. However, among this group, N18 and N27 seemed like special cases with higher AEC (80.0%) than the others (72.5%), indicating the potential law that higher EMR and MC might have interaction impact on ethanol precipitation to fix the deviation caused by AEC. This was a mechanism applicable to N6. Besides, N5 and N14 were similar to the central samples but with different MC, indicating that MC might be the secondary factor. Whereas, in the group 4, N1, N15, N24, N32 and N36 went through confused combination of the process variables and seemed hard to dig effective information and make reasonable explanation by intuitive analysis. Hence, data were expected to be of interest to perform further deeper studies and exploration.

3.4. MLR for ethanol precipitation process modeling and understanding

For better understanding of the process of ethanol precipitation, MLR was then used to make the statistical and mechanistic interpretation of the significant variables among experiments in the design matrix. Critical chemical markers identified in Sect. 3.2 were taken as the MLR model indicator to reveal the detailed relationship between the ethanol precipitation process variables and the intermediate quality, so as to analyze how did the process variables affected the process efficiency. The experimental data of the 16 responses, listed in Table S2, was used to fit second-order empirical equations. Regression coefficients of every equation and corresponding statistical results are shown in Table 4. The goodness of fit is expressed by the determination coefficient R2, for example, R2 of γ-aminobutyrate equation is 0.877, indicating 87.7% of the variability could be explained by the model.

Table 4

Regression coefficients of second-order empirical equations for responses of ethanol precipitation

Items

Constant

AEC

EMR

MC

AEC × AEC

MC × MC

AEC × EMR

AEC × MC

R2

γ-aminobutyrate

0.5874 1

-0.185

0.0956

0.0208

/

/

0.0152

0.0172

0.877

P value

0.0000 2

0

0

0.1485

/

/

0.2261

0.3655

Pyroglutamate

0.5946

-0.1906

0.0924

0.0281

0.0233

/

0.0334

/

0.873

P value

0

0

0

0.0565 3

0.0884

/

0.0577

/

Succinate

0.6129

-0.1607

0.0815

0.0216

0.0296

/

/

/

0.908

P value

0

0

0

0.0357

0.0028

/

/

/

Acetate

0.3805

-0.0905

0.073

0.0104

/

/

0.0394

0.043

0.549

P value

0

0.0001

0.001

0.6088

/

/

0.1118

0.0453

Malonate

0.7765

-0.0849

0.0792

0.014

/

/

0.0477

0.0346

0.883

P value

0

0

0

0.0918

/

/

0

0.0002

Fructose

0.7113

-0.1305

0.0904

0.033

/

/

0.0358

0.0198

0.897

P value

0

0

0

0.0018

/

/

0.004

0.0547

Sucrose

0.708

-0.1616

0.1024

0.033

/

/

0.0251

0.0204

0.923

P value

0

0

0

0.0019

/

/

0.0389

0.05

Raffinose

0.5066

-0.2288

0.0857

0.0029

/

/

0.0217

0.0231

0.875

P value

0

0

0

0.8561

/

/

0.2652

0.1676

Stachyose

0.4503

-0.2908

0.1094

0.0229

/

/

-0.0367

0.0008

0.895

P value

0

0

0

0.1859

/

/

0.0787

0.9644

Mannotriose

0.3898

-0.2465

0.0882

0.0111

/

/

-0.0249

0.0057

0.861

P value

0

0

0

0.5106

/

/

0.2205

0.7414

DSS

0.8343

-0.2006

0.1089

0.0338

/

/

0.0213

0.0175

0.896

P value

0

0

0

0.0113

/

/

0.1659

0.185

LA

0.6263

-0.1354

0.0745

0.014

/

/

0.0223

0.0086

0.828

P value

0

0

0

0.2269

/

/

0.1091

0.4634

PA

0.909

0.0074

0.0224

-0.0113

-0.0189

/

0.0174

0.326

P value

0

0.4306

0.0208

0.1972

0.0327

/

0.0754

RA

0.8163

-0.042

0.0476

0.0189

/

/

0.0203

0.0184

0.735

P value

0

0

0

0.0147

/

/

0.0266

0.0197

SaB

0.6822

-0.1247

0.0791

0.0248

/

/

0.0182

0.0227

0.903

P value

0

0

0

0.0067

/

/

0.0849

0.0144

SaA

0.6477

-0.0331

0.0056

-0.0217

/

/

0.0213

0.0149

0.556

P value

0

0.0001

0.4414

0.0049

/

/

0.0182

0.0511

1 In each equation, the regression coefficients displayed are computed for centered and orthogonal scaled data.
2 The variable which had a large coefficient with a small p value (< 0.05) was considered to show significant influence and would be reserved in the equation, and the other would be deleted.
3 Linear term could not be deleted if the second and third order terms involving the factor having significance.


Terms in the Table 4 were applied to develop the empirical equation of γ‐aminobutyrate as the following mode:

which meant EMR and MC had positive linear effects on the retention ratio of γ‐aminobutyrate evidently. On the contrary, AEC showed negative linear impacts. The laws of EMR, MC and AEC impacting the rest of the 15 potential chemical markers can be all declared by the empirical equation developed by the coefficients in Table 4.

Familiar variation rules were observed in most of other chemical markers, including acetate, malonate, fructose, sucrose, raffinose, stachyose, mannotriose, DSS, LA, RA, SaB, SaA. Changing rules of several phenolic acids studied in this article were consistent with previous reports 12, 14, 15. In the model of PA, the values of R2 are less than 0.5, which suggests that the models cannot explain most of the variability in the observed data and show significant lack of fit. According to the original data, in the most processes of ethanol precipitation, retention ratio of PA kept more than 0.8, indicating PA owned less risk of fluctuation during the ethanol precipitation progress and was an easy-to-control indicator of ethanol precipitation, although it suffered loss to some extent.

Because the changing rate was indicated by the absolute coefficient value: the larger the absolute coefficient value of AEC in the model was, the more drastic changes happened to the corresponding compound in the process when AEC changing. According to the phenomena appeared in this study, the main retention of kinds of saccharides in the Danshen ethanol precipitation supernatant were fructose and sucrose, when using the central parameters to conduct the process, the average of the retention ratio were 0.7655 and 0.7755, while raffinose, mannotriose and stachyose’s retention ratio were only 0.5503, 0.4576 and 0.4919. In the models of fructose, sucrose, raffinose, mannotriose and stachyose, a law with traces to follow was discovered for the first time: retention ratios of tetra-, tri-, di- and mono-saccharide were affected by the ethanol concentration of the ethanol precipitation mixed solution obviously. AEC coefficient values of the tetra-, tri-, di- and mono-saccharide models were − 0.2908 (stachyose), -0.2288 and − 0.2465 (raffinose and mannotriose), -0.1616 (sucrose) as well as -0.130 (fructose), respectively, meaning the removal rate of stachyose was the highest through the process of ethanol precipitation compared with the other saccharides under the same AEC value.

4. Discussion

In order to achieve better process characterization of critical control point in the multi-step manufacturing chain of an HM, this article takes one of the most widely used separation and purification technology in the pretreatment of herbal medicinal preparations: the process of ethanol precipitation as the study object. 1H NMR spectroscopy served as a semi-quantitative analysis tool for the research to supply a set of much more comprehensive and global compound information than previous studies.

4.1 Identification of potential critical chemical markers

16 compounds varied significantly were screened out as the process chemical markers of the ethanol precipitation by the OPLS-DA, including several small molecular amino acids and organic acids, phenolic acids and saccharides, filling the gap of the detailed indicator absence in the previous researches. According to the assignment results in Fig. 1, in the amino acid and organic acid region, influence of these high-field signals in the clustering of the 1H NMR bucketed profiles is more evident in the discrimination between γ‐aminobutyrate, pyroglutamate, succinate, acetate, malonate. Besides, typical signals of glucose and mannotriose in this field also contributed a lot to the discrimination. In the fatty hydrocarbon region, the tight clustering of the intermediate samples was predominantly caused by the signals of fructose, sucrose, raffinose, stachyose and mannotriose extracted from Danshen. In the aromatic region, it was the inconstant Danshen phenolic acids, including DSS, LA, PA, RA, SaB and SaA, varying significantly along the process. Metabolites aforementioned are identified as the critical chemical markers of the Danshen ethanol precipitation to serves as a reliable window into an understanding of the process, as well as the process efficiency evaluation.

4.2 Process characterization by PCA and MLR

PCA was applied to cluster the samples collected from the designed experimental matrix and MLR analysis was applied to study the relationship between the process variables and the chemical markers with a quadratic equation. It was thus concluded from PCA that samples were reasonably distinguished as a function of ethanol precipitation of process variables. Rules above can help with drawing the conclusion that the PCA result displaying an obvious clustering in the aspect of the parameter of AEC, a priority, as well as possible interaction between AEC and EMR, EMR and MC. PCA enabled the preliminary identification of which parameter’s fluctuation offered the highest variability and possible sample grouping based on the chemical component, in the characterization and authentication of ethanol concentration-based pharmaceutical preparations of HMs. Then, according to the MLR results, obviously, they were the reasonable explanations of the cluster results displayed in the PCA results in Sect. 3.3: when we changed one variable in the process of ethanol precipitation, the other changes in other respects would have the potential ability to realize corrections to ensure the consistency of quality of process product. The quadratic terms of AEC and EMR, AEC and MC appeared to be also having obvious effects, while the others had no significance, which indicated the control of AEC owned the highest priority in the process of ethanol precipitation than EMR and MC. This result also meets with the ethanol - water equilibrium regulation already reported 7, 9, 10 of chemical compounds in Danshen.

5. Conclusions

Results of the work promote the further and improved understanding of ethanol precipitation process, as well as prove that adjusting of the process variables had the potential to realize corrections to ensure the consistency of quality of process product. This work provides a combined method easily to be applied to other herbal medicinal preparations for measuring process capability on the molecular level by 1H NMR and MLR, so as to conduct process characterization and understanding, which finally contributes to process control and quality guarantee. Methodology promoted in this study also provides a more in-depth theoretical reference thought for the quality control of herb medicines.

Future studies will investigate the application of 1H NMR as a tool to explore novel process control strategies, like make endpoint determination, abnormity diagnosis and so on, are also placed on the research agenda. In addition, we can look forward to integration with the 1H NMR assisted testing and controlling solutions to provide more capabilities across the life cycle of HMs.

Abbreviations

HM

herbal medicine

1H NMR

proton nuclear magnetic resonance

OPLS-DA

orthogonal partial least squares-discriminant analysis

PCA

principle component analysis

HCA

hierarchical classification analysis

PC

principal component

MLR

multiple linear regression

HSQC

1H-13C heteronuclear single quantum coherence

FID

free induction decay

S/N

signal-to-noise ratio (S/N)

TSP

3-(trimethylsilyl) propionic-2, 2, 3, 3-d4 acid sodium salt

DSS

danshensu

LA

lithospermic acid

PA

protocatechuic aldehyde

RA

rosmarinic acid

SaB

salvianolic acid A

SaA

salvianolic acid B

AEC

apparent ethanol concentration

EMR

ethanol-material ratio

MC

moisture concentration

Declarations

Ethics approval and consent to participate

Not applicable.

Consent for publication

Not applicable.

Availability of data and materials

The datasets generated and/or analysed during the current study are not publicly available due [REASON WHY DATA ARE NOT PUBLIC] but are available from the corresponding author on reasonable request.

Competing interests

Not applicable.

Funding

The authors are grateful for financial support from National Science & Technology Major Project of China (2018ZX09201011-002).

Authors' contributions

Fang Zhao and Wen-zhu Li—co-first author

Affiliations

Pharmaceutical Informatics Institute, College of Pharmaceutical Sciences, Zhejiang University, Hangzhou 310058, China

Fang Zhao, Wen-zhu Li, Jian-yang Pan, Hai-bin Qu

Contributions

FZ and WL contributed to investigation, methodology, experimentation, data analyses, data curation and paper writing. JP contributed to the project administration and resource reservation. HQ contributed to funding acquisition, conceptualization, project administration and paper review. All authors read and approved the final manuscript.

Corresponding author

Correspondence to Prof. Hai-bin Qu ([email protected]). Tel.: +86 571 88208428; fax: +86 571 88208428.

Acknowledgements

Not applicable.

References

  1. World Health Organization. WHO global report on traditional and complementary medicine 2019. Geneva: World Health Organization; 2019. https://apps.who.int/iris/handle/10665/312342.
  2. Wei XC, Cao B, Luo CH, Huang HZ, Tan P, Xu XR, Xu RC, Yang M, Zhang Y, Han L, Zhang DK. Recent advances of novel technologies for quality consistency assessment of natural herbal medicines and preparations. Chin Med. 2020;15:56. https://doi.org/10.1186/s13020-020-00335-9.
  3. Leong F, Hua X, Wang M, Chen TK, Song YL, Tu PF, Chen XJ. Quality standard of traditional Chinese medicines: comparison between European Pharmacopoeia and Chinese Pharmacopoeia and recent advances. Chin Med. 2020;15:76. https://doi.org/10.1186/s13020-020-00357-3.
  4. Li Y, Shen Y, Yao CL, Guo DA. Quality assessment of herbal medicines based on chemical fingerprints combined with chemometrics approach: A review. J Pharm Biomed Anal. 2020;185:113215. https://doi.org/10.1016/j.jpba.2020.113215.
  5. Jiang Y, David B, Tu PF, Barbin Y. Recent analytical approaches in quality control of traditional Chinese medicines—A review. Anal Chim Acta. 2010;657:9–18. https://doi.org/10.1016/j.aca.2009.10.024.
  6. Andrade LA, Oliveira SD, Nunes CA, Pereira J. Experimental techniques for the extraction of taro mucilage with enhanced emulsifier properties using chemical characterization. Food Chem. 2020; 327,127095. https://doi.org/10.1016/j.foodchem.2020.127095.
  7. Bouchard A, Hofland GW, Witkamp GJ. Properties of sugar, polyol, and polysaccharide water – ethanol Solutions. J Chem Eng Data. 2007;52:1838–42. https://doi.org/10.1021/je700190m.
  8. Gong XC, Wang SS, Qu HB. Solid-liquid equilibria of d-glucose, d-fructose and sucrose in the mixture of ethanol and water from 273.2 K to 293.2 K. Chinese J Chem Eng. 2011;19:217–22. https://doi.org/10.1016/S1004-9541(11)60157-2.
  9. Zhang L, Gong XC, Wang YF, Qu HB. Solubilities of protocatechuic aldehyde, caffeic acid, d-galactose, and d-raffinose pentahydrate in ethanol–water solutions. J Chem Eng Data. 2012;57:2018–22. https://doi.org/10.1021/je300323g.
  10. Gong XC, Wang C, Zhang L, Qu HB. Solubility of xylose, mannose, maltose monohydrate, and trehalose dihydrate in ethanol–water solutions. J Chem Eng Data. 2012;57:3264–9. https://doi.org/10.1021/je300885g.
  11. Zhang L, Yan BJ, Gong XC, Yu LX, Qu HB. Application of quality by design to the process development of botanical drug products: a case study. AAPS Pharmscitech. 2013;14:277–86. https://doi.org/10.1208/s12249-012-9919-8.
  12. Gong XC, Li Y, Guo ZT, Qu HB. Control the effects caused by noise parameter fluctuations to improve pharmaceutical process robustness: A case study of design space development for an ethanol precipitation process. Sep Purif Technol. 2014;132:126–37. https://doi.org/10.1016/j.seppur.2014.05.014.
  13. Huang HX, Qu HB. In-line monitoring of alcohol precipitation by near-infrared spectroscopy in conjunction with multivariate batch modeling. Anal Chim Acta. 2011;707:47–56. https://doi.org/10.1016/j.aca.2011.09.031.
  14. Gong XC, Yan AY, Qu HB. Optimization for the ethanol precipitation process of botanical injection: indicator selection and factor influences. Sep Purif Technol. 2014;49:619–26. https://doi.org/10.1080/01496395.2013.840000.
  15. Zhang L, Gong XC, Qu HB. Optimizing the alcohol precipitation of Danshen by response surface methodology. Sep Purif Technol. 2013;48:977–83. https://doi.org/10.1080/01496395.2012.712590.
  16. Yan BJ, Li Y, Guo ZT, Qu HB. Quality by design for herbal drugs: a feedforward control strategy and an approach to define the acceptable ranges of critical quality attributes. Phytochem Anal. 2014;25:59–65. https://doi.org/10.1002/pca.2463.
  17. Shyur LF, Yang NS. Metabolomics for phytomedicine research and drug development. Curr Opin Chem Biol. 2008;12:66–71. https://doi.org/10.1016/j.cbpa.2008.01.032.
  18. Lindon JC, Holmes E, Nicholson JK. Metabonomics techniques and applications to pharmaceutical research & development. Pharm Res-Dordr. 2006;23:1075–88. https://doi.org/10.1007/s11095-006-0025-z.
  19. Heyman HM, Meyer JJM. NMR-based metabolomics as a quality control tool for herbal products. S Afr J Bot. 2012;82:21–32. https://doi.org/10.1016/j.sajb.2012.04.001.
  20. Fan G, Zhang MY, Zhou XD, Lai XR, Yue QH, Tang C, et al. Quality evaluation and species differentiation of Rhizoma coptidis by using proton nuclear magnetic resonance spectroscopy. Anal Chim Acta. 2012;747:76–83. https://doi.org/10.1016/j.aca.2012.08.038.
  21. Tarachiwin L, Katoh A, Ute K, Fukusaki E. Quality evaluation of Angelica acutiloba Kitagawa roots by 1H NMR-based metabolic fingerprinting. J Pharm Biomed Anal. 2008;48:42–8. https://doi.org/10.1016/j.jpba.2008.04.025.
  22. Chauthe SK, Sharma RJ, Aqil F, Gupta RC, Singh IP. Quantitative NMR: an applicable method for quantitative analysis of medicinal plant extracts and herbal products. Phytochem Anal. 2012;23:689–96. https://doi.org/10.1002/pca.2375.
  23. Li ZY, Li J, Zhang ZZ, Mi X, Du GH, Qin XM. NMR-based metabolomic analyses for the componential differences and the corresponding metabolic responses of three batches of Farfarae Flos. Chemometr Intell LaB. 2017;165:1–10. https://doi.org/10.1016/j.chemolab.2017.03.010.
  24. Jiang MM, Jiao YJ, Wang YF, Xu L, Wang M, Zhao BC, et al. Quantitative profiling of polar metabolites in herbal medicine injections for multivariate statistical evaluation based on independence principal component analysis. Plos ONE. 2014;9:e105412. https://doi.org/10.1371/journal.pone.0105412.
  25. Chan PH, Zheng KY, Tsim KW, Lam H. Metabonomic analysis of water extracts from Chinese and American ginsengs by 1H nuclear magnetic resonance: identification of chemical profile for quality control. Chin Med. 2012;7:25. https://doi.org/10.1186/1749-8546-7-25.
  26. Wang LL, Ma RF, Liu CY, Liu HX, Zhu RY, Guo SZ, et al. Salvia miltiorrhiza: A potential red light to the development of cardiovascular diseases. Curr Pharm Des. 2017;23:1077–97. https://doi.org/10.2174/1381612822666161010105242.
  27. Zhao F, Li WZ, Pan JY, Chen ZQ, Qu HB. A novel critical control point and chemical marker identification method for the multi-step process control of herbal medicines via NMR spectroscopy and chemometrics. RSC Adv. 2020;10:23801–12. https://doi.org/10.1039/D0RA03172K.
  28. Noda I. Scaling techniques to enhance two-dimensional correlation spectra. J Mol Struct. 2008; 883–4, 216–227. https://doi.org/10.1016/j.molstruc.2007.12.026.
  29. Aiken LS, West SG. Multiple regression: Testing and interpreting interactions. Newbury Park: Sage Publications; 1991.
  30. Li WZ, Zhao F, Pan JY, Qu HB. Influence of ethanol concentration of extraction solvent on metabolite profiling for Salviae Miltiorrhizae Radix et Rhizoma extract by 1H NMR spectroscopy and multivariate data analysis. Process Biochem. 2020;97:158–67. https://doi.org/10.1016/j.procbio.2020.06.008.
  31. Pan JY, Gong XC, Qu HB. Quantitative 1H NMR method for hydrolytic kinetic investigation of salvianolic acid B. J Pharm Biomed Anal. 2013;85:28–32. https://doi.org/10.1016/j.jpba.2013.06.020.
  32. Gödecke T, Napolitano JG, Rodríguez Brasco MF, Chen SN, Jaki BU, Lankin DC, et al. Validation of a generic quantitative 1H NMR method for natural products analysis. Phytochem Analysis. 2013;24:581–97. https://doi.org/10.1002/pca.2436.
  33. Song JF, Wu G, Li T, Liu CQ, Li DJ. Correction to: Changes in the sugars, amino acids and organic acids of postharvest spermine-treated immature vegetable soybean (Glycine max L. Merr.) as determined by 1H NMR spectroscopy. Food Prod Process Nutr. 2020;2:7. https://doi.org/10.1186/s43014-020-00021-1.
  34. Uarrota VG, Moresco R, Coelho B, Nunes EC, Peruch LA, Neubert EO, et al. Metabolomics combined with chemometric tools (PCA, HCA, PLS-DA and SVM) for screening cassava (Manihot esculenta Crantz) roots during postharvest physiological deterioration. Food Chem. 2014;161:67–78. https://doi.org/10.1016/j.foodchem.2014.03.110.