Table 1. Patient and tumor characteristics.
Variables Number (%) or median (range)
Number of patients 249
Follow-up period, months 104.2 (1.0–218.8)
Age at surgery, yrs 62 (25–89)
Gender
Male 176 (70.7%)
Female 73 (29.3%)
ECOG-PS
0 203 (81.5%)
≥1 37 (14.9%)
Unknown 9 (3.6%)
Affected Kidney
Right 129 (51.8%)
Left 120 (48.2%)
eGFR at surgery, ml/min
≥60 203 (81.5%)
<60 45 (18.1%)
Unknown 1 (0.4%)
Surgical procedure
Nephrectomy 213 (85.5%)
Partial nephrectomy 36 (14.5%)
Pathological subtype
Clear cell 211 (84.7%)
Non-clear cell 38 (15.3%)
Pathological size, cm 4.3 (1.0-20.0)
Pathological Stage
I 144 (57.8%)
II 11 (4.4%)
III 58 (23.3%)
IV 36 (14.5%)
Furhman Grade
1 44 (17.7%)
2 105 (42.2%)
3 72 (28.9%)
4 28 (11.2%)
Table 2. Parameters of each group with high and low expression of HE4 in the tumor tissue.
High expression (n=32) Low expression (n=215)
Variables Number (%) or median (range) p
Age, yrs 61.5 (27-79) 62 (34-89) 0.140
Gender
Male 23 (71.9%) 152 (70.7%)
Female 9 (28.1%) 63 (29.3%) 0.891
ECOG-PS
0 28 (87.5%) 174 (84.5%)
≥1 4 (12.5%) 32 (15.5%) 0.656
eGFR at surgery, ml/min
≥60 28 (87.5%) 174 (81.3%)
<60 4 (12.5%) 40 (18.7%) 0.394
Pathological size, cm 4.8 (1.2-12.0) 4.0 (1.0-20.0) 0.362
Pathological stage
1-2 22 (68.8%) 132 (61.4%)
3-4 10 (31.2%) 83 (38.6%) 0.423
Furhman Grade
1-2 15 (46.9%) 132 (61.4%)
3-4 17 (53.1%) 83 (38.6%) 0.118
Pathological subtype
Clear cell 20 (62.5%) 190 (88.4%)
Non-clear cell 12 (37.5%) 25 (11.6%) <0.001
HE4 expression in the renal cortex tissue (positive: ≥5%)
Positive 10 (33.3%) 81 (40.9%)
Negative 20 (67.7%) 117 (59.1%) 0.430
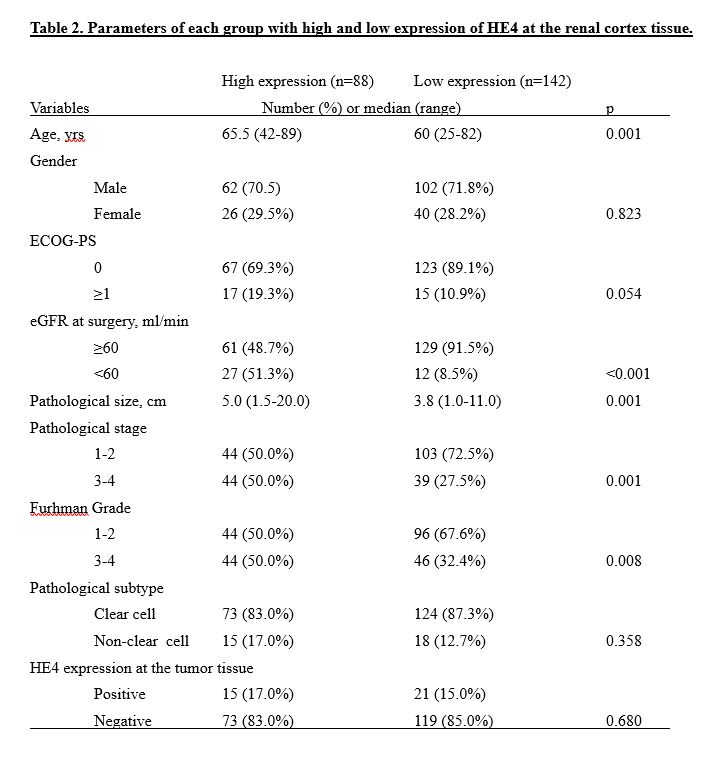
Table 3. Parameters of each group with high and low expression of HE4 in the renal cortex tissue.
High expression (n=88) Low expression (n=142)
Variables Number (%) or median (range) p
Age, yrs 65.5 (42-89) 60 (25-82) 0.001
Gender
Male 62 (70.5%) 102 (71.8%)
Female 26 (29.5%) 40 (28.2%) 0.823
ECOG-PS
0 67 (69.3%) 123 (89.1%)
≥1 17 (19.3%) 15 (10.9%) 0.054
eGFR at surgery, ml/min
≥60 61 (48.7%) 129 (91.5%)
<60 27 (51.3%) 12 (8.5%) <0.001
Pathological size, cm 5.0 (1.5-20.0) 3.8 (1.0-11.0) 0.001
Pathological stage
1-2 44 (50.0%) 103 (72.5%)
3-4 44 (50.0%) 39 (27.5%) 0.001
Furhman Grade
1-2 44 (50.0%) 96 (67.6%)
3-4 44 (50.0%) 46 (32.4%) 0.008
Pathological subtype
Clear cell 73 (83.0%) 124 (87.3%)
Non-clear cell 15 (17.0%) 18 (12.7%) 0.358
HE4 expression in the tumor tissue (positive: ≥5%)
Positive 13 (14.8%) 17 (12.1%)
Negative 75 (85.2%) 123 (87.9%) 0.567
Table 4. Univariate and multivariate Cox proportional hazards regression analysis for OS.
Univariate analysis Multivariate analysis
Variables p HR (95% CI) p
Age at surgery (years): >60 (ref. ≤60) 0.081
Gender: Female (ref. Male) 0.979
ECOG-PS: ≥1 (ref. 0) <0.001 2.600 (1.428-4.735) 0.002
eGFR: <60ml/min (ref. ≥60ml/min) 0.008 1.441 (0.759-2.735) 0.264
Pathological size: ≥5cm (ref. <5cm) <0.001 1.171 (0.639-2.148) 0.610
Pathological stage: ≥3 (ref. 1,2) <0.001 4.460 (2.246-8.856) <0.001
Furhman grade: ≥3 (ref. 1,2) <0.001 1.271 (0.663-2.435) 0.470
Pathological subtype: non-clear cell (ref. clear cell) 0.002 2.056 (1.119-3.776) 0.020
HE4 expression at the tumor tissue: positive (ref. negative) 0.287
HE4 expression at the cortex tissue: positive (ref. negative) <0.001 2.024 (1.087-3.770) 0.026
Table 5. Univariate and multivariate Cox proportional hazards regression analysis for CSS.
Univariate analysis Multivariate analysis
Variables p HR (95% CI) p
Age at surgery (years): >60 (ref. ≤60) 0.582
Gender: Female (ref. Male) 0.652
ECOG-PS: ≥1 (ref. 0) <0.001 2.976 (1.483-5.971) 0.002
eGFR: <60ml/min (ref. ≥60ml/min) 0.020 1.076 (0.503-2.301) 0.850
Pathological size: ≥5cm (ref. <5cm) <0.001 2.441 (1.011-5.890) 0.047
Pathological stage: ≥3 (ref. 1,2) <0.001 8.649 (2.800-26.717) <0.001
Furhman grade: ≥3 (ref. 1,2) <0.001 1.471 (0.639-3.385) 0.365
Pathological subtype: non-clear cell (ref. clear cell) 0.098
HE4 expression at the tumor tissue: positive (ref. negative) 0.192
HE4 expression at the cortex tissue: positive (ref. negative) <0.001 2.507 (1.119-5.615) 0.025
Table 6. Univariate and multivariate Cox proportional hazards regression analysis for RFS.
Univariate analysis Multivariate analysis
Variables p HR (95% CI) p
Age at surgery (years): >60 (ref. ≤60) 0.290
Gender: Female (ref. Male) 0.472
ECOG-PS: ≥1 (ref. 0) <0.001 3.208 (1.341-7.676) 0.009
eGFR: <60ml/min (ref. ≥60ml/min) <0.001 1.661 (0.768-3.592) 0.198
Pathological size: ≥5cm (ref. <5cm) <0.001 2.106 (0.975-4.547) 0.058
Pathological stage: ≥3 (ref. 1,2) <0.001 5.869 (2.644-13.028) <0.001
Furhman grade: ≥3 (ref. 1,2) <0.001 1.277 (0.598-2.725) 0.527
Pathological subtype: non-clear cell (ref. clear cell) 0.826
HE4 expression at the tumor tissue: positive (ref. negative) 0.148
HE4 expression at the cortex tissue: positive (ref. negative) <0.001 1.292 (0.595-2.808) 0.517