Study participants and clinical data: This study was approved by the Human Subject Research Ethics Board at Western University (5-7). Patients who were admitted to our academic ICU and suspected of having COVID19 based on standard hospital screening procedures and who had acute non-cardiogenic hypoxic respiratory failure requiring mechanical ventilation > 48h were consecutively enrolled in the study. Patients were than separated into cohorts, either COVID19+ or COVID19-, based on detection of two SARS-CoV-2 viral genes using polymerase chain reaction (PCR). Patient baseline characteristics were recorded on admission and included age, sex, severity of illness scores, comorbidities, hematologic labs, creatinine, arterial partial pressure to inspired oxygen (P/F) ratio, chest x-ray findings and sepsis diagnosis using Sepsis 3.0 criteria (12). Clinical interventions received in the ICU included use of antibiotics, anti-viral agents, systemic corticosteroids, vasoactive medications, renal replacement therapy, high flow oxygen therapy, and mechanical ventilation (invasive and non-invasive). Final participant groups were constructed by identifying 7 COVID19+ patients and then matching to 7 COVID19- patients by age and sex only (5-7). These patients have been included in previous studies performed by our group and this is a retrospective evaluation of the biological data from these patients (5-7). Further, given the exploratory nature of the study, no sample size calculation was performed.
Blood draws: Blood was collected from patients upon ICU admission using standard operating procedures to ensure all samples were treated rapidly and equally (5-7). Blood was obtained via indwelling catheters and placed immediately on ice. Once transferred to a negative pressure hood, the blood was centrifuged and the buffy coat was isolated, aliquoted at 250 µl and frozen at -80°C. All samples were stored frozen in the Translational Research Centre, London, Ontario (directed by Dr. D.D. Fraser; https://translationalresearchcentre.com/) until use and freeze/thaw cycles were avoided (13, 14).
RNA isolation: Buffy coat cells were homogenized in Trizol LS and centrifuged at 12,000 rcf to remove cell debris. Following chloroform extraction, RNA was isolated using the RNeasy Micro Plus Kit (Qiagen) according to the manufacturer’s protocol.
Illumina NextSeq Next Generation Sequencing: All samples were sequenced at the London Regional Genomics Centre (Robarts Research Institute, London, Ontario, Canada; http://www.lrgc.ca) using the Illumina NextSeq 500 (Illumina Inc., San Diego, CA).
Total RNA samples were quantified using the NanoDrop (Thermo Fisher Scientific, Waltham, MA) and quality was assessed using the Agilent 2100 Bioanalyzer (Agilent Technologies Inc., Palo Alto, CA) and the RNA 6000 Nano kit (Caliper Life Sciences, Mountain View, CA). Only samples with an RNA integrity number ≥ 6.0 were used. The samples were then processed using the Vazyme VAHTS Total RNA-seq (H/M/R) Library Prep Kit for Illumina (Vazyme, Nanjing, China) which includes ribosomal RNA (rRNA) reduction.
Briefly, samples were rRNA depleted, fragmented, and utilized for cDNA synthesis and PCR amplification with indexed primers to permit equimolar pooling of samples into one library. The pooled library size distribution was assessed on an Agilent High Sensitivity DNA Bioanalyzer chip, and quantitated using the Qubit 2.0 Fluorometer. (Thermo Fisher Scientific, Waltham, MA).
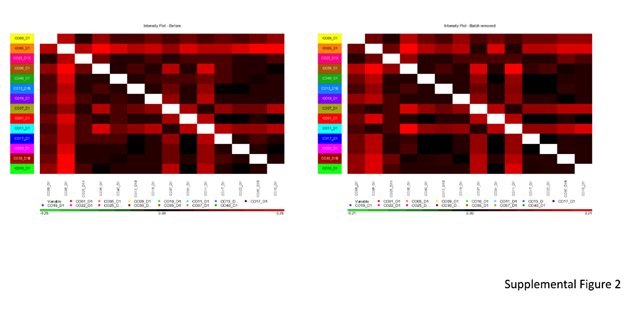
The library was sequenced on the Illumina NextSeq 500 as single end runs, 1 x76 bp, using High Output v2 kits (75 cycles). Fastq data files were analyzed using Partek Flow (St. Louis, MO; Suppl. Fig. 1). After importation, the data were aligned to the Homo sapiens genome hg19 using STAR 2.7.3a and annotated using RefSeq Transcripts 93. Features with more than 18 reads were normalized using Trimmed Mean of M-values (TMM) (https://doi.org/10.1186/gb-2010-11-3-r25) followed by adding 0.0001. Any batch effect due to the run date was removed using Partek Flow’s Remove batch effect tool based on the results of the PCA plot and a dissimilarity plot analysis (Fig. 1A and Suppl. Fig. 2). The gene-specific analysis (GSA) function of Partek Flow was then used to determine differential gene expression in COVID19+ vs. COVID19- patients using Akaike Information Criteria corrected (AICc) – a repeated measure analysis using mixed models methodology. The filtered gene list (fold change of 1.5 and FDR p value > 0.0545) was then submitted to Metascape (https://metascape.org/gp/index.html#/main/step1) using express analysis of H. sapiens gene IDs (15). A subset of enriched terms were selected and rendered as a network plot, where terms with a similarity > 0.3 were connected by edges. Terms with the lowest p-values from each of the 20 clusters were selected, with the constraint that there are no more than 15 terms per cluster and no more than 250 terms in total. The network was visualized using Metascape, where each node represented an enriched term and was colored first by cluster ID and then by p-value. The filtered gene list was also analyzed for enriched KEGG pathway terms.
Gene Set Enrichment Analysis (GSEA): Functional enrichment of the cumulative changes in gene expression across a priori defined gene sets was performed in GSEA to avoid the limitations of single-gene differential gene expression methods (16). All 14,810 genes that passed quality control were included in this analysis. The MSigDB collection was used to perform three main enrichment analyses: (i) Hallmark gene set (50 gene sets containing overlaps between MSigDB collections that display coordinate expression); (ii) Canonical Pathways (C2, 2232 gene sets); and (iii) regulatory target gene sets (C3, transcription factors, 1137 gene sets) (17). The gene sets included in the analysis were limited to those that contained between 10 and 500 genes. Permutation was conducted 1,000 times according to default-weighted enrichment statistics and by using a signal-to-noise metric to rank genes according to their differential expression levels across the COVID19+ vs. COVID19- groups. Significant gene sets were defined as those with an FDR ≤ 0.1. Visualization and network analyses were performed using the EnrichmentMap application for Cytoscape 3.8.0 (https://cytoscape.org/) according to default parameters (18). To determine the degree of similarity between gene sets (nodes), the combined coefficient using a merged version of the jacquard and overlap similarity coefficients was used to define edges (i.e., connecting lines) between the nodes (cut-off 0.375).
Population Statistics: Medians (IQRs) and frequency (%) were utilized to describe patient baseline characteristics for continuous and categorical variables, respectively. Continuous variables were compared using two-tailed Mann-Whitney U or Kruskal-Wallis tests, as appropriate. Categorical variables were compared using Fisher's exact test. SPSS version 26 (IBM Corp., Armonk, NY, USA) was used to perform all population statistics and p-values <0.05 were considered statistically significant.