DOI: https://doi.org/10.21203/rs.3.rs-654484/v1
Background: Diabetic retinopathy (DR) is a complication of diabetes mellitus, which if left untreated may lead to complete vision loss. Early diagnosis and treatment is the key to prevent further complications of DR. Computer-aided diagnosis is a very effective method to support ophthalmologists, as manual inspection of pathological changes in retina images are time consuming and expensive. In recent times, Machine Learning and Deep Learning techniques have subsided conventional rule based approaches for detection, segmentation and classification of DR stages and lesions in fundus images.
Method: In this paper, we present a comparative study of the different state-of-the-art preprocessing methods that have been used in deep learning based DR classification tasks in recent times and also propose a new unsupervised learning based retinal region extraction technique and new combinations of preprocessing pipelines designed on top of it. Efficacy of different existing and new combinations of the preprocessing methods are analyzed using two publicly available retinal datasets (EyePACS and APTOS) for different DR stage classification tasks, such as referable DR, DR screening, and five-class DR grading, using a benchmark deep learning model (ResNet-50).
Results: It has been observed that the proposed preprocessing strategy composed of region of interest extraction through K-means clustering followed by contrast and edge enhancement using Graham’s method and z-score intensity normalization achieved the highest accuracy of 98.5%, 96.51% and 90.59% in DR-screening, referable-DR, and DR gradation tasks respectively and also achieved the best quadratic weighted kappa score of 0.945 in DR grading task. It achieved best AUC-ROC of 0.98 and 0.9981 in DR grading and DR screening tasks respectively.
Conclusion: It is evident from the results that the proposed preprocessing pipeline composed of the proposed ROI extraction through K-means clustering, followed by edge and contrast enhancement using Graham’s method and then z-score intensity normalization outperforms all other existing preprocessing pipelines and has proven to be the most effective preprocessing strategy in helping the baseline CNN model to extract meaningful deep features.
Diabetic Retinopathy (DR) is defined as the damage of the micro-vascular system in the retina, due to prolonged hyperglycemia and blockages or clots that are formed due to high level of glucose in the small blood vessels of the retina. This in effect raptures the wall of those weak vessels due to high pressure and leakage of blood on surface of retina which leads to vascular disorder, blurred vision, and sometimes complete blindness1. DR is one of the most severe microvascular complications in patients with type 2 Diabetes Mellitus and has become the leading cause of vision loss resulting irreversible blindness among working-aged adults (20–74 years)1, 2. A recent hospital-based study conducted by Bhutia et al.3 on the type 2 diabetic population in north east India have reported 17.4% overall prevalence of diabetic retinopathy, similar to that observed by Rema et al. (17.6%)4 and Raman et al. (18.1%) 5, in studies done in the southern states of India.
Figure 1 depicts the normal retinal components such as blood vessels, optic disc, macula, and fovea. It also shows different DR anomalies like microaneurysm, exudates and hemorrhages which are the main pathognomonic signs of DR. DR can be broadly classified into two main stages namely non-proliferative (NPDR) and proliferative (PDR), based on its severity of vascular degeneration and other ischemic changes in retina. NPDR is an early stage, which contains at least one microaneurysm or hemorrhage with or without presence of any hard exudates. NPDR is further subdivided into four stages i) mild (presence of MA), ii) moderate (appearance of HM and EX along with MA), and iii) severe (venous beading in at least two quadrants and MA, HM in four retina quadrants), according to Scottish DR grading protocol6. Proliferative DR (PDR) is an advanced stage which is characterized by neovascularization, where circulation of blood in vessels experiences lack of oxygen and leads to the growth of new fragile blood vessels, causing vitreous hemorrhages and tractional retinal detachment.
Proliferative DR (PDR) is an advanced stage of DR which is characterized by neovascularization, where circulation of blood in vessels experiences lack of oxygen and leads to the growth of new fragile blood vessels, causing vitreous hemorrhages and tractional retinal detachment. Most clinical practitioners recommend regular screening of diabetic retinopathy using digital fundus photography of the patients, especially those with mild and moderate retinopathy. The five stage DR severity grading (hereafter, referred as DR-grading task) is a vital activity in DR detection, which requires manual inspection of retinal anatomic features such as optic disc, cup, fovea, macula, and vascular structure and DR lesions by ophthalmologists or well-trained technicians. Therefore, grading of large scale retinal images of ever increasing DR patients has now become a highly exhaustive, time consuming and expensive task that depends entirely on human skill. Computer Aided Diagnostic (CAD) systems facilitate fast and automated classification of fundus images. This enables ophthalmologists with early screening and diagnosis of DR in reduced time and cost. ML Research in the field of DR are categorized into different classification problems such as DR screening (no-DR vs. DR) and referable-DR (normal to mild-NPDR vs. moderate-NPDR to PDR) classification.
Earlier works in the field of DR detection and gradation are predominantly relied on classical image processing based handcrafted feature extractions and conventional machine learning models like SVM and Random Forest for DR classification7, 18. However, most of the significant contributions in recent times on classification and gradation task of DR are based on Deep Learning (DL) methods. Instead of handcrafted features, DL approaches inherently rely on Convolutional Neural Networks (CNN) for feature extractions8, 11, 13–19. This paper investigates the different preprocessing techniques and strategies that are explored in the state-of-the-art deep learning based approaches (between 2015–2020) for automated DR detection tasks, such as DR-screening, referable-DR, and DR-grading. The schematic overview of the proposed framework for preprocessing and Deep Convolutional Neural Networks (DCNN) based DR detection is depicted in Fig. 2.
This study contributes to the need of the missing comparative study on the impact of the different preprocessing strategies in deep learning based DR classification tasks. To the best of our knowledge, none of the study till date provides any comprehensive comparative study of the performance and effectiveness of different preprocessing strategies in DL based DR classification. In this study, we have proposed a new preprocessing pipeline and have evaluated performances different existing preprocessing pipelines formed by combining different contrast, edge enhancement, and noise reduction techniques and different intensity normalization techniques, in all three DR classification tasks using a benchmark deep learning model (ResNet-50)9 on two publicly available large retinal datasets (Kaggle EyePACS20 and APTOS10).
The rest of the paper is organized as follows - Sect. 2, provides a brief overview of the different preprocessing techniques and strategies. Section 3 illustrates the experimental setup and Sect. 4 describes the method of organizing different preprocessing pipelines and the implementation details. Section 5 depicts the comparative performance metrics for different combinations of preprocessing techniques on a baseline DL model. Finally, Sect. 6 concludes this work.
Preprocessing is an integral and crucial part of both conventional image processing for hand-crafted feature extraction, and deep learning based approach. It plays an important role in the overall performance of the DR classification models. Since, the fundus images in different datasets are captured under different conditions and using different camera settings, they suffer from significant differences in quality. These images possess varying resolutions, non-uniform illuminations, noise and color distortions coming from incorrect focus, and angular positioning of the fundus camera. Therefore, preprocessing techniques are extensively used to unify and enhance the image quality, and sharpen the texture details. This work is restrained to different preprocessing methods that have been employed on the deep learning based approaches. The commonly used preprocessing strategies such as cropping, scale normalization, adaptive thresholding, color space conversions, edge and contrast enhancements, noise reduction, and intensity normalization, are discussed below.
In almost all the deep learning based DR grading methods, the common preprocessing steps before fitting the input images into the CNN architecture are i) cropping the images around the inner retinal circle to remove the black borders, which contain no information, ii) extracting a square retinal region of interest (ROI) and iii) scale normalizing them by resizing to appropriate dimensions (e.g. 256x256, 448x448 or 512x512 pixels etc.). Vo et al.8 introduced a novel color space conversion, in which the RGB fundus image are converted into L*a*b* and I1I2I3. A hybrid color space (LGI) is formed by combining the most discriminant channels, from each of the color space i.e. luminance channel L (0-100) from L*a*b*, green channel from RGB and I1 from I1I2I3, which holds most of the chrominance and luminance information and then rescaling the intensity into 0 to 1 range. Doshi et al.11 proposed a preprocessing strategy which composed of contrast enhancement through Contrast Limited Adaptive Histogram Equalization (CLAHE), and min-max intensity normalization on the extracted green channel, and scaled the images to a fixed resolution of 512x512 pixels.
Another popular preprocessing method13 – 19 for enhancing and normalizing the contrast, and emphasizing the high-frequency components (including blood vessel, the edge of the lesion area, etc.) is the method proposed by Graham et al.12. The method is based on linear unsharp masking, where a Gaussian low pass filtered (with σ = ROI radius/30) average image is subtracted from the ROI image, and the resultant is scaled, and then a constant intensity (I = 128) image is added to obtain the enhanced output. This method also suppresses the low-frequency information, reduces noise, removes illumination problems and unwanted DC component, and maps the background to gray color.
In another work, Quellec et al.13 eroded the contrast and edge enhanced ROI images to remove illumination artifacts around the edges. The resulting image is resized and cropped to 448x448 pixels to remove the boundary effects. Wan et al.14 preprocessed the images by non-local means denoising, and then enhanced edge and contrast using Graham’s method and applied z-score intensity normalization of the result. Chen et al.15 and Lam et al.16, both used Otsu’s thresholding to generate binary ROI mask to extract the circular retinal region through background segmentation. Chen et al.15 then enhanced and normalized the contrast and enhanced the edges using the method proposed by Graham et al.12. On the other hand, Lam et al.16 normalized the images by subtracting the minimum intensity and dividing by the mean intensity, before enhancement through CLAHE. Orlando et al.17 normalized the image intensities by subtracting the average image intensities calculated over the entire training set of each Graham’s enhanced ROI images. Zhou et al.18 introduced a distance based illumination equalization technique to minimize the brightness difference between the edge area and center area of the fundus images. Each pixel of the fundus image is weighted based on the distances between their coordinates and the fundus center. The Brightness is balanced by adding the brightness of the original image with the weighted pixel values multiplied by a coefficient found by fitting.
Intensity normalization by z-score normalization14, 16, 19 is obtained by subtracting the channel-wise mean and then dividing by the channel-wise standard deviation to make them zero mean unit variance. It is the most popular preprocessing method used to standardize the image, and to unify the image illumination, contrast and color. Many researchers reported that z-score normalization or through mean subtraction has significantly boosted the learning of the deep learning models and is especially effective for the five stage DR-grading task18. The retinal ROI extraction together with the z-score intensity normalization has been extensively used as a successful preprocessing step for all the three DR classification tasks. The contrast, edge enhancement and noise reduction method based on background image estimation through Gaussian filtering, as proposed by Graham et al.12, has also been proven as a highly effective and successful preprocessing strategy, which have been adopted by many of the researchers.
From all the above reviewed deep learning models, it has been observed that models’ ability to learn both the low and high level features are increased successfully with intuitive and effective preprocessing strategies.
This section describes the components of the experimental setup used in this work for the comparative analysis and performance evaluation of different preprocessing strategies (Fig. 1).
This work considers two publicly available benchmark retinal image datasets with sufficient number images with image-level annotations for DR severity grades.
Kaggle EyePACS dataset20 consists of total 88,702 images with 5 DR stages labeled, with 35,126 images in the train set and 53,576 images in the test set. The distribution of classes in the dataset is depicted in Table 1, it is apparent that the dataset suffers from class imbalance.
APTOS dataset10 is the most recent dataset on Indian cases with five-class DR grading annotations. It consists of 3662 training images and 1928 test images with varying resolutions from maximum resolution of 3216x2136 to minimum resolution of 640x480. The details of the dataset is depicted in Table 1, it also suffers from class imbalance.
Class |
DR Stage |
Kaggle EyePACS dataset20 |
APTOS dataset10 |
||
---|---|---|---|---|---|
#images |
Percent. |
#images |
Percent. |
||
0 |
No DR |
25810 |
73.48% |
1805 |
49.29% |
1 |
Mild DR |
2443 |
6.96% |
999 |
27.28% |
2 |
Moderate DR |
5292 |
15.07% |
370 |
10.10% |
3 |
Severe DR |
873 |
2.48% |
295 |
8.05% |
4 |
Proliferative DR |
708 |
2.01% |
193 |
5.27% |
Most the contributions in the field of DR-grading have been trained and evaluated on Kaggle EyePACS dataset. Therefore, we use the Kaggle EyePACS dataset to train our model and APTOS dataset to test the performance. This helps to validate the cross-dataset robustness of the preprocessing strategies.
The reviewed works indicate that, DCNN is the most popular choice among the researchers for DR detection tasks, as they are specially designed to efficiently learn and extract meaningful features from the images. Filters or kernels in the convolution layers employ convolution operations to encode local spatial information to detect significant patterns and objects within the image. The lower level convolutional layers learn to detect edges and structures by aligning the filters as edge and blob detectors. On the other hand, deeper convolutional layers learn to detect more and more abstract structures and objects, which are scale, rotation and translation invariance, by aligning themselves as high-end feature extractors or image descriptors. It is observed from the reviewed literatures, that VGG-Net, ResNet9 and their variants have been extensively adopted by the researchers and observed reasonably good performances in all three types of DR classification tasks. Other important models which are successfully used are GoogLeNet (Inception V1), Incetion-V3, Inception-ResNet (Inception V4), and Alex-Net. It is found that ResNet and its variants have outperformed other state-of-art CNNs, in both DR screening and DR-gradation tasks. The ResNet model apparently has the better ability to learn the most expressive and discriminative features from the retinal images, which probably contributed in better classification results. This is the rationale behind selecting ResNet as the baseline classification model for the experimental setup. The building blocks for learning of the residual function F in ResNet 34 and ResNet 50/101/152 are depicted in Fig. 3(a) and 3(b), respectively. Taking into account the promising performance of the shallower models like VGG- Net variants and AlexNet in DR-grading and in DR-screening, we select a moderately deep ResNet-50 CNN as the baseline DCNN architecture for the classification tasks.
In a binary classification settings, the evaluation metrics are based on four basic measurements, namely true positive (TP), true negative (TN), false positive (FP) and false negative (FN). For measuring the performance of classification tasks like DR-grading, sensitivity (SN) or recall (RE), specificity (SP), accuracy (ACC), precision (PR), Area under the Receiver Operating Characteristic curve (AUC-ROC) and quadratic weighted kappa (κ) score are commonly used. Quadratic weighted kappa (κ) score is an effective weighted measure, especially in assessing classification accuracy in multiclass classification like DR-grading where datasets suffer from class imbalance problems. Eqs. (1), (2) and (3) depicts the three metrics – Accuracy, Quadratic weighted kappa (κ) score and AUC-ROC used in this work to compare performances of different preprocessing approaches.
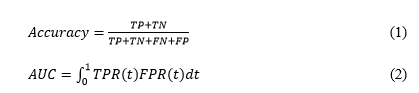
Where, t = probability threshold, and TPR(t) is True Positive rate and FPR(t) is the False Positive rate.
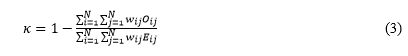
Where, N = number of classes, Oij = elements of a N ⋅ N histogram matrix of observed ratings (O) and corresponds to the number of adoption records that have a rating of i (actual) and received a predicted rating j, wij = elements of a N ⋅ N weights matrix (w) calculated based on the difference between actual and predicted rating scores, Eij = elements of a N ⋅ N histogram expected ratings (E).
In this study we compare and evaluate the efficacy of different preprocessing techniques in CNN based feature extraction and classification of DR stages, with help of a baseline DCNN architecture. In section 2, we have investigated and identified different state-of-art preprocessing strategies, which have been commonly used by the researchers in DL approaches for the DR gradation and classification tasks. In this work, we have proposed a new k-means clustering based retinal region extraction method and have introduced two new preprocessing pipelines (combinations of preprocessing techniques) for contrast enhancement and intensity normalization.
Preprocessing strategies for enhancing and standardizing the retinal images precede the feature extraction and DR classification steps in CNN [Figure 1].
The retinal region of interest is extracted using a binary mask automatically generated for each input retinal image using a hybrid approach which relies of unsupervised learning and as well as on empirical estimation. The steps in the automated retinal ROI region extraction are summarized as follows:
To identify the most effective preprocessing strategy for DR classification, we select some commonly used preprocessing strategies, which have shown promising results in the reviewed DR works and also introduced two new preprocessing strategies for contrast enhancement and intensity normalization. In the preprocessing pipeline, we consider seven Contrast and Edge Enhancement Strategies (CEE) –
Five existing preprocessing methods –
Two new preprocessing methods –
In addition, no-enhancement after ROI extraction (NONE) is also considered as an option.
We used three normalization strategies (NORM) –
The different preprocessing pipelines consisting of distinct combination of the enhancement and normalization pairs {CEE, NORM}, are listed in Table 2.
The pipeline goes as follows – raw retinal images to ROI extraction and resizing, then the output goes to the enhancement step (CEE) and then enhanced image goes to the normalization (NORM) step. Each of the distinct preprocessing pipe-line is applied on the train, validation and test dataset, before feeding the result to the ResNet-50. The output of ROI extraction and different Contrast and Edge Enhancement Strategies are illustrated in figure 4.
Table 2. The {CEE, NORM} Pairs of the different Preprocessing Pipelines
SL. No. |
{CEE, NORM} |
SL. No. |
{CEE, NORM} |
1 |
{NONE, ZScr} |
13 |
{MDNCLAHE, MnMx} |
2 |
{LGI, ZScr} |
14 |
{MDNCLAHE_IE, MnMx} |
3 |
{GRAHAM, ZScr} |
15 |
{DBIE_GRAHAM, MnMx} |
4 |
{NLMD, ZScr} |
16 |
{MDNCLAHE_GRAHAM, MnMx} |
5 |
{MDNCLAHE, ZScr} |
17 |
{NONE, Rscl} |
6 |
{MDNCLAHE_IE, ZScr} |
18 |
{LGI, Rscl} |
7 |
{DBIE_GRAHAM, ZScr} |
19 |
{GRAHAM, Rscl} |
8 |
{MDNCLAHE_GRAHAM, ZScr} |
20 |
{NLMD, Rscl} |
9 |
{NONE, MnMx} |
21 |
{MDNCLAHE, Rscl} |
10 |
{LGI, MnMx} |
22 |
{MDNCLAHE_IE, Rscl} |
11 |
{GRAHAM, MnMx} |
23 |
{DBIE_GRAHAM, Rscl} |
12 |
{NLMD, MnMx} |
24 |
{MDNCLAHE_GRAHAM, Rscl} |
The baseline ResNet-50 (pretrained on ImageNet21) is first trained on the pre-processed retinal images from the Kaggle EyePACs dataset with 70%-30% split between train and validation data. For each of the 24 preprocessing pipelines, the model is separately trained for 100 epochs. Then, each of the Kaggle EyePACs pretrained ResNet-50 model of the 24 preprocessing pipelines are further fine-tuned on preprocessed retinal images from APTOS training dataset with 70%-10%-20% split between train, validation and test data, for another 100 epochs for each preprocessing pipeline.
The top layers9 after the global average pooling layers of the pretrained model are dropped off and replaced by a dense layer with 1024 neurons followed by a batch-normalization layer, ReLU activation layer, and a dropout layer (dropout rate of 0.2). The final layer’s weights are initialized according to He et al.22. Finally a 5-class softmax classifier is added for complete DR grading.
For binary classification of DR-screening and referable-DR, the predicted labels and probabilities from the softmax classifier are grouped accordingly to produce the predicted classes and their probabilities. The schematic overview of the preprocessing pipelines and DCNN framework for the classification task is illustrated in figure 2. All the models are trained and tested on a single NVIDIA GeForce GTX 1650 GPU using Keras 2.3.1 on Tensorflow 1.14.0 backend. For each classification task and for each preprocessing pipeline, the DCNN is fine-tuned in end-to-end manner with SGD momentum optimizer with an initial learning rate of 0.001 and a fixed batch size of 8.
The learning rate is scheduled with a decrease rate of 0.1, when validation accuracy fails to drop for 10 consecutive epochs. L2 weight decay regularizer with factor of 0.001 is applied to all the layers.
We also increase the effective number of training images in order to increase generalization and reduce over-fitting. Random data augmentations such as random rotations of 0-90 degrees, random horizontal and vertical flips, and random horizontal and vertical shifts are employed to enforce rotation and translation invariances in the deep feature. It also helps to increases heterogeneity in the samples while preserving prognostic characteristics. Random oversampling of minority classes and augmentation together is used to address the class imbalance problem.
The performance of the different preprocessing pipelines explored in this study indicates their competence in successful feature extraction. The different existing and new preprocessing pipelines are evaluated on the APTOS dataset for classification tasks and their performances are reported in Table 3. The ROC curves of the best performing preprocessing method (composed of clustering based ROI extraction, edge - contrast enhancement by method Graham et al.12 (GRAHAM) and z-score normalization (ZScr) are depicted in Fig. 5.
The result shows that, all the preprocessing pipelines performed well in classification tasks but the proposed preprocessing combination composed of clustering based ROI extraction, edge - contrast enhancement by method Graham et al.12 (GRAHAM) and z-score normalization (ZScr), has outperformed all other methods in majority of the classification tasks, by achieving highest accuracy of 98.5%, 96.51% and 90.59% in DR-screening, referable-DR, and DR severity gradation tasks, respectively. It also achieved the best quadratic weighted kappa score (κ) of 0.945 in DR severity grading task. It achieved the highest AUC-ROC score of 0.98 and 0.9981, in DR severity grading and DR-Screening tasks respectively. The preprocessing pipeline {ROI, LGI, ZScr} achieved the best AUC-ROC score of 0.9908 referable-DR classification task. Therefore, clustering based ROI extraction, followed by edge and contrast enhancement using Graham’s method (GRAHAM), and intensity normalization through z-score (ZScr) technique has proved to be the most effective preprocessing strategy for all three types of DR classification tasks in retinal images.
SL. No. | {CEE, NORM} | DR Screening | Referable-DR | DR-Stage | ||||
---|---|---|---|---|---|---|---|---|
ACC | AUC | ACC | AUC | ACC | AUC | κ | ||
1 | {NONE, Rscl) | 0.9741 | 0.9942 | 0.9523 | 0.9858 | 0.8772 | 0.9698 | 0.921 |
2 | {NONE, MnMx} | 0.9795 | 0.9938 | 0.9604 | 0.9867 | 0.8909 | 0.9705 | 0.911 |
3 | {NONE, ZScr } | 0.9659 | 0.9778 | 0.94 | 0.9801 | 0.8486 | 0.9615 | 0.916 |
4 | {LGI, Rscl} | 0.9536 | 0.9838 | 0.9632 | 0.987 | 0.8527 | 0.9646 | 0.889 |
5 | {LGI, MnMx} | 0.9659 | 0.9922 | 0.9604 | 0.9873 | 0.8813 | 0.9714 | 0.911 |
6 | {LGI, ZScr} | 0.9768 | 0.9949 | 0.9618 | 0.9908 | 0.9045 | 0.9795 | 0.932 |
7 | {NLMD, Rscl} | 0.9686 | 0.9834 | 0.9441 | 0.9854 | 0.8759 | 0.9697 | 0.937 |
8 | {NLMD, MnMx} | 0.9536 | 0.9741 | 0.9277 | 0.977 | 0.8199 | 0.9504 | 0.904 |
9 | {NLMD, ZScr} | 0.9741 | 0.986 | 0.9523 | 0.9731 | 0.8677 | 0.9631 | 0.91 |
10 | {MDNCLAHE, Rscl} | 0.9741 | 0.9856 | 0.9454 | 0.9804 | 0.8759 | 0.9676 | 0.932 |
11 | {MDNCLAHE, MnMx} | 0.9741 | 0.9865 | 0.9454 | 0.9807 | 0.8649 | 0.9655 | 0.922 |
12 | {MDNCLAHE, ZScr} | 0.9768 | 0.9917 | 0.9645 | 0.9843 | 0.9031 | 0.9734 | 0.942 |
13 | {MDNCLAHE_IE, Rscl} | 0.9768 | 0.9884 | 0.9345 | 0.976 | 0.884 | 0.9671 | 0.932 |
14 | {MDNCLAHE_IE, MnMx} | 0.9741 | 0.9847 | 0.9386 | 0.9775 | 0.8745 | 0.9648 | 0.923 |
15 | {MDNCLAHE_IE, ZScr} | 0.9686 | 0.9869 | 0.925 | 0.9805 | 0.8636 | 0.9686 | 0.917 |
16 | {GRAHAM, Rscl} | 0.9768 | 0.9904 | 0.9209 | 0.9813 | 0.8336 | 0.968 | 0.884 |
17 | {GRAHAM, MnMx} | 0.9836 | 0.9923 | 0.9454 | 0.9821 | 0.8799 | 0.9703 | 0.923 |
18 | {GRAHAM, ZScr} | 0.985 | 0.9981 | 0.9651 | 0.9882 | 0.9059 | 0.98 | 0.945 |
19 | {DBIE_GRAHAM, Rscl} | 0.9727 | 0.9965 | 0.9495 | 0.9839 | 0.8636 | 0.9682 | 0.905 |
20 | {DBIE_GRAHAM, MnMx} | 0.9754 | 0.9922 | 0.955 | 0.9784 | 0.869 | 0.9671 | 0.915 |
21 | {DBIE_GRAHAM, ZScr} | 0.9714 | 0.9961 | 0.9509 | 0.9817 | 0.8622 | 0.9726 | 0.892 |
22 | {MDNCLAHE_GRAHAM, Rscl} | 0.9495 | 0.9786 | 0.9345 | 0.9775 | 0.8131 | 0.9557 | 0.894 |
23 | {MDNCLAHE_GRAHAM, MnMx} | 0.97 | 0.9916 | 0.9563 | 0.9848 | 0.8868 | 0.9745 | 0.925 |
24 | {MDNCLAHE_GRAHAM, ZScr} | 0.9604 | 0.9848 | 0.9372 | 0.9758 | 0.8213 | 0.9617 | 0.897 |
DCNN model with correct preprocessing approaches is the key to rapid and accurate detection and classification of DR stages. This study contributes to the need of the missing comparative study on the impact of the different preprocessing strategies in deep learning based DR stage classification. In this study, we have also proposed a new k-means clustering based retinal region extraction method and have introduced two new preprocessing pipelines (combinations of preprocessing techniques) for contrast enhancement and intensity normalization designed on top of it. We have evaluated performances of the different existing preprocessing pipelines along with the proposed clustering based ROI extraction and new combinations of preprocessing strategies, for DR stage classification tasks from fundus images, using the resnet-50 DCNN as the baseline deep learning model. The different preprocessing pipelines are formed by combining different contrast, edge enhancement, and noise reduction techniques with different intensity normalization techniques. It is observed that for DR stage classification, the preprocessing pipeline composed of clustering based ROI extraction, followed by edge and contrast enhancement using Graham’s method12 (GRAHAM), and then z-score intensity normalization (ZScr) have outperformed all the other preprocessing strategies by achieving highest accuracy in all three classification tasks. It also achieved the best AUC-ROC in majority of the classification tasks and highest quadratic weighted kappa score in DR severity grading task. It is evident from the results that these preprocessing strategies play a significant role in the extraction of meaningful deep features, so that the baseline CNN model has managed to achieve at par performance as that of the other rich deep learning models, in all the three classification tasks. However, performances of the preprocessing pipelines could further increase if the DCNN is trained in an end-to-end manner with more number of epochs and larger batch sizes, which would be investigated in our future work. We would also per-form a comparative study of the performances of different benchmark DCNNs in DR detection, considering the finding of this work (ROI Extraction + GRAHAM + ZScr) as the baseline preprocessing method.
Ethics approval and consent to participate: Not applicable.
Consent for publication: Not applicable.
Availability of data and material: The datasets used and/or analyzed during the current study are available from the corresponding author on reasonable request.
Competing interests: The author(s) declare no competing interests.
Funding: Not applicable.
Authors' contributions: Nilarun Mukherjee and Souvik Sengupta wrote the main manuscript text and prepared figures. All authors reviewed and approved the final manuscript.
Acknowledgements: Not applicable.