Retrieval of data and target lncRNAs extraction
The RNA-seq expression (including mRNA & lncRNA) file in fragments per kilobase of exon model per million mapped fragments (FPKM) form and clinical data of 537 ccRCC patients were downloaded from TCGA (https://tcga-data.nci.nih.gov/tcga/). Two types of RNA were split according to the annotation file from Ensembl (http://asia.ensembl.org). A total of 2483 immune-related genes were retrieved from the ImmPort database (http://www.immport.org) which provides shared data for immunological analysis. The irlncRNAs were identified via co-expression with immune-related genes (ir-genes) of which the Pearson correlation coefficients more than 0.8 and p-value less than 0.001 were set as the thresholds. DEirlncRNAs were identified with a false discovery rate (FDR) less than 0.05 and the absolute value of log Fold Change (|logFC|) more than 1.5 through limma package of R. Strawberry Perl was used to create structured data downloaded from websites. R (version of 3.6.3), a free programming language for statistics, was used to conduct the model construction, data analyses and plots.
Construction of DEirlncRNA pairs
A 0-1 matrix was applied to build DEirlncRNA pairs cyclically as follow:
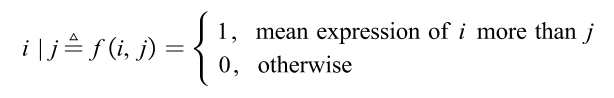
which means the expression level of the ith DEirlncRNA was more than the jth one (i<j). The form “i | j” was considers as the DEirlncRNA pair. The detailed form could be formulated as:
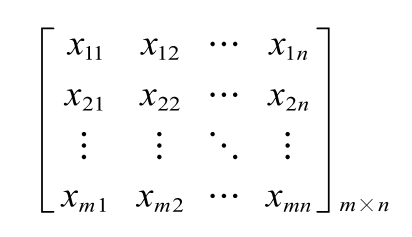
where xij=0 or 1; m represented the sample size and n represented the number of DEirlncRNA pairs.
The following numerator represented the amounts of expression quantity was 0 or 1 of each DEirlncRNA pair among all samples:
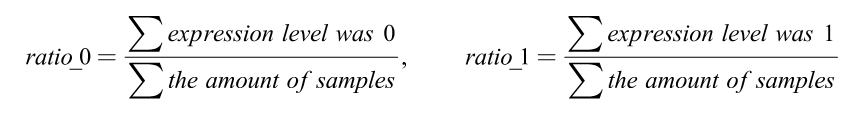
When the ratio of DEirlncRNA pair was more than 20% of total pairs, it was defined as a valid match.
Selection of target pairs and establishment of prognostic model
After excluding the samples with overall survival (OS) less than 30 days, the constructed DEirlncRNA-pair matrix was combined with the survival information of ccRCC patients. A univariate proportional hazard regression was performed to detect the prognostic signature pairs. The threshold was set as p-value less than 0.01. Then a 10-fold Lasso regression was run with 5000 cycles to construct the final prognostic model.
The risk score of each patient could be calculated as
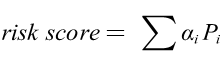
where αi was the value abstracted from the 0-1 matrix, and the Pi was the coefficients of Lasso regression. Receiver operating characteristic (ROC) curve was carried out and the area under curve (AUC) was calculated. The maximum AUC value was defined as the optimal cutoff of the risk score and patients were divided into high and low risk groups. Kaplan-Meier (KM) was analyzed to predict the OS of ccRCC patients in the high- or low-risk group through survival ROC package.
Validation of the Constructed Risk Model
To analyze the significant difference of survival situation of high- or low- risk groups, the log-rank test was performed through survival package. Samples with Mx and Gx which represented unclear clinicopathologic results were excluded from univariate and multivariate cox analysis. N staging was also omitted because of the data deficiency. The independent prognostic analysis was performed with the calculated risk score and five clinical factors: age, gender, tumor stage, T and M stage. Then AUCs were compared to validate the superiority of constructed model and the distribution of patients in different groups was visualized by showing the risk curve and scatter plot. The correlation of clinicopathologic features and interested gene expression was analyzed between the high- and low- risk groups by Wilcox two-side test.
To validate the prognostic value of this model, the hub genes of ccRCC identified in a previous study (CD2, CD3D, CD8A, CXCL13, CXCR3, FASLG, GZMA, IFNG, PMCH) were carried out using our risk score model [42].
Exploration of tumor infiltrating immune cells
Immune infiltration information of ccRCC patients based on TCGA identities which provides expression profiles of immune cells was downloaded from TIMER 2.0 (http://timer.comp-genomics.org)[43-46]. Spearman correlation coefficients were calculated to investigate the association between the risk level and immune cells containing XCell, TIMER, quanTIseq, MCP-counter, EPIC, CIBERSORT and CIBERSORT-ABS algorithms. The difference of each immune cell between high- and low- risk groups was estimated by Wilcoxon rank-sum test, of which the p-value was set as 0.001 as the threshold.
Analysis of the model in chemosensitivity
The RNA-seq expression of ccRCC tumor samples from TCGA cohort was used to analyze the chemosensitivity through pRRophetic package[47]. Recommendations for RCC treatment like lapatinib, pazopanib, sunitinib and vinblastine were included in the comparison analysis. Wilcoxon test was performed to evaluate the difference between the high- and low- risk groups according to the value of 50% maximal inhibitory concentration (IC50).