3.1 Participants
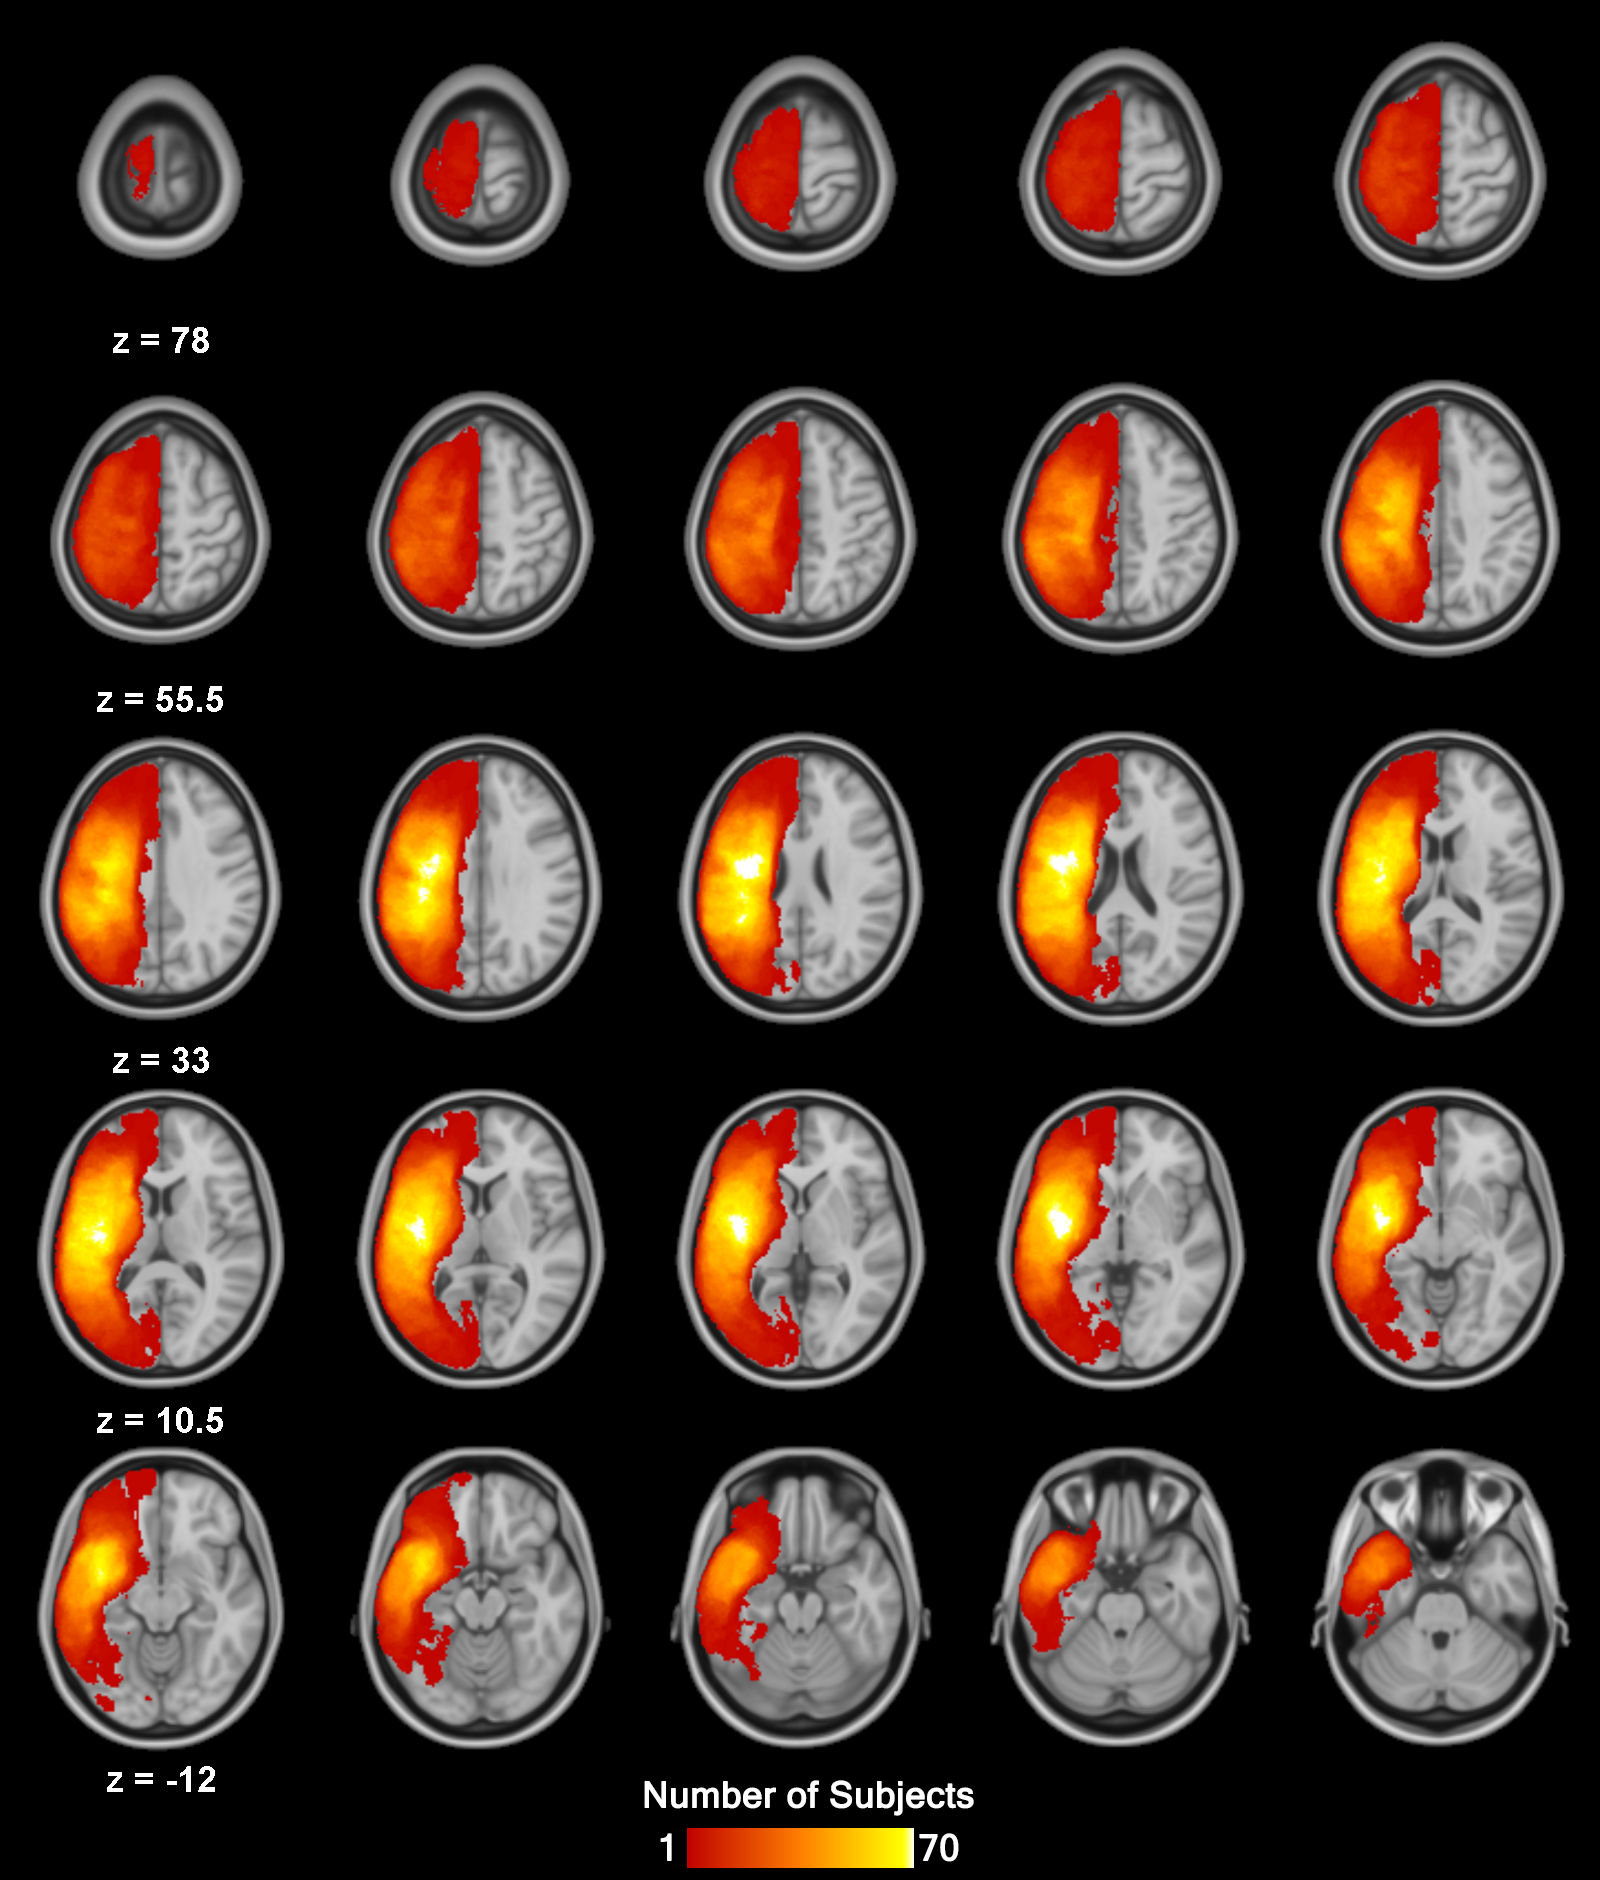
Demographics and aphasia severity for the 70 recruited participants are shown in Table 2. Of the participants who entered the study, one dropped immediately and one passed away before completing testing. Both of these participants were completely excluded from analyses. Of the remaining 68 participants, one dropped out and one suffered a hematoma during therapy. For these participants the baseline language measures were used, and the post-treatment dependent measures were imputed. All baseline TSM data were collected, and 2.8% of the other baseline language measurements were missing due to incomplete testing and/or lack of follow-up. Missing data were imputed by random forests (randomForest Package, R programming language) (61). Imputation parameters were selected to minimize output variance. For subsequent analyses, model metrics are estimated across multiple imputations. In addition, two agrammatism participants were scanned with a different sequence, and these subjects were removed from fALFF-based analyses.
Table 2
Subject Demographics and WABAQ by Language-Specific Deficit.
| Attribute | Anomia (N = 30) | Agrammatism (N = 16) | Dysgraphia (N = 24) | p |
| Gender | F: 10 M: 20 | F: 5 M: 11 | F: 9 M: 15 | 0.8995 |
| Age | 62.5 +/- 11.1 | 51 +/- 5.2 | 61.5 +/- 10.4 | 0.0005 |
| Handedness | L: 2 R: 28 | L: 3 R: 13 | L: 5 R: 19 | 0.2992 |
| Education (Years) | 16 +/- 1.5 | 16.5 +/- 2.2 | 16 +/- 3.0 | 0.0418 |
| Months Post Stroke | 27.5 +/- 22.2 | 31 +/- 19.3 | 63.5 +/- 48.2 | 0.0186 |
| Aphasia Severity (WABAQ) | 62.2 +/- 32.5 | 74.85 +/- 14.1 | 83 +/- 15.4 | 0.0055 |
For categorical variables, counts by attribute and deficit type are shown. Categorical variable p-values are calculated with a two-sided Fisher’s Exact Test. For continuous variables, median +/- median absolute deviation is shown. Continuous variable p-values are calculated with a Kruskal-Wallis one-way analysis of variance. Significant p-values are bolded (p < 0.05).
Significant differences were found to exist across the deficit groups in age, years of education, months post-stroke, and overall aphasia severity. Relationships between subject demographics and language measures or fALFF may be present across the aphasia subtypes. However, each aphasia subtype treatment is modelled separately, limiting the confounding effect of group differences. Furthermore, demographic variables were not included in the model, since they have not been found to be robust predictors of aphasia recovery (9).
3.2 Language/Cognitive Assessments
Correlations between the measures included in the language/cognitive battery are displayed in Fig. 1A. Hierarchical clustering was performed, using one minus the Kendall’s Tau-b correlation as a distance metric between tests (Fig. 1B). Almost all measures correlated positively with all other measures, except for the PALPA 1 and Doors & People measures. These measures clustered independently in the dendrogram. Correlations are especially high within a language measure group (i.e. NAVS), and submeasures cluster together. The observed multicollinearity across measures is expected, since nearly all measures test an aspect of language ability.
Figure 1: Multicollinearity across Baseline Language Measures. 1A: A shaded color-plot of the correlation matrix is shown. Due to imbalance in sample sizes, correlations were first calculated within each language deficit, and then averaged to yield the matrix shown here. Box colors correspond to pairwise Kendall’s Tau-b values (red is positive, blue is negative correlation). Only pairwise complete observations were used (no imputation). Measures are generally correlated with one another (mean pairwise correlation = 0.328). 1B: An association dendrogram of language measures is shown. Correlation distance is one minus the absolute pairwise Kendall’s Tau correlation. The dendrogram formed by hierarchical clustering of the correlation distances is shown (Unweighted Pair Group Method with Arithmetic Mean).
3.3 GICA Results
Averaged components from across subjects created through the GIFT toolbox are displayed in Fig. 2. The observed maps are a mix of known networks, regions consisting of grey matter, regions known to be sensitive to physiologic motion, and the ventricles. This reflects our minimal image preprocessing and inclusion of all voxels within the brain. Some grey matter activation may be due to partial volume effects from cerebrospinal fluid motion. The identical regression analyses were repeated with more heavily preprocessed data that accounts for motion and physiologic noise, however the prediction results could not be replicated. This implies that non-grey matter voxels may be driving the predictive power of the subsequent models, and is further interpreted in the discussion.
Figure 2: Aggregate GICA Components. Backprojected spatial components were averaged across subjects to create aggregate component maps (shown). Sagittal, axial, transverse planes are displayed about each component’s peak point. Color corresponds to the z-score of the voxel coefficient (1-sided t test). Colors are scaled to each component’s range (3 ≤ |z| ≤ |zpeak|). Red voxels are component correlated while blue voxels are component anticorrelated.
3.4 Treatment Response Modeling
Patient performance on the TSM increased significantly over the course of treatment for all therapy groups: Anomia (p = 9.32E-9), Agrammatism (p = 3.05E-5), Dysgraphia (p = 1.19E-7) (one-sided Exact Wilcoxon Signed Rank Test, 1000 imputations). First, we predicted post-Tx TSM using only the pre-Tx TSM as a performance reference point for other models (Fig. 3). The error, correlation, and p-value are calculated for each model (one-sided t-test for Pearson correlation). Post-Tx TSM after anomia treatment had a strong linear relationship to pre-Tx score (R = 0.902, N = 30, p = 5.0e-12, 95% CI: (0.833, 0.944), MAD = 0.113). In the agrammatism group, pre-Tx TSM was a borderline-significant predictor of post-Tx TSM (R = 0.385, N = 16, p = 0.070, 95% CI: (-0.075, 0.724), MAD = 0.165). The dysgraphia therapy had no linear relationship between pre-Tx and post-Tx TSM scores (R = 0.142, N = 22, p = 0.264, 95% CI: (-0.390, 0.571), MAD = 0.061). This is expected since the dysgraphia treatment trains individuals to a performance threshold. Therefore the post-Tx score was largely independent of the pre-Tx score, and this pattern was reflected in our model performance.
Figure 3: Predicting Post-Tx Language Outcome with Baseline TSM. Linear models which predict deficit-specific measure after therapy were constructed for each aphasia type. Black circles show the predicted score for each patient during LOOCV. Where multiple values exist due to imputation, the median value and prediction are shown. The dashed line represents a perfect prediction. The LOWESS curve (locally-weighted polynomial regression, solid black line) shows smoothed median predictions across 100 imputations. For each model, the median correlation across imputations is shown (convergence data available in supplement).
3.4.1 Modeling with Language Measures
Next, we predicted post-Tx score on the deficit-specific measure using all baseline scores on the cognitive/language assessment battery (28 predictors total, Fig. 4). The effect of anomia treatment on the TSM again demonstrated a strong linear relationship (R = 0.958, N = 30, p = 5.0e-17, 95% CI: (0.922, 0.979), MAD = 0.075). This relationship was significantly stronger than when only the pre-Tx TSM is used (p < 0.05). The agrammatism model demonstrated a statistically significant linear relationship (R = 0.589, N = 16, p = 0.0082, 95% CI: (0.245, 0.836), MAD = 0.132), but was not significantly better than the TSM alone (p > 0.05). The dysgraphia model also showed a statistically significant relationship (R = 0.456, N = 22, p = 0.016, 95% CI: (0.125, 0.741), MAD: 0.105). However it misses the general trend of the data and produces predictions with very high error. The magnitude of this error is not entirely captured by the MAD.
Figure 4: Predicting Post-Tx Language Outcome with Baseline Language Measures. Linear models which predict the TSM after therapy were constructed for each aphasia type. Black circles show the predicted score for each patient during LOOCV. Where multiple values exist due to imputation, the median value and prediction are shown. The dashed line represents a perfect prediction. The LOWESS curve (locally-weighted polynomial regression, solid black line) shows smoothed median predictions across 100 imputations. For each model, the median correlation across imputations is shown (convergence data available in supplement).
3.4.2 Relative Importance of Language Predictors
Next we identified which cognitive/language predictors contributed most to the predictive models performance (Table 3). Individual behavioral measure importances were typically small - only 12% of the variables individually explained more than 5% of the outcome variance across all the aphasia types. This is expected due to high multicollinearity and therefore redundant information across measures. For the anomia model, the baseline deficit-specific measure was the most important variable by far, explaining nearly 80% of outcome variability. SCT-N and PALPA40-HF followed in importance, which although small, likely drive the significant difference between the baseline deficit measure and the full behavioral model. The agrammatism model was primarily driven by SPPT-C, an agrammatism measure, and then the baseline TSM. Top variables in the dysgraphia model were PALPA35-EX and PALPA1. However the dysgraphia model had very high error, limiting interpretability for important variables. Interestingly, D&P has high importance in both the agrammatism and dysgraphia models. A follow-up analysis demonstrated positive regression coefficients for all important tests in their respective models, with exception of SCT-N in the anomia model.
Table 3
Relative Importance of Behavioral Measures.
| Language Measure | Anomia (N = 30) | Agrammatism (N = 16) | Dysgraphia (N = 22) |
| WAB-IC | -0.25 | -0.72 | -0.45 |
| WAB-FL | 1.24 | -2.25 | -0.33 |
| WAB-CO | -0.35 | 1.64 | -0.99 |
| WAB-RE | -0.37 | 0.80 | -1.05 |
| WAB-NA | -0.21 | -2.40 | -0.67 |
| NNB-NC | -0.23 | 0.16 | -0.26 |
| NNB-VC | -0.16 | -1.13 | -2.30 |
| NNB-NP | -0.27 | -0.46 | -0.78 |
| NNB-VP | -0.25 | -4.11 | -1.81 |
| SCT-C | 0.28 | -2.16 | -0.43 |
| SCT-N | 6.34 | -1.59 | -0.67 |
| SPPT-C | -0.30 | 40.67 | 0.36 |
| SPPT-N | 0.77 | -2.16 | 1.07 |
| PALPA1 | 0.81 | -2.32 | 12.40 |
| PPT | 0.01 | -0.15 | -0.65 |
| PALPA35-RE | -0.18 | -0.28 | -2.15 |
| PALPA35-EX | 1.84 | 2.47 | 16.51 |
| PALPA40-HF | 3.42 | -0.85 | -1.70 |
| PALPA40-LF | -0.24 | -3.38 | -1.91 |
| PALPA51-HI | -0.69 | -3.32 | 1.22 |
| PALPA51-LI | 0.22 | -11.37 | -1.78 |
| CIND-WPM | -0.23 | -1.09 | -0.27 |
| CIND-MLW | 0.26 | 9.79 | -2.17 |
| CIND-MLM | -0.16 | -2.34 | -0.75 |
| D&P | -0.17 | 11.24 | 9.51 |
| DS-FOR | -0.18 | -1.27 | -0.73 |
| DS-BAC | 0.82 | -1.49 | -0.46 |
| TSM | 79.89 | 12.92 | 2.01 |
Variable importance within the predictive model was calculated by backwards feature elimination. As the TSM is collected at baseline by default, it was always retained by the model. Importance is the percentage of variability in the post-Tx TSM explained by each baseline language measure. Variables with higher importance contribute more to model performance, while low and negative values suggest a better alternative to that measure is available.
3.4.3 Modeling with fALFF Predictors
We next built prognostic models using only fALFF values of independent components (Fig. 5). There was a significant drop in performance for the anomia model (R = 0.366, N = 28, p = 0.028, 95% CI: (0.107, 0.650), MAD = 0.299). The model missed the overall trend of the data, but had a marginally significant statistical relationship. However, the fALFF agrammatism model was significantly better than the behavioral model (R = 0.940, N = 11, p = 8.5e-6, 95% CI: (0.730, 0.995), MAD = 0.030). Similar performance gains were seen in the dysgraphia model (R = 0.925, N = 18, p = 2.0e-8, 95% CI: (0.819, 0.973), MAD = 0.016).
Figure 5: Predicting Post-Tx Language Outcome with Baseline fALFF. Linear models which predict deficit-specific measure after therapy were constructed for each aphasia type. Black circles show the predicted score for each patient during LOOCV. Where multiple values exist due to imputation, the median value and prediction are shown. The dashed line represents a perfect prediction. The LOWESS curve (locally-weighted polynomial regression, solid black line) shows smoothed median predictions across 100 imputations. For each model, the median correlation across imputations is shown (convergence data available in supplement).
3.4.4 Relative Importance of fALFF Predictors
Identifying the most important components in fALFF-based models highlights the components which drive performance. For direct comparison to the behavioral variable importance, we calculated importance of component fALFF with backwards feature elimination (Table 4). The anomia model was primarily driven by components 2 and 16. Component 2 was unexpected since it has a large ventricular presence, although there is some insular activation as well. This model has very high error so the significance of the variable importances is hard to interpret. Component 1 accounts for almost 72% of the agrammatism variability, and along with component 5 form the bulk of the model’s predictive power. The dysgraphia model importances are more distributed, with components 9 and 18 scoring highest.
Table 4
Relative Variable Importance by Backwards Elimination. Variable importance within the predictive model was calculated by backwards feature elimination. Importance is the percentage of variability in the post-Tx TSM explained by each component. Components with higher importance contribute more to model performance. Negative values suggest a better alternative to that component is available.
| GICA Component | Anomia (N = 28) | Agrammatism (N = 11) | Dysgraphia (N = 18) |
| 1 | -1.90 | 71.65 | 0.88 |
| 2 | 16.30 | -0.41 | 0.00 |
| 3 | -3.61 | -0.29 | -2.44 |
| 4 | 0.41 | 4.82 | 5.94 |
| 5 | 0.02 | 11.84 | 2.14 |
| 6 | -2.03 | 0.06 | -1.01 |
| 7 | 0.20 | 0.11 | -0.80 |
| 8 | 3.57 | 0.73 | 8.07 |
| 9 | -5.95 | 0.15 | 15.38 |
| 10 | -0.44 | -0.83 | 5.58 |
| 11 | 3.22 | 3.67 | 1.61 |
| 12 | -3.85 | 1.62 | -12.53 |
| 13 | -1.10 | 3.34 | 6.79 |
| 14 | -0.17 | 0.85 | -0.68 |
| 15 | -1.20 | -0.25 | 8.66 |
| 16 | 11.48 | -0.04 | 4.30 |
| 17 | 1.15 | -2.19 | 10.76 |
| 18 | 0.45 | 1.31 | 22.56 |
| 19 | 0.83 | -0.84 | 5.05 |
| 20 | -3.18 | -6.87 | 5.09 |