A Multilevel Analysis Factors Associated With Diarrhea Among Under-five Children in Ethiopia Using 2016 EDHS Data: Individual and Community Level Factors.

DOI: https://doi.org/10.21203/rs.3.rs-853182/v1

Abstract

Background: Despite numerous attempts, diarrhea remains one of the leading causes of death among children under the age of five around the world. Globally, diarrhea is the second prominent cause of death in children next to pneumonia. Every year, there are 1.7 billion children who develop diarrhea and at least 525,000 die from diarrhea. In low- and middle-income countries such as Ethiopia, diarrhea still remains one of the health problems due to its high morbidity and mortality. This study was conducted identify factors associated with diarrhea at community (cluster) level and individual level.

Objectives: To assess individual and community level factors of childhood (0–59months) diarrhea in Ethiopia by using the 2016 Ethiopian Demography and Health surveys (EDHS) data, 2020.

Methods: A cross-sectional secondary analysis of data pooled from 2016 Ethiopian Demographic and Health Surveys (EDHS) data was used. The analysis was done using Stata version 14.2.  A multilevel logistic regression model was used to identify independent predictors of childhood diarrhea. Odds ratio with 95% CI was used in identifying the association between dependent and independent predictors

Result:  The prevalence of diarrhea in Ethiopia based on EDHS 2016 was 11.78%.The odds of diarrhea among children reside in rural area were 1.84 times more likely to develop diarrhea (AOR=1.82; 95% CI: 1.52-2.16) as compared to urban dwellers. Those children aged between 13 and 24 months were 2.2 times more likely to have diarrhea than (AOR=2.2, 2.15-2.98) their older counter parts (48-59 months). The measure of variation was also assessed by using ICC, MOR, and DIC with the result of 10.08, 1.56 and 316.18 respectively.

Conclusion: Our findings identified that childhood diarrhea was affected by not only individual level factors but also community-level factors. At the individual level (age of the women, number of under five children in the households, age of the child, number of family members, maternal education, and the number of under-5 children) and the community-level, place of residence were significant factors associated with childhood diarrhea in Ethiopia.

Introduction

Globally, diarrhea is the second prominent cause of death in children next to pneumonia. Every year, there are 1.7 billion children who develop diarrhea and at least 525,000 die from diarrhea. Child under 3 years old experience about 3 episodes of diarrhea per year(1). In low- and middle-income countries such as Indonesia, diarrhea still remains one of the health problems due to its high morbidity and mortality(2).

The passing of three or more loose or liquid stools a day is considered as diarrhea (or more frequent passage than is normal for the individual). Passing shaped stools on a regular basis is not diarrhea, nor is passing loose, "pasty" stools by breastfed infants.(1). Diarrhea is objectively defined as passing a stool volume greater than 200 ml or weight 200g per 24 hours(3).

According to a 2016 study, diarrhea affected 23 % -25 % of those aged 6–23 months. The children of families who use unprotected wells have the highest incidence of diarrhea (18 %). In many developing countries, diarrhea-related deaths are still common. For example, according to a 2012 study, infant and under-five mortality rates are still high in Ethiopia.(4, 1).

In 2008, the global rotavirus-associated mortality among children aged less than 5 years was estimated to be 453,000 deaths, accounting for 37 percent of diarrhea-related deaths and 5% of all deaths in children aged less than 5 years(5).

The World Health Organization (WHO) recommends that all countries, particularly those with a high rate of diarrhea-related mortality among children under the age of five, use rotavirus vaccines on a regular basis. In Ethiopia, few rotavirus vaccines have been implemented into private or public health programs. Prior to implementing new vaccines, the WHO suggests that countries perform local surveillance studies.(6).

The possible complications of an acute diarrheal illness include dehydration, metabolic acidosis, impaired consciousness, convulsions, circulatory shock, and pre-renal azotemia(10). Finally, chronically also three complications of enteric infection including reactive arthritis (ReA), Guillain–Barré syndrome (GBS) and post-infectious irritable bowel syndrome (PI‐IBS) may developed(11).

Many strategies were achieved by the Millennium development goals in the last 15 years and the strategy of Sustainable Development Goals (SDGs) is on the way, but still the prevalence of diarrhea is high in many parts of the world. Despite the emphasis given by the Ethiopian ministry of health and the respective regional health offices to improve child health, still many children are dying due to easily preventable and treatable diarrheal disease in Ethiopia. It's important to understand the causes of diarrhea in children under the age of five at community and individual level in order to learn the best preventive approach and formulate an effective strategy. As a result, this study was conducted to look into the individual and community level determinants of diarrhea among under five children in Ethiopian based on EDHS 2016. It has to be done a lot to prevent the burden of diarrhea in this age group. Therefore, in an effort to combat the problem, this study contributed by exploring factors associated with diarrhea at community (cluster) level and individual level

This in turn serve as an input for policy makers, others stakeholders or anybody it may concern to formulate an effective solution on these common factors that associated with diarrhea among this group age children specifically where the prevalence is high in Ethiopia. Different Organizations can also use the finding of this study for assessing and evaluating interventions towards maternal and child health care which enables them redesign it accordingly. In addition, it can be used as a baseline for further research. In addition, it can be used as a baseline for further research.

Methods And Materials

Study Area and setting

Ethiopia is situated in the northeastern part of Africa. It found between 30 and 150 north latitude and 330 and 480 east longitudes (40). It is bounded by six countries, namely: Eritrea, Djibouti, Kenya, Somalia, South Sudan and the Sudan, and the country covers an area of 1.1 million square kilometers ranging from 4,620m above sea level(41).The main climate type is tropical monsoon, with temperature climate on the plateau and hot in the lowlands. There are topographic-caused climatic variations broadly categorized into three: the “Kolla”, or hot low lands which are found up to approximately 1,500 meters above sea level, the “Wayna Degas” which ranges between 1,500-2,400 meters above sea level and the “Dega” or cool temperate highlands 2,400 meters above sea level. Ethiopia has a total of 114,963,588 populations; of this 18,394,194 are under-five children(41). The country has 20% of urban area, Government Expenditure on Health Care is 4 % of the total expenditure in the country.(42).

The global report on food crisis indicates that, Ethiopia’s GDP Per Capita purchasing power parity (PPP) in the country is US $1916.1 and it has a poverty rate of 29.6%. The Human Development Index (HDI) rank is 174 among 187 countries and there are 9.7 Million people who are food insecured in the country. About 85% of the population is dependent on Agriculture in Ethiopia(41). There is a fertility rate of 4.6, infant mortality rate of 48 (per 1,000 live births) and child mortality rate of 67 per 1,000 live births in the country (43).

Study design and study period

A cross-sectional study design using secondary data from 2016 EDHS was conducted from February to May.

Source and Study Population

The source population is all Ethiopian children aged 0–59 months, who are living with the contemporary respondent, while the 2016 EDHS are being conducted. The study population was children who are incorporated in the 2016 Ethiopia Demographic and Health Surveys.

Sample Size determination and sampling procedures

A total of 10,641children from EDHS 2016 were included from nine geographical regions and two administrative cities of Ethiopia. The sampling frame used for 2016 EDHS was the Ethiopian Population and Housing Census (EPHC), which was conducted in 2007 by the Ethiopia Central Statistical Agency (CSA) with Federal Ministry of Health (FMOH). The sampling frame contains information about the Enumeration areas (EA) location, type of residence (urban or rural), and estimated number of residential households. The samples for 2016 EDHS are designed to provide estimates of key indicators for the country as a whole, for urban and rural areas separately, and for each of the nine regions and the two administrative cities.

The 2016 EDHS sample was stratified and selected in two stages. Each region was stratified into urban and rural areas, which yielded 21 sampling strata. Samples of EAs were selected independently in each stratum in two stages. Clear stratification and proportional allocation was achieved at each of the lower administrative levels by sorting the sampling frame within each sampling stratum before sample selection, according to administrative units in different levels, and by using a probability proportional to size selection at the first stage of sampling.

From the first stage, a total of 645 EAs (202 in urban areas and 443 in rural areas) were selected in 2016 EDHS and with probability proportional to EA size (based on the 2007 PHC) and with independent selection from each sampling stratum for this recent survey. A household listing operation was performed in all of the selected EAs. The resulting lists of households served as a sampling frame for the selection of households in the second stage. In the second stage of selection, a fixed number of 28 households per cluster were selected with an equal probability systematic selection from the newly created household listing. Totally, 18,008 households were selected of which 17,067 are occupied. In all of the selected households, height and weight measurements will be collected from children aged 0–59 months, and women aged 15–49.The 2016 EDHS sample contained 18,008 households from 645 clusters, and 15,683 women aged 15–49 years were interviewed; the response rate was 95%.

Inclusion and exclusion criteria

Inclusion criteria: Children 0–59 months of age, complete data on diarrhea status and children with their mothers for measurements and completion of the questionnaires during survey.

Exclusion criteria: Children whose age is unknown, children who were not with their mothers/caregivers for and children diarrhea status for last two week before survey were not measured excluded from the study.

Study variables

Dependent variables was diarrheal status of the child (0-59months)

Independent variables

Individual level factors

Socio-Demographic and Economic characteristics of the family (household) include age of child, sex of child and wealth status. Under maternal and child related factors incorporate education level, maternal Age, child nutritional status, maternal or caregiver’s economical and educational status, hand washing practice during critical times, household wealth index, vaccination status of the child, child feeding practice, maternal employment status and maternal or caregiver’s diarrhea history. Community level factors were source of drinking water, unprotected water sources, improper disposal of wastes, family member size, toilet facilities, no of Children in household, place of residence and region.

Operational definition

Under Five Childhood Diarrhea: - It was defined as the presence or absence of UFCD during the last two weeks prior to this study(44).

Improved drinking water sources: - included piped water, public taps, standpipes, protected shallow wells, and springs.

Unimproved water sources: - were surface waters, unprotected shallow wells, and unprotected springs.

Improved latrines: - included any non-shared toilet, mostly flush toilets connected to piped sewer systems, septic tanks, and pit latrines, ventilated improved pit latrines, and pit latrines with slabs.

Unimproved latrines: - included the pour-flush type not connected to a sewer, pit latrines without a slab, open pits, and open defecation. Critical hand washing times were nominated as; before food preparation, eating, supplementary child feeding, and breastfeeding and after defecation and cleaning a child after defecation(43).

Vaccination status:- was considered fully vaccinated at 12 months, if the child had received the following vaccinations in the first year of life and have confirmed immunization card(45).

Appropriate child feeding practice:- Early initiation of breastfeeding within first hour of birth, exclusive breastfeeding for the first six months followed by continued breastfeeding for up to two years and beyond with appropriate complementary foods after completion of 6 months(46).

Family member size: - number of family member living with fewer than five children.

High birth order: -when the birth order duration is less than one year gab.

Data collection methods and Tools

Before extracting the data, permission was obtained from demographic health survey data center by persuading the purpose of the study. After getting permission, data were downloaded in Stata software data set form. Stata version 14 was used for cleaning and analysis of data.

For the purpose of this research, the under-five children data separately was received from central statistical agency by registered in it. The link was received and downloaded.

Data Processing and Analysis

Data cleaning was done to check for consistency and missing value. Recoding, labeling and exploratory analysis was performed. Categorization was done for continuous variables using information from different literatures and re-categorization was done for categorical variables accordingly. Model fitness was done by using Log likelihood, AIC, BIC and ICC. Sample weights were applied in order to compensate for the unequal probability of selection between the strata that are geographically defined, as well as for non-responses.

Multilevel analysis was conducted after checking that the data is eligible for multilevel analysis that means ICC greater than 10%. ICC calculation formula is as follows:

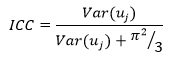
 \(Var\left({u}_{oj}\right)\) : Is the community (cluster) level variance.

: Is the standard logistic distribution, that is, the assumed individual variance?

Since DHS data are hierarchical, i.e., individuals (level 1) were nested with in communities (level 2), two-level mixed-effects logistic regression model was fitted to estimate both independent (fixed) effects of the explanatory variables and community-level random effects on childhood diarrhea.

Because the log of the probability of childhood diarrhea was modeled using two-level multilevel model as follows;\(log\left[\frac{{\pi }_{ij}}{1-{\pi }_{ij}}\right]={\beta }_{0}+{\beta }_{1}{\text{{\rm X}}}_{ij}+\dots {\beta }_{2}{\text{Y}}_{ij}+{u}_{j}+{e}_{ij}\)

Where, i and j are the level 1 (individual) and level 2 (community) units, respectively; X and Y refer to individual and community-level variables, respectively; \({\pi }_{ij}\) is the probability of childhood diarrhea for the ith under-five child in the jth community and \(1-{\pi }_{ij}\) is probability of under-five child don’t have diarrhea for the ith under-five child in the jth community(cluster). The β’s was the fixed coefficients. Whereas, β0 is the intercept-the effect on the probability of childhood diarrhea in the absence of influence of predictors; and \({ u}_{j}\) showed the random effect (effect of the community on childhood diarrhea) for the jth community and \({e}_{ij}\)showed random errors at the individual levels. By assuming each community had different intercept (β0) and fixed coefficient (β), the clustered data nature and the within and between community variations were taken in to account.

Bi-variable and multilevel logistic regression analysis was done and model fitness was checked. Those variables which had P-value less than 0.25 were candidates to build model 3 (model-3). After this analysis was performed, four models were constructed for this multilevel logistic regression analysis. The first model was an empty model or null model without any explanatory variables, to evaluate the extent of the cluster variation on diarrhea among under five children. The second model was adjusted for the individual-level variables; the third model can be adjusted for community (cluster) level variables while the fourth model was adjusted for both the individual and community level variables simultaneously.

The measures of association (fixed-effects) estimates the associations between likelihood of under-five children diarrhea and various explanatory variables were expressed as Adjusted Odds Ratio (AOR) with their 95 % Confidence level. A variable in which the confidence interval does not include the null value and p-value < 0.05 can be used to define statistical significance.

The measures of variation (random-effects) were reported by using intra-cluster correlation (ICC), Median Odds Ratio (MOR) and proportional change in variance (PCV). PCV was calculated to measure the variation between clusters. ICC was used to explain cluster variation while MOR is a measure of unexplained cluster heterogeneity (39).

The ICC shows the variation in under-five diarrhea due to community characteristics. The higher the ICC, the more relevant was the community characteristics for understanding individual variation in childhood diarrhea. The ICC was calculated as follows: [ICC = V/V + P2/3] where V is the estimated variance of clusters. MOR is defined as the median value of the odds ratio between the area at highest risk and the area at lowest risk when randomly picking out two areas and it was calculated using the formula [ MOR = exp (√2V + 0.6745) ≈ exp (0.95*V)]. In this study MOR shows the extent to which the individual probability of under-five diarrhea is determined by residential area. The proportional change in variance (PCV) measures the total variation attributed by individual level factors and area level factors in the multilevel model.

The variability on the odds of childhood diarrhea explained by successive models was calculated by Proportional Change in Variance (PCV) as:

 \(PCV=\frac{{V}_{e}-{V}_{mi}}{Ve}\) , Where,

 \({V}_{e}\) : is the variance in childhood diarrhea in the null model

 \({ V}_{mi}\) : The variances in the successive models.

The presence of Multicollinearity was checked among independent variables using standard error at cut off point of ± 2. Log likelihood test and AIC (Akakian Information Criteria) was used to estimate the goodness of fit of the adjusted final model in comparison to the preceding models (individual and community level model adjustments). The log likelihood value for each subsequent model was compared and the model with the highest value was considered to be the best fit model. On the contrary, the model with the lowest AIC was the best.

Data quality assurance

For 2016 EDHS pretest containing in-class training, biomarker training, and field practice days were conducted. The field practice was conducted in clusters around Bishoftu which were not included in the 2016 EDHS sample. A total of 60 trainees attended this pretest. Following the field practice, a debriefing session was held with the pretest field staff, and modifications to the questionnaires were made based on lessons drawn from the exercise. CSA recruited and trained 294 people for the main fieldwork who were to be engaged as team supervisors, field editors, interviewers, secondary editors, and reserve interviewers. The training was conducted from December 14, 2015, to January 17, 2016, at Debre Zeit Management Institute in Bishoftu. The training session consisted of instruction regarding interviewing techniques and field procedures, a detailed review of questionnaire content, instruction on how to administer the paper and electronic questionnaires, mock interviews between participants in the classroom, and practice interviews with real respondents in areas outside the survey sample. Data quality management during the recent EDHS survey was published (43). An Initial exploratory analysis was conducted to check for outliers, missing and consistency of dataset.

Result writing and dissemination plans

The result of the study will be written and presented to Debre Berhan University, College of Health Sciences, and Department of Public Health. The finding of this study will be disseminated timely to all relevant stakeholders that may concern themselves. It will be sent for publication in scientific journal, and online dissemination will be taken into account. Presentations on different occasions will be made on various seminars, workshops and scientific conferences.

Ethical consideration

Ethical clearance was obtained from the Ethical Review Committee of Debre Berhan University, College of Health Sciences with approval and supporting letter. Authorization letter of permission for downloading 2016 EDHS dataset was obtained from CSA of Ethiopia, by requesting with the website https;//dhsprogram.com/data/terms-of-use.cfm with the help of ICF international. All data was treated as confidential and no need to identify any household or individual respondent interviewed in the survey.

Result

Socio-demographic characteristics of the respondents

A total of 10,641 under five children nested with 645 clusters were included from 2016 EDHS data. The mean (standard deviation) age of children who participated in the study was 29.15months (± 17.41). Nearly 49 % of the respondents were in the age group of 25–35 years. The majority of the study participants (81.45%) were from rural residence. Most of the children’s mother (64.3%) had no formal education. Majority of the households (83.3%) have unimproved toilet facilities, while 54% used unprotected water as a source of drinking water. The overall prevalence of diarrhea in Ethiopia based on EDHS 2016 was 11.78 (95% CI: 10.28–12.05). The highest prevalence of diarrhea was observed in children resides in southern Nations Nationalities and People’s region (SNNPR) (1.68%) whereas the lowest prevalence seen in Addis Abeba (0.3%)

The proportion of children with diarrhea based on individual and contextual level background characteristics of the study participants are showed in Table 1. From the total children who had experienced diarrhea, 15.8%, 9.8%, 23.2%, 22.6%, 4.6% and 24.1% were found to be in the age category of < 6, 6–11, 12–23, 24–35, 36–47 and 48–59 months, respectively. Majority of the household, 78.8% of them were headed by male. Among the total households, 55% of them have more than 6 family members where as 45% of them have less than 5 members in the household.

Table 1

Background characteristics of the selected respondents in the households (n = 10641)

Variables

Category

Unweighted N (%)

Weighted N (%)

Age of women

Less than 25 years

3,560(33.46)

3,498(31.74)

25–35 years

5,216(49.02)

5,389(48.89)

> 35 years

1,865(17.53)

2,134(19.37)

Place of residence

Urban

1,974(18.55)

1,215.56(11.03)

Rural

8,667(81.45)

9,807(88.97)

Region

Tigray

1,033(9.71)

715.88 (6.49)

Afar

1,062(9.98)

114.26 (1.04)

Amhara

977(9.18)

2,072.29(18.80)

Oromia

1,581(14.86)

4,850.90(44)

Somali

1,505(14.14)

507.93(4.61)

Beninshngual

879(8.26)

121.6(1.10)

SNNRP

1,277(12)

2,296.2(20.83)

Gambela

714(6.71)

26.9(0.24)

Harari

605(5.69)

25.8(0.23)

Addis Abeba

461(4.33)

243.94(2.21)

Dire Dawa

547(5.14)

45(0.43)

Educational status of women

No formal Education

6,838(64.26)

7,283.9(66.08)

Primary Education

2,678(25.17)

2,950(26.77)

Secondary Education

734(6.9)

513.82(4.66)

Higher Education

391(3.67)

274.24(2.49)

Sources of drinking water

Improved

6,231(58.56)

6,026(54.68)

Unimproved

1,909(17.94)

6,026(26.13)

Others

2501(23.5)

2,115.37(19.19)

Types of toilet

Improved toilet facility

1,799(16.91)

1,082(9.82)

Unimproved toilet facility

8,709(81.84)

9,897.89(89.8)

Others

133(1.25)

42.02(0.38)

House floor type

Good floor

1,931(18.25)

1,308.59(11.87)

Poor floor

8,577(80.60)

9,556.95(86.70)

Other floor type

133(1.25)

157.14(1.43)


Religion

Orthodox

3,082(28.96)

3,771.81(34.22)

Catholic

72(0.68)

103.37(0.94)

Protestant

1,862(17.5)

2,329.15(21.13)

Muslim

5,442(51.14)

4,561.15(41.38)

Traditional

103(0.97)

149.9(1.36)

Others

80(0.75)

107.27(0.97)

Number of Family members

Less than 5 members

4,780(44.92)

4,846.5(43.97)

Greater than 6 members

5,861(55.08)

6,176.18(56.03)

Number of U-5 children

Less than 2 children

8,627(81.07)

9,172.61(83.22)

Greater than 3 children

2,014(18.93)

1,850(16.78)

Sex of the household Head

Male

8,383(78.78)

9,493.83(86.13)

Female

2,258(21.22)

1,528.86(13.87)

Wealth index

Poor

5,775(54.27)

5,156(46.78)

Medium

1,466(13.78)

2,279.97(20.68)

Rich

3,400(31.95)

3,586.7(32.54)

Breast feeding

No

3,821(35.91)

3,557.38(32.27)

Yes

6,820(64.09)

7,465.3(67.73)

Twin

No

10,363(97.39)

10,730(97.35)

Yes

278(2.61)

292.4(2.65)

Sex of the child

Male

5,483(51.53)

5,724.91(51.94)

Female

5,158(48.47)

5,297(48.06)

Age of the child

Less than 1 year

635(5.97)

605.43(5.49)

1–2 Years

4,054(5.97)

4,275.02(38.78)

2–3 Years

1,926(18.10)

1,943.52(17.63)

3–4 Years

1,930(18.14)

2,007.21(18.21)

4–5 Years

2,096(19.70)

2,191.48(19.88)

Vitamin A supplemented

No

3,528 (59.00 )

4,052(65.16 )

Yes

2,452(41)

2,166.5071(34.84)

Measles vaccination

No

3,531( 59)

3,765.53( 60.55)

Yes

2,449(40.95)

2,453(39.45)

Rota 1 vaccination

No

2,587(24.31)

2,963.49(23.95)

Yes

3,280(30.82)

3,419.41(31.02)

Unknown status

4,774(44.86)

4,963.49(45.03)

Rota 2 vaccination

No

3,111(29.24)

3,220.84(29.22)

Yes

2,756(25.9)

2,838.35(29.22)

Unknown status

4,774(44.86)

4,963.49(45.03)

Diarrhea

Yes

1,265 (11.89)

9,190(88.22)

No

9,376 ( 88.13)

1,227(11.78)


Majority of the household (81%) have less than 2 under-five children and 19 % of the household have more than 3 under-five children in the household.

During multilevel binary logistic regression those variables like children who have taken measles vaccine, Rota 1 and Rota 2 vaccine, vitamin A supplementation, age of child between 12–23 months, household with a family member of 6 and above, unimproved toilet facility, mothers with no formal education and mothers age greater than 35 years were candidates for the final model of multilevel analysis. Table 2 shows unadjusted or crude odds ratio (COR) results that were obtained when we are taken into account the effect of only one independent variable in the analysis.

Table 2

Multilevel bivariate logistic regression analysis of under-five diarrhea with socio-demographic characteristics and predictors.

Characteristics

Category

Prevalence of Diarrhea


p-value


Yes

No

COR 95% CI


Age of mother

Less than 25 years

2,937

393

1

1

25–35 years

4,394

534

0.91(0.79–1.04)

0.173

> 35 years

1,585

163

0.77(0.63–0.931)

0.007**

Place of residence

Urban

1,721

186

1

1

Rural

7,195

904

1.162(0.98–1.37)

0.076

Educational status of women

No formal Education

5,723

664

1.21(0.95–1.55)

0.034**

Formal Education

3,193

426

1

1

Sources of drinking water

Protected

3,963

480

0.98(0.86–1.11)

0.796

Unprotected

4,953

610

1

1

House floor type

Good

1,667

181

1

1

Poor

7,148

888

1.15(0.97–1.36)

0.10

Types of toilet

Improved

1,575

163

1

1

Unimproved

7,306

922

0.82(0.68–0.977)

0.026**

Religion

Orthodox

2,601

343

1.12(0.97–1.28)

0.109

Catholic

53

8

1.28(0.60–2.70)

0.519

Others

6,262

739

1

1

Number of Family members

Less than 5 members

3,901

523

1

1

Greater than 6 members

5,015

567

0.84(.74-0.95)

0.008**

Number of U-5 children

Less than 2 children

7,129

923

1.39(1.16–1.64)

0.01

Greater than 3 children

1,787

167

1

1

Sex of the household Head

Male

6,986

889

1.22(1.04–1.43)

0.01


Female

1,930

201

1

1

Wealth index

Poor

4,819

557

0.92(0.80-1.062)

0.263


Medium

1,214

172

1.13(.93 1.37)

0.21


Rich

2,883

361

1

1

Breast feeding

No

4,941

429

0.73(0.475–1.13)

0.161


Yes

361

23

1

1

Twin

No

8,719

1,067

1

1


Yes

197

23

0.95(0.61 1.476)

0.733

Sex of the child

Male

4,520

587

1

1


Female

4,396

503

0.88(0.77–0.99)

0.05*

Age of the child in months

< 6 months

1,189

111

2.06(1.54–2.76)

0.001**

6–11 months

646

161

5.51(4.18–7.27)

0.001**

12–23 months

1,573

336

4.72(3.69–6.04)

0.001**

24–35 months

1,634

225

3.046(2.35–3.94)

0.001**

36–47 months

352

31

1.9487(1.27–2.98)

0.002**

48–59 months

1,903

86

1

1

Vitamin A supplemented

No

3,071

457

0.798(0.68–0.92)

0.003*

Yes

2,067

385

0.76()

1

Measles vaccination

No.0532809

3,085

446

0.749(0.64–0.867)

0.001**

Yes

2,053

396

1

1

Rota 1 vaccination

No

2,303

284

1.60(1.37–1.86)

0.001**

Yes

2,739

541

1

1

Rota 2 vaccination

No

2,741

370

1.5(1.26–1.69)

0.001**


Yes

2,301

455

1

1


Predictors of childhood diarrhea among under-5 children in Ethiopia

On binary multilevel logistic regression analysis, residence, educational status the mother, toilet facility, number of family members, sex of the household head, age of the child and Rota virus vaccination were associated with the outcome variable diarrhea(P-value < 0.25). (Table 2)

The odds of diarrhea among children reside in rural area were 1.84 times more likely to develop diarrhea (AOR = 1.84; 95% CI: 1.52–2.16) as compared to urban dwellers. Those children aged between 13 and 24months were 2.2 times more likely to have diarrhea than (AOR = 2.2, 2.15–2.98) their older counter parts (48–59 months). The odds of diarrhea among children whose mother had no formal education were 31% higher (AOR = 1.31(1.20–2.45) than children whose mother had attended formal education.

The odds diarrhea among children with more than five family members in the household were 16% (AOR = 0.84(0.73–0.96) lower than households who have less than five family members. Children live in households with more than 2 under five children were 1.56 times higher (AOR = 1.56; 95% CI: 1.29–2.96) odds of experiencing diarrhea than families with greater than two under-5 children. (Table 3)

Table 3

Predictors associated with childhood diarrhea recognized by multilevel multivariable logistic regression models.

Variables

Category

Model 1 (Null Model)AOR(95% CI)

Model 2 AOR(95% CI)

Model 3

Model 4

Individual and community level factors


Age of mother

Less than 25 years


1


1

25–35 years


1.04(0.65–1.68)


1.12(0.69–1.82)

> 35 years


0.52(0.21–1.25)


0.56(0.23–1.34)

Place of residence

Urban


1

1

Rural


1.08(0.85–1.38)

1.06( 1.52–2.16)*

Educational status of women

No formal Education


1.39(1.25–2.59)


1.31(1.20–2.45)*

Formal Education


1


1

Toilet shared with neighbors

No


1

1

Yes


1.35(1.12–1.63)

2.64(1.61–4.33)**

Sources of drinking water

Protected


1

1

Unprotected


1.02(0.78–1.19)

0.9(0.54–1.5)

House floor type

Good


1


1

Poor


1.49(0.8–2.77)


1.37(0.69–2.7)

Toilet facility

Improved


1


1

Unimproved


0.76(0.45–1.28)


0.67(0.38–1.19)

Religion

Orthodox


0.81(0.47–1.38)


0.79(0.42–1.46)

Catholic


1.27(0.12–13.06)


0.84(0.067–10.69)

others


1


1

Number of Family members

Less than 5 members


1


1

Greater than 6 members


0.92(0.56–1.54)


0.75(0.62–0.90)

Number of U-5 children

Less than 2 children


1.85(0.97–3.51)


1.56(0.81–2.99)

Greater than 3 children


1


1

Sex of the household Head

Male


1


1


Female


2.02(1.11–3.67)


2.06(1.12–3.76)*

Wealth index

Poor


0.79(0.43–1.48)


0.8(0.4–1.56)


Medium


0.70(0.34–1.44)


0.7(0.34–1.50)


Rich


1


Breast feeding

No


1.32(0.577–3.04)


1.31(0.56–3.04)


Yes


1


Twin

No


0.47(0.204–1.12)


0.57(0.24–1.36)


Yes


1


Sex of the child

Male


1


Female


0.54(0.35–0.85)


0.53(0.34–0.82)*

Age of the child in months

< 6 months


0.14(0.007–3.07)


0.14(0.007–3.05)

6–11 months


0.20 (0.11–3.83)


0.21(0.11–3.93)

12–23 months


2.1 (2.15–3.09)


2.2(2.15–2.98)*

24–35 months


0.19 (0.13–2.66)


0.17(0.13–2.43)

36–47 months


()


()

48–59 months


1


1

Vitamin A supplemented

No


0.8(0.53–1.35)


0.82(0.51–1.32)

Yes


1


1

Measles vaccination

No


0.77(0.43–1.36)


0.77(0.44–1.36)

Yes


1


1

Rota 1 vaccination

No


0.77(0.34–1.74)


0.72(0.32–1.61)

Yes


1


1

Rota 2 vaccination

No


1.07(0.50–2.30)


1.03(0.48–2.19)


Yes


1


Measure of Variation

Variance (SE)

0.6072(0.053)

0.259(0.364)

0.29(0.058)

0.12(0.36)

P-value

< 0.001

< 0.001

< 0.05

< 0.001

ICC

10.08(7.3–13)

7.30(0.50–5.52)

8.27(5.77 11.75)

3.48(0.1–9.02)

PCV


0.5734

0.522

0.802

MOR

1.56

0.67

0.75

0.31

Model fitness

AIC

6821.008

697.48

6795.51

702.19

BIC

6835.43

829.33

6903.67

858.46

DIC(-2 log likelihood)

3408.50

321.74001

3382.76

316.18305

Abbreviations : AIC, Akaike’s information criterion; BIC, Bayesian information criteria; ICC, intra-class correlation coefficient; DIC, deviance information criterion; SE, standard error. Model 1 (Empty model) was fitted without determinant variables. ; Model 2 is adjusted for individual-level variables. Model 3 is adjusted for community-level variables; Model 4 is the final model adjusted for individual- and community-level variables.
**P-value < 0.01(Adjusted OR); *P-value < 0.05(Adjusted OR)


The odds of experiencing diarrhea among households headed by female were 2 times higher (AOR = 2.06, 95%CI: 1.12–3.76) when compared with household headed by male. The odds of diarrhea among children who have shared toilet with neighbors were 2.64 times higher when compared with children who haven’t shared toilet facility with neighbors (AOR = 2.64, 1.61–4.33). Children with female sex were 47 % (AOR = 0.53, 0.34–0.82) lower odds of experiencing diarrhea than counter parts. (Table 3)

Random Effects (Measures of Variation)

Table 3 shows the result of random effect model. The odds of diarrhea varied among clusters (communities).i.e. the odds of diarrhea has not been spread evenly across clusters (communities). The prevalence of diarrhea had a significant variance at community level as the result showed by null model (model 1). The MOR for diarrhea was 1.56 in the null model which indicates that there was a variation between communities (clustering) 1.56 times higher than the reference (MOR = 1). In other way, the median odds ratio (MOR) outcomes, a measure of unexplained cluster heterogeneity was 1.56 in null model. The unexplained cluster variation in childhood diarrhea decreased when all variables were added to the empty model. The ICC in the empty model was 10.08 %, indicating that 10.08% of the total variability for diarrhea was due to differences between clusters/EA, with the remaining unexplained 89.92% which is contributed by individual level differences (Table 3).

Discussion

Diarrheal diseases are a major cause of children mortality for children resides in sub-Sahara African countries. This study was done to assess the predictors of diarrhea among under-5 children in Ethiopia. A total of 10641 under five children nested with 645 clusters were included from 2016 EDHS data. We found that childhood diarrhea in Ethiopia was clustered and affected by different individual and community level factors through multilevel logistic regression analysis.

In this study, the prevalence of diarrhea was 11.78% which was lower than other studies. This discrepancy might be due to the strengthening of the Health Extension Program (HEP), improving access to health care to meet the primary health services and the introduction of integrated community cause management program (17, 21, 22, 23).

At the individual level, variables such as age of the child, sex of the child, maternal educational status, number of family members, sex of the household head, and numbers of under-5 children were significantly associated with childhood diarrhea. Similarly, at community-level residence and toilet facility shared with others were significantly associated with childhood diarrhea.

It is acceptable that the educational status of mother is more likely to influence childhood diarrhea and educated mothers have a positive influence on hygienic practices. In this study, the odds of diarrhea were higher among children whose mothers had no formal education than children whose mothers had formal education. The study findings are consistent with other studies, which found higher odds of childhood diarrhea among children whose mothers had not attended formal education in Ethiopia, (27, 39, 42) Kenya (36).

In this study, the odds of diarrhea among children reside in rural area were 1.84 times more likely to develop diarrhea as compared to urban dwellers. This finding is supported by a study conducted in west Gojjam, Ethiopia (41). This could be explained by children and mothers who live in urban area may have good awareness about hand hygiene, sanitation and access to toilet facility. They could also have access to improved water sources.

In the present study, those children aged between 13 and 24 months were 2.2 times more likely to have diarrhea than their older counter parts (48–59 months). This finding is in line with a study done in Arba Minch, Benchi Maji, Sodo and EDHS 2011. (25, 26, 27, 40). This can be explained by children during this age group start supplementary feeding. Besides, it is a time of crawling for children and they eat dirty particles whatever they get in the floor and mothers within this age category mayn’t have experience on child care, good feeding and hygiene practices.

According to present study, the odds of diarrhea among children with more than five family members in the household were lower than households who have less than five family members. This is in line with a study conducted in Indonesia (37). This may be due to households having five or more family members will get attention towards hygiene practice because they could get coach or see from the family members. As a result, a child living in households with more than five family member’s under-5 children becomes less vulnerable to diarrhea. On the other hand, children in households having less than five family member’s under-5 children lack experience and necessary support from their older sibling toward toilet training and other sanitary practice, which possibly associate with childhood diarrhea.

The odds of experiencing diarrhea among households headed by female were 2 times higher (AOR = 2.06, 95%CI: 1.12–3.76) when compared with household headed by male. The possible explanation can be due to work overload on female when there is loss of partner or lack of support from family members’. As a result, they may lack time to give care and coach the children.

In our study, Children live in households with more than 2 under five children were 56% higher odds of experiencing diarrhea than families with greater than two under-5 children. This is consistent with a study done in Soddo, Bahirdar Zuria, West Gojjam, Gondar and Tigray (40, 33, 41, 32, and 42). This can be explained by mothers mayn’t get enough time to keep the hygiene and provide care and support to the children. As a result, it became a challenge to taking care of multiple young children.

The odds of diarrhea among children who have shared toilet with neighbors were 2.64 times higher when compared with children who haven’t shared toilet facility with neighbors. This finding is consistent with a study conducted at Senegal, melbour. The possible explanation when toilet facilities shared by neighbor or de jure, the toilet may be contaminated by different infectious agent and can easily acquire by the children while the use the toilet facilities.

Strength and Limitation of the Study

We had used a multilevel model for analysis to take into account the clustered nature of the data and possible to know the individual level effect, community level factors effect and mixed effect and increase the accuracy of estimates. In addition to this, it can prevent ecological and atomistic fallacy. As a limitation of this study, we can’t find variables from the survey like health insurance, distance to health facility. Since it is a survey, there may be a possible recall bias and seasonal variation is not considered because the dataset is collected within a specified period of time.

Conclusion

Our findings identified that childhood diarrhea was affected by not only individual level factors but also community-level factors. At the individual level (age of the women, number of under five children in the households, age of the child, number of family members, maternal education, and the number of under-5 children) and the community-level, place of residence were significant factors associated with childhood diarrhea in Ethiopia. The findings show that there is a need to consider some of the modifiable factors in the existing interventions in order to improve child health outcomes at country level.

Recommendations

At Ministry of Health, designing innovative approaches to combat communicable diseases especially for under five children and better to design peculiar policy for rural resident mothers.

The Regional Health Bureau ought to give priority on offering services for mothers who had not attended formal education. Besides, Zonal Health Bureau should strengthen health extension package with focused approach of preventing communicable diseases and construction of toilet facilities in each household is very important. Woreda Health office should provide health education about hygiene, sanitation and child care for households in the first five years of life have a paramount role in reducing the odds of diarrhea. Efforts ought to be made to disseminate information about diarrhea through different programs, the importance of hygiene, coaching and sanitation. Supports from partners are very highly recommended especially when there is more than two under five children in the household.

Abbreviations

AIC: Akakian Information Criteria; BIC: Bayesian Information Criteria; CSA: Central Statistical Agency; DHS: Demographic and Health Survey; EAs: Enumeration Areas; EDHS: Ethiopian Demographic and Health Survey; EPHC: Ethiopian Population and Housing Census; VIF: Variance Inflation Factor; WASH: Water, Sanitation and Hygiene; WAZ: Weight-for-Age Z-score; WHO: World Health Organization

Declarations

Competing interests

The authors declare that they have no competing interests among authors.

Ethics and consent

Ethical approval was obtained from the Ethical Review Committee of Debre Berhan University. Letter of authentication was obtained from DHS program before undertaking the study.

Acknowledgement

I would like to convey my warmest gratitude for DHS workers for giving us their providing the dataset for further extraction and computing analysis. I am also grateful to Debre Berhan University for providing me with the chance to conduct this study.

Availability of data and materials

The datasets generated and analyzed during the current study are publicly available without any restriction upon request. We can avail the questionnaires and other tools upon reasonable request.

Authors’ contributions

Conceptualization: Mekasha Getnet

Data curation: Mekasha Getnet

Formal Analysis: Mekasha Getnet

Investigation: Esubalew Tesfahun

Methodology: Mekasha Getnet

Project Administration: Esubalew Tesfahun

Resources: Mekasha Getnet

Software: Mekasha Getnet

Supervision: Esubalew Tesfahun

Validation: Esubalew Tesfahun

Visualization: Esubalew Tesfahun

Writing original Draft: Mekasha Getnet

Writing-review and editing: Mekasha Getnet

Funding

Not applicable

Declaration

The two authors are agreed to publish on Italian Journal of Pediatrics.

References

  1. World Health Organization (WHO). World health statistics of diarrheal profile. https//www.who.int/ Top. 2017;
  2. Kementrian Kesehatan Republik Indonesia. Profil Kesehatan Indonesia Tahun 2011. Kementrian Kesehatan Republik Indonesia. 2012.
  3. Sweetser S. Evaluating the patient with diarrhea: A case-based approach. Mayo Clin Proc [Internet]. 2012;87(6):596–602. Available from: http://dx.doi.org/10.1016/j.mayocp.2012.02.015
  4. FMOH. Democratic F, Of R. Federal Democratic Republic of Ethiopia National Nutrition Program. EDHS. 2016;
  5. Devita M. Lack of Mother’s Personal Hygiene Related to Diarrhea. J Stikes. 2013;6(1):119–28.
  6. Manuscript A. Europe PMC Funders Group Europe PMC Funders Author Manuscripts GABA A receptors : 2009;6123(06):21–41.
  7. Gelaw A, Pietsch C, Liebert UG. Molecular epidemiology of rotaviruses in Northwest Ethiopia after national vaccine introduction. Infect Genet Evol [Internet]. 2018;65(August):300–7. Available from: https://doi.org/10.1016/j.meegid.2018.08.016
  8. Anteneh ZA, Andargie K, Tarekegn M. Prevalence and determinants of acute diarrhea among children younger than five years old in Jabithennan District, Northwest Ethiopia, 2014. BMC Public Health [Internet]. 2017;17(1):1–8. Available from: http://dx.doi.org/10.1186/s12889-017-4021-5
  9. Susanti WE, Novrikasari, Sunarsih E. Determinan Kejadian Diare Pada Anak Balita di Indonesia (Analisis Lanjut Data SDKI 2012). J Ilmu Kesehat Masy. 2016;7(1):64–72.
  10. Koletzko S, Osterrieder S. Akute infektiöse durchfallerkrankung im kindesalter. Dtsch Arztebl. 2009;106(33):539–48.
  11. Connor BA, Riddle MS. Post-infectious sequelae of travelers’ diarrhea. J Travel Med. 2013;20(5):303–12.
  12. Lovchinov VA, Mädge H, Christensen AN. On the thermodynamic properties of Vnx. Vol. 2, Materials Letters. 1984. 497–501 p.
  13. Bogale GG, Gelaye KA, Degefie DT, Gelaw YA. Spatial patterns of childhood diarrhea in Ethiopia: Data from Ethiopian demographic and health surveys (2000, 2005, and 2011). BMC Infect Dis. 2017;17(1):1–10.
  14. Wardlaw T, Salama P, Brocklehurst C, Chopra M, Mason E. Diarrhoea: why children are still dying and what can be done. Lancet [Internet]. 2010;375(9718):870–2. Available from: http://dx.doi.org/10.1016/S0140-6736(09)61798-0
  15. Black RE, Allen LH, Bhutta ZA, Caulfield LE, de Onis M, Ezzati M, et al. Maternal and child undernutrition: global and regional exposures and health consequences. Lancet. 2008;371(9608):243–60.
  16. Checkley W, Buckley G, Gilman RH, Assis AM, Guerrant RL, Morris SS, et al. Multi-country analysis of the effects of diarrhoea on childhood stunting. Int J Epidemiol. 2008;37(4):816–30.
  17. Santika NKA, Efendi F, Rachmawati PD, Has EMM ah, Kusnanto K, Astutik E. Determinants of diarrhea among children under two years old in Indonesia. Child Youth Serv Rev. 2020;111(December 2019).
  18. Aziz FAA, Ahmad NA, Razak MAA, Omar M, Kasim NM, Yusof M, et al. Prevalence of and factors associated with diarrhoeal diseases among children under five in Malaysia: A cross-sectional study 2016. BMC Public Health. 2018;18(1):1–8.
  19. Mulatya DM, Ochieng C. Disease burden and risk factors of diarrhoea in children under five years: Evidence from Kenya’s demographic health survey 2014. Int J Infect Dis [Internet]. 2020;93:359–66. Available from: https://doi.org/10.1016/j.ijid.2020.02.003
  20. Thiam S, Diène AN, Fuhrimann S, Winkler MS, Sy I, Ndione JA, et al. Prevalence of diarrhoea and risk factors among children under five years old in Mbour, Senegal: A cross-sectional study. Infect Dis Poverty. 2017;6(1):1–12.
  21. Messelu Y, Trueha K. Application of Multilevel Binary Logistic Regressions Analysis in Determining Risk Factors of Diarrheal Morbidity among under Five Children in Ethiopia. Public Heal Res 2016. 2016;6(4):110–8.
  22. Alemayehu B, Ayele BT, Kloos H, Ambelu A. Individual and community-level risk factors in under-five children diarrhea among agro-ecological zones in southwestern Ethiopia. Int J Hyg Environ Health. 2020;224(December 2019).
  23. Mohammed S. Morbidity and Associated Factors of Diarrheal Diseases Among Under Five Children in Arba-Minch District, Southern Ethiopia, 2012. Sci J Public Heal. 2013;1(2):102.
  24. Alambo KA. The Prevalence of Diarrheal Disease in under Five Children and associated Risk Factors in Wolitta Soddo Town, Southern, Ethiopia. ABC Res Alert. 2015;3(2):12–22.
  25. Gebru T, Taha M, Kassahun W. Risk factors of diarrhoeal disease in under-five children among health extension model and non-model families in Sheko district rural community, Southwest Ethiopia: Comparative cross-sectional study. BMC Public Health. 2014;14(1):1–6.
  26. Alemayehu M, Alemu T, Astatkie A. Prevalence and Determinants of Diarrhea among Under-Five Children in Benna Tsemay District, South Omo Zone, Southern Ethiopia: A Community-Based Cross-Sectional Study in Pastoralist and Agropastoralist Context. Adv Public Heal. 2020;2020:1–11.
  27. Melese B, Paulos W, Astawesegn FH, Gelgelu TB. Prevalence of diarrheal diseases and associated factors among under-five children in Dale District, Sidama zone, Southern Ethiopia: A cross-sectional study. BMC Public Health. 2019;19(1):1–10.
  28. Getachew A, Tadie A, G.hiwot M, Guadu T, Haile D, G.cherkos T, et al. Environmental factors of diarrhea prevalence among under five children in rural area of North Gondar zone, Ethiopia. Ital J Pediatr. 2018;44(1).
  29. Asnakew DT, Teklu MG, Woreta SA. Prevalence of diarrhea among under-five children in health extension model households in Bahir Dar Zuria district, north-western Ethiopia. Edorium J Public Heal [Internet]. 2017;4(January):1–9. Available from: www.edoriumjournalofpublichealth.com
  30. Ayalew AM, Mekonnen WT, Abaya SW, Mekonnen ZA. Assessment of diarrhea and its associated factors in under-five children among open defecation and open defecation-free rural settings of Dangla District, Northwest Ethiopia. J Environ Public Health. 2018;2018.
  31. Wakigari R, Regassa W, Lemma S. Assessment of Diarrheal Disease Prevalence and Associated Risk Factors in Children of 6-59 Months Old at Adama District Rural. Ethiop J Heal Sc. 2015;6(6):581–8.
  32. Mulatya DM, Ochieng C. Disease burden and risk factors of diarrhoea in children under five years: Evidence from Kenya’s demographic health survey 2014. Int J Infect Dis. 2020;93:359–66.
  33. Zicof E, Sri Rahardjo S, Murti B. Multilevel Analysis: Biopsychosocial Determinants and Environmental Factor on the Incidence of Diarrhea Among Children Under Five in Surakarta. J Epidemiol Public Heal. 2018;03(03):323–30.
  34. Getachew B, Mengistie B, Mesfin F, ... Factors associated with acute diarrhea among children aged 0-59 months in Harar town, eastern Ethiopia. East African J … [Internet]. 2018;2:26–35. Available from: http://213.55.95.79/index.php/EAJHBS/article/view/1049
  35. Sinmegn Mihrete T, Asres Alemie G, Shimeka Teferra A. Determinants of childhood diarrhea among underfive children in Benishangul Gumuz Regional State, North West Ethiopia. BMC Pediatr. 2014;14(1).
  36. Tarekegn M, Enquselassie F. A case control study on determinants of diarrheal morbidity among under-five children in Wolaita Soddo Town, Southern Ethiopia. Ethiop J Heal Dev. 2012;26(2):78–85.
  37. Girma M, Gobena T, Medhin G, Gasana J, Roba KT. Determinants of childhood diarrhea in west Gojjam, northwest Ethiopia: A case control study. Pan Afr Med J. 2018;30:1–11.
  38. Asfaha KF, Tesfamichael FA, Fisseha GK, Misgina KH, Weldu MG, Welehaweria NB, et al. Determinants of childhood diarrhea in Medebay Zana District, Northwest Tigray, Ethiopia: A community based unmatched case-control study. BMC Pediatr. 2018;18(1):1–9.
  39. Berhe H, Mihret A, Yitayih G. Prevalence of Diarrhea and Associated Factors Among Children Under-Five Years of Age in Enderta Woreda, Tigray, Northern Ethiopia, 2014. Int J Ther Appl. 2016;31:32–7.
  40. Democratic F, Of R. Federal Democratic Republic of Ethiopia National Nutrition Program 2016-2020. 2020;(2016).
  41. Health FDR of EM 2020/21-2024/25. Health Sector Transformation Plan II. 2020;(April):1–128.
  42. FSIN. Global Report on Food Crises 2017. World Food Program. 2017;145.
  43. EDHS. FEDERAL DEMOCRATIC REPUBLIC OF ETHIOPIA Demographic and Health Survey. 2016. 1–59 p.
  44. Levine GA, Walson JL, Atlas HE, Lamberti LM, Pavlinac PB. Defining pediatric diarrhea in low-resource settings. J Pediatric Infect Dis Soc. 2017;6(3):289–93.
  45. G U, L S, S B. Vaccination Status and Factors Associated With It among Children Aged 12- 23 Months in Wadera District, South East Ethiopia. Heal Care Curr Rev. 2018;06(02):10–5.
  46. Tiwari S, Bharadva K, Yadav B, Malik S, Gangal P, Banapurmath CR, et al. Infant and young child feeding guidelines, 2016. Indian Pediatr. 2016;53(8):703–13.