DOI: https://doi.org/10.21203/rs.3.rs-96909/v1
Background: Seasonal activity patterns of mosquitoes are essential as baseline knowledge to understand the transmission dynamics of vector-borne diseases. This study was conducted to evaluate the monthly dynamics of the mosquito populations and their relation to meteorological factors in Mazandaran Province, north of Iran.
Methods: Mosquito adults and larvae were collected from 16 counties of Mazandaran Province using different sampling techniques, once a month from May to December 2014. “Index of Species Abundance” (ISA) along with “Standardized ISA” (SISA) was used for assessing the most abundant species of mosquitoes based on the explanations of Robert and Hsi. Pearson’s correlation coefficient (R) was used to assess the relationships between the monthly population fluctuations and meteorological variables.
Results: Overall, 23750 mosquitoes belonging to four genera and nineteen species were collected and identified. The highest population density of mosquitoes was in July and the lowest in May. The ISA/SISA indices showed the values of ISA/SISA: 1(larvae) and 1.25/0.973 (adult) in total catch human and shelter pit (ISA/SISA:1.68/0.938) for Culex pipiens and Culex tritaeniorhynchus, respectively, species that had the highest activity peak in July. A significant positive correlation was observed between Cx. tritaeniorhynchus and mean temperature (R: 0.766, P < 0.027).
Conclusions: The results indicated that the mosquitoes are more active in July, Cx. pipiens and Cx. tritaeniorhynchus were the most abundant species, due to the potential of these species as vectors of numerous pathogens, control programmes can be planed based on their monthly activity pattern in the area.
Mosquitoes are distributed almost all over the world, except a few islands and the Antarctica. [1]. since the earliest times, mosquito bites or habitats have been related with human diseases, and mosquitoes were the first arthropods formally convicted as intermediate hosts of vertebrate parasites in 1878 [2]. They are the most important arthropod taxon in Medical Entomology because of their nuisance and transmission of malaria, arboviral disease, microfilariae [3]. Mosquito-borne infectious diseases have been introduced as the most commonly transmitted diseases by vectors in terms of mortality, and disability-adjusted life years [4]. For example, malaria has a massive burden universally, an estimated number of cases of 219 million and 435000 death [5]. There was also approximately 96 million cases and 1091 deaths related to dengue globally. Albeit, the global burden of Zika, Chikungunya and West Nile is not as large as malaria and Dengue [4], but their impact on health system is high, especially as several large outbreaks of the diseases occurs every year and their transmission is extending to new areas [6–8].
Iran is in the perspective of eliminating of malaria by 2025. There were 57 cases of malaria, 55 of Plasmodium vivax, and 2 of P. falciparum in 2018 [5]. Malaria is one of the most important Anopheles-borne parasitic diseases in the world. Thirty species of Anopheles have been documented from Iran [9], of which, 7 species are in the Mazandaran Province [10]. Anopheles sacharovi, Anopheles maculipennis (s.l.), Anopheles fluviatilis s.l., Anopheles stephensi, Anopheles superpictus, Anopheles dthali, and Anopheles culicifacies s.l. are identified as the proven malaria vectors in Iran [11], while Anopheles pulcherrimus is stated as a suspected vector [12]. Recently, Anopheles hyrcanus and An. subpictus were revealed to be infected with Plasmodium based on molecular analysis in northern and southern Iran [13, 14]. Anopheles maculipennis s.l. and An. sacharovi are known to play an important role in transmission of malaria in the northern parts of the country [15].
Zika, dengue and chikungunya are arboviral diseases transmitted by Aedes mosquitoes, especially Ae. aegypti and Ae. albopictus. There are no reports of Zika virus in Iran, while imported cases of dengue [16–18] and chikungunya (personal communication with the Centers for Disease Control and Prevention, Iran) have lately been reported from the country. Aedes aegypti and Ae. albopictus are the main vectors of dengue, chikungunya and Zika, worldwide. Aedes aegypti had been reported in southern parts of Iran in 1920–1953 [19–21], however, it retreated to Saudi Arabia and Northern Africa since for no known reason. Recently only a few adults and larvae of Ae. albopictus has been observed in Sistan and Baluchitan Province, southeastern Iran [22].
Knowledge about the behavior of mosquitoes is very important in the epidemiology of disease transmission and vector control. Data on fluctuations of seasonal abundance of species can describe the relative risk of them in the transmission of diseases in human populations, and can also help in the implementation and design of proper control programms [23]. Environmental changes greatly affect the habitat of mosquito species [24]. Meteorological factors affect the population of mosquitoes by quantitative and qualitative changes on the larval habitat [24, 25]. The combination of mosquito behavior pattern (circadian rhythmicity) with climate factors makes an interaction for determining the timing/month/season of mosquito activities [26, 27]. Therefore, determining the seasonal prevalence of mosquito fauna in an area is crucial for the development of effective vector control programms and updating of ecological information related to vectors of diseases in the area [24, 28].
There were little published data on the seasonal abundance of mosquitoes in Iran [29–31]. Up to now, fauna, checklist, physicochemical factor of larval habitats, co-occurrence, association, affinity and biodiversity of mosquitoes have been studied in Mazandaran Province [10, 32–34], however, there is no recent comprehensive study on the seasonal activity of mosquitoes in the province. Therefore, this study was conducted to evaluate the monthly dynamics of the mosquito populations and their relation to climatic factors in Mazandaran Province.
Study area
Mazandaran Province is located on the coast of the Caspian Sea in northern Iran, in coordinate latitude 35°47′–36°35′N and longitude 50°34′–54°10′E between the Caspian Sea and the Alborz mountain range. The province is enclosed by Golestan Province in the east, Guilan Province in the west and Tehran and Semnan Provinces in the south and the Caspian Sea to the North. The diverse nature of the province included plains, grassland, forests and rainforest with an area of approximately 23,842 square kilometers and a population of approximately 3,073, 943. In the study area, the main agricultural products are rice, followed by wheat, barley, beans, fruits and vegetables. Vast Hyrcanian forests, temperate climate, abundant wetlands and rice fields in the province, provide enormous adequate habitats for the development of mosquitoes.
Specimen and data collection
Mosquitoes were collected from 30 villages in 16 counties from Mazandaran Province, in a uniform method, once a month from May to December 2014. In each county, two villages were randomly designated for sampling mosquitoes according to topography of areas. In each village, one fixed habitat was selected for collection of larvae. Larval collection was conduct by a standard 350 cc dipper for 15–20 min per natural and artificial breeding sites in fixed habitats. In the larval habitat, 10–30 dips were taken based on size of the breeding site. Samples were always taken by the same individual in the morning (0800–1200 hours) or afternoon (1400–1800 hours).
Adult mosquitoes were collected in eight places (three human and three animal fixed and one human and one animal variable places) between 0500 and 0800 hours in selected villages by methods of total catch. Before the spraying, all the eaves, windows, doors, and other exit points were closed and white cloth sheets were spread on the floor. After Pyrethrum spraying, the room was kept closed for 10 min and the knocked-down mosquitoes were then collected from the floor sheet.
Pit shelters (90 × 150 × 150 cm W × L × D) were dug in shady places in each village, then small cavities, about 30 cm deep were dug horizontally at each side, about 50 cm above the bottom of the pit. The collections of resting mosquitoes were carried out by aspirator from the walls of the pits between 0500 to 0600 hours.
CDC light traps (John W. Hock Company, Gainesville, FL) were set about 1.5-2m above the ground in human and animal dwellings in each village. Light traps were switched on at 1900 and switched off at 0600 hours local time. The mosquitoes were attracted to the light at night, and were arrived to funnel nets screen using the airflow generated by the fan motor.
Human-landing collections (two human baits and one collector) using mouth aspirators were performed for sampling of Aedes, between 0900 and 2100 hours during the daytime, in each village. Sampling team were stationed mostly between human and animal sites near appropriate larval habitats. The mosquitoes were collected at 1-hour intervals and were placed in paper cups relevant to the same hour.
The third and fourth instar larvae were preserved in lactophenol solution, adults were transferred to cups container with moist cotton, labeled and mounted [10]. The specimens were identified by direct observation of morphological characters using valid taxonomic keys [35].
The specimens are deposited at the Museum of Medical Entomology, School of Health, Mazandaran University of Medical Sciences, Sari, Iran. The abbreviations of mosquito genera and subgenera are cited by Reinert [36].
Meteorological data
Monthly meteorological variables containing mean temperature, rainfall were obtained from the synoptic station of Mazandaran Province Meteorological Organization in 2014.
Abundance Indices
“Index of Species Abundance” (ISA) was used to assess the most abundant species of mosquitoes in the province based on the explanations of Robert and Hsi [37] and a slight change in the formula. ISA is calculated by the following formula:
Where a is the number of sampling sites that the species not present in it, c is the highest rank of the species in sampling sites plus 1, and Rj is the sum of the rankings of each species in all sampling sites, K is the number of sampling sites.
“Standardized Index of Species Abundance” (SISA) was applied as a standardized formula for ISA by converting to a scale from zero to one with the following changes:
When SISA is closer to 1, it represents the most abundant species [38].
Statistical analysis
Statistical analysis was performed on data obtained from mosquito population density during the study to understand whether meteorological variables could be the cause of population fluctuations of mosquitoes in the study area. The data were calculated using SPSS Ver. 23. The relationships between monthly population fluctuations of mosquitoes with meteorological variables were evaluated by statistical test of “Pearson’s correlation coefficient (R)”.
Overall, 23,750 mosquitoes (7,566 larvae and 16,184 adults) belonging to two subfamilies, four genera and nineteen species were collected and identified throughout the year during this study. The subfamily Anophelinae was represented by one genus and 7 species, while the subfamily Culicinae was in 3 genera and 12 species. Monthly fluctuations in population dynamic of mosquitoes are displayed in Fig. 1 and Table 1 and 2. The highest total number of larvae (2,383) and adult (4,723) mosquitoes were observed in July and the lowest in May (Fig. 1).
Among the larvae, An. maculipennis s.l and Anopheles pseudopictus were collected during each month except May and December, respectively, while An. hyrcanus was observed only during June-October. The population density of Anopheles maculipennis s.l. reached its peak in June (n = 238). After June the population density of the species with an irregular fluctuation decreased rapidly and the lowest density was in September (n = 5). The highest population peak of An. hyrcanus was quite similar to that of An. maculipennis s.l, while it was in July for An. pseudopictus.
Culex pipiens and Culex torrentium was found from May to December. The largest population density of this species was observed in July (n = 1670) and June (n = 287) respectively. Culex tritaeniorhynchus was collected from May to November, with a major peak in July. Culex perexiguus and Culex mimeticus were almost non-active in the first and last seasons of the year and had the maximum number in July. Culiseta annulata and Culiseta longiareolata were almost absent during the warm seasons of the year and their highest activity peaks were recorded in October and November, respectively.
Anopheles marteri, Anopheles claviger and Culiseta morsitans were not found in adequate numbers to draw their monthly activity patterns (Table 1).
May |
June |
July |
August |
September |
October |
November |
December |
Total |
||||||||||
---|---|---|---|---|---|---|---|---|---|---|---|---|---|---|---|---|---|---|
Species |
No |
% |
No |
% |
No |
% |
No |
% |
No |
% |
No |
% |
No |
% |
No |
% |
No |
% |
An. claviger |
0 |
0 |
0 |
0 |
0 |
0 |
15 |
100 |
0 |
0 |
0 |
0 |
0 |
0 |
0 |
0 |
15 |
100 |
An. hyrcanus |
0 |
0 |
16 |
40 |
2 |
5 |
9 |
22.5 |
9 |
22.5 |
4 |
10 |
0 |
0 |
0 |
0 |
40 |
100 |
An. maculipennis s.l. |
0 |
0 |
181 |
47.14 |
80 |
20.83 |
30 |
7.81 |
5 |
1.30 |
14 |
3.64 |
64 |
16.67 |
10 |
2.60 |
384 |
100 |
An. pseudopictus |
0 |
0 |
11 |
7.14 |
61 |
39.61 |
13 |
8.44 |
35 |
22.73 |
19 |
12.34 |
15 |
9.74 |
0 |
0 |
154 |
100 |
An. marteri |
0 |
0 |
0 |
0 |
1 |
100 |
0 |
0 |
0 |
0 |
0 |
0 |
0 |
0 |
0 |
0 |
1 |
100 |
Cx. pipiens |
75 |
1.52 |
1197 |
24.27 |
1670 |
33.87 |
527 |
10.69 |
818 |
16.59 |
261 |
5.29 |
277 |
5.61 |
106 |
2.15 |
4931 |
100 |
Cx. torrentium |
1 |
0.16 |
287 |
46.22 |
154 |
24.8 |
20 |
3.22 |
17 |
2.74 |
76 |
12.24 |
53 |
8.53 |
13 |
2.09 |
621 |
100 |
Cx. tritaeniorhynchus |
2 |
0.27 |
4 |
0.53 |
324 |
43.32 |
139 |
18.58 |
213 |
28.48 |
58 |
7.75 |
8 |
1.07 |
0 |
0 |
748 |
100 |
Cx. perexiguus |
0 |
0 |
0 |
0 |
32 |
65.31 |
5 |
10.2 |
4 |
8.16 |
8 |
16.33 |
0 |
0 |
0 |
0 |
49 |
100 |
Cx. territans |
0 |
0 |
0 |
0 |
1 |
1.59 |
0 |
0 |
0 |
0 |
44 |
69.84 |
18 |
28.57 |
0 |
0 |
63 |
100 |
Cx. mimeticus |
1 |
1.19 |
0 |
0 |
54 |
64.29 |
22 |
26.19 |
1 |
1.19 |
6 |
7.14 |
0 |
0 |
0 |
0 |
84 |
100 |
Cx. hortensis |
1 |
20 |
0 |
0 |
0 |
0 |
0 |
0 |
4 |
80 |
0 |
0 |
0 |
0 |
0 |
0 |
5 |
100 |
Cs. annulata |
15 |
8.88 |
27 |
15.98 |
0 |
0 |
0 |
0 |
0 |
0 |
60 |
35.5 |
67 |
39.64 |
0 |
0 |
169 |
100 |
Cs. longiareolata |
0 |
0 |
89 |
29.57 |
4 |
1.33 |
0 |
0 |
0 |
0 |
119 |
39.53 |
80 |
26.58 |
9 |
2.99 |
301 |
100 |
Cs. morsitans |
0 |
0 |
0 |
0 |
0 |
0 |
0 |
0 |
0 |
0 |
0 |
0 |
0 |
0 |
1 |
100 |
1 |
100 |
Total |
95 |
1.26 |
1812 |
23.95 |
2383 |
31.5 |
780 |
10.31 |
1106 |
14.62 |
669 |
8.48 |
582 |
7.69 |
139 |
1.83 |
7566 |
100 |
Among the Adults, An. maculipennis s.l. was present almost throughout the year except for the cold months (December), the population dynamics of this species starts in May, reaching a major peak in June and then decreases gradually. The population density of An. hyrcanus begins to increase in May, reaching its greatest peak in June and after that, decreased. The species disappeared from monthly sampling in August, and was observed with the lowest population density again in September. Anopheles pseudopictus was recorded during June to November, its highest and lowest population peak was in July (n = 914) and November (n = 40), respectively. The density of An. claviger and An. sacharovi was peaked during August (n = 28) and July (n = 87), respectively.
Culex pipiens was successively found throughout the monthly sampling period with major peaks in July. Since July, the population of the species decreased gradually in August and September, then the activity increases and reaches the smaller peak in December. The population density of Cx. tritaeniorhynchus among the collected mosquitoes was high in July (n = 1868), it decreased in August (n = 1288), increased again to the smaller population peak in September (n = 1820), finally decreased progressively to the end of the season. Culex perexiguus, Aedes vexans and Cs. annulata had the most activity in June, October and November in the study area.
The rest of the species were collected in low numbers, so it was not possible to predict a proper pattern of monthly population fluctuations for them in the study area (Table 2).
May |
June |
July |
August |
September |
October |
November |
December |
|||||||||||
---|---|---|---|---|---|---|---|---|---|---|---|---|---|---|---|---|---|---|
Species |
No |
% |
No |
% |
No |
% |
No |
% |
No |
% |
No |
% |
No |
% |
No |
% |
No |
% |
An. claviger |
8 |
14.55 |
0 |
0 |
2 |
3.63 |
28 |
50.91 |
14 |
25.45 |
3 |
5.46 |
0 |
0 |
0 |
0 |
55 |
100 |
An. hyrcanus |
14 |
9.93 |
95 |
67.38 |
21 |
14.89 |
0 |
0 |
2 |
1.42 |
9 |
6.38 |
0 |
0 |
0 |
0 |
141 |
100 |
An. maculipennis s.l. |
20 |
1.12 |
889 |
49.72 |
652 |
36.47 |
148 |
8.28 |
44 |
2.46 |
31 |
1.73 |
4 |
0.22 |
0 |
0 |
1788 |
100 |
An. pseudopictus |
0 |
0 |
54 |
4.19 |
914 |
71.02 |
109 |
8.47 |
90 |
6.99 |
80 |
6.22 |
40 |
3.11 |
0 |
0 |
127 |
100 |
An. marteri |
2 |
100 |
0 |
0 |
0 |
0 |
0 |
0 |
0 |
0 |
0 |
0 |
0 |
0 |
0 |
0 |
2 |
100 |
An. sacharovi |
0 |
0 |
1 |
0.89 |
87 |
77.68 |
22 |
19.65 |
1 |
0.89 |
0 |
0 |
1 |
0.89 |
0 |
0 |
112 |
100 |
An. superpictus |
0 |
0 |
0 |
0 |
5 |
55.56 |
0 |
0 |
0 |
0 |
0 |
0 |
4 |
44.44 |
0 |
0 |
9 |
100 |
Cx. pipiens |
426 |
8.26 |
918 |
17.8 |
1134 |
21.99 |
612 |
11.87 |
285 |
5.53 |
420 |
8.14 |
562 |
10.9 |
800 |
15.51 |
5157 |
100 |
Cx. tritaeniorhynchus |
0 |
0 |
379 |
6.14 |
1868 |
30.26 |
1288 |
20.87 |
1820 |
29.48 |
607 |
9.84 |
210 |
3.40 |
1 |
0.01 |
6173 |
100 |
Cx. perexiguus |
23 |
25.56 |
47 |
52.22 |
15 |
16.67 |
0 |
0 |
0 |
0 |
5 |
5.55 |
0 |
0 |
0 |
0 |
90 |
100 |
Cx. mimeticus |
2 |
16.67 |
2 |
16.67 |
5 |
41.66 |
0 |
0 |
3 |
25 |
0 |
0 |
0 |
0 |
0 |
0 |
12 |
100 |
Cx. hortensis |
0 |
0 |
0 |
0 |
1 |
100 |
0 |
0 |
0 |
0 |
0 |
0 |
0 |
0 |
0 |
0 |
1 |
100 |
Ae. vexans |
5 |
0.39 |
0 |
0 |
11 |
0.87 |
9 |
0.71 |
4 |
0.31 |
1202 |
94.65 |
39 |
3.07 |
0 |
0 |
1270 |
100 |
Ae. caspius |
7 |
18.42 |
21 |
55.26 |
8 |
21.05 |
0 |
0 |
0 |
0 |
1 |
2.63 |
0 |
0 |
1 |
2.63 |
38 |
100 |
Cs. annulata |
1 |
2.04 |
0 |
0 |
0 |
0 |
2 |
4.08 |
0 |
0 |
2 |
4.08 |
44 |
89.8 |
0 |
0 |
49 |
100 |
Total |
508 |
3.14 |
2406 |
14.87 |
4723 |
29.18 |
2218 |
13.70 |
2263 |
13.98 |
2360 |
14.58 |
904 |
5.59 |
802 |
4.96 |
16184 |
100 |
The highest mean temperature and rainfall was observed during the months of August and October, respectively (Fig. 2). Bivariate Pearson’s correlation analyses of mosquito population density with meteorological variables exhibited that the population fluctuations of Culex territans (R = 0.855, P = 0.007), Cs. annulata (R = 0.711, P = 0.0048), Cs. longiareolata (R = 0.826, P = 0.011) and Ae. vexans (R = 0.831, P = 0.011) has significant positive correlation with rainfall in the study area. But no significant association was observed between other mosquito species and rainfall. The monthly temperature showed a significant positive correlation with the adult population fluctuations of Cx. tritaeniorhynchus (R = 0.766, P = 0.027). As for other species, the temperature were not seen as an important variable in population fluctuations in the study area (Table 3). The interaction between mosquito population fluctuations with mean monthly temperature and rainfall is shown in Fig. 2.
Species |
Temperature |
Rainfall |
|||
---|---|---|---|---|---|
Larvae |
R |
p-value |
R |
p-value |
|
An. claviger |
0.394 |
0.335 |
-0.374 |
0.361 |
|
An. hyrcanus |
0.630 |
0.094 |
-0.143 |
0.735 |
|
An. maculipennis s.l. |
0.236 |
0.574 |
0.001 |
0.998 |
|
An. pseudopictus |
0.548 |
0.159 |
-0.263 |
0.529 |
|
Cx. pipiens |
0.666 |
0.710 |
-0.364 |
0.379 |
|
Cx. torrentium |
0.314 |
0.449 |
0.136 |
0.747 |
|
Cx. tritaeniorhynchus |
0.667 |
0.071 |
-0.478 |
0.231 |
|
Cx. perexiguus |
0.441 |
0.274 |
-0.179 |
0.672 |
|
Cx. territans |
-0.260 |
0.534 |
0.855 |
0.007 |
|
Cx. mimeticus |
0.496 |
0.211 |
-0.350 |
0.395 |
|
Cs. annulata |
-0.400 |
0.326 |
0.711 |
0.048 |
|
Cs. longiareolata |
-0.238 |
0.571 |
0.826 |
0.011 |
|
Adult |
An. claviger |
0.570 |
0.140 |
-0.546 |
0.162 |
An. hyrcanus |
0.295 |
0.478 |
0.051 |
0.904 |
|
An. maculipennis s.l. |
0.489 |
0.218 |
-0.166 |
0.694 |
|
An. pseudopictus |
0.426 |
0.293 |
-0.289 |
0.488 |
|
An. sacharovi |
0.444 |
0.270 |
-0.379 |
0.354 |
|
Cx. pipiens |
0.060 |
0.887 |
-0.115 |
0.786 |
|
Cx. tritaeniorhynchus |
0.766 |
0.027 |
-0.475 |
0.234 |
|
Cx. perexiguus |
0.292 |
0.483 |
-0.48 |
0.911 |
|
Cx. mimeticus |
0.584 |
0.128 |
-0.523 |
0.183 |
|
Ae. vexans |
-0.086 |
0.840 |
0.831 |
0.011 |
|
Ae. caspius |
0.298 |
0.474 |
-0.066 |
0.877 |
|
Cs. annulata |
-0.475 |
0.235 |
0.140 |
0.741 |
The highest number and percentage of mosquitoes were collected by total catch in animal places (n:8051, 49.74%) followed by 16.82% using light trap, 14.87% by total catch in human places, 11.15% using shelter pit and 7.42% by day biting. Among the anophelinae, An. maculipennis s.l. (n: 1555, 86.97%) and An. pseudopictus (n: 680, 52.84%) were the most common in total catch of animal places and least in daily bites and shelter pit, respectively, while An. claviger and An. sacharovi were collected with the highest number and percentage using shelter pit sampling method. Among the culicinae, Cx. tritaeniorhynchus is more common than Cx. pipiens using total catch in animal place and light trap, whereas the species was observed with the lowest number and percentage by total catch in human places and shelter pit than Cx. pipiens. Aedes vexans were collected by all sampling methods, but the species was collected with the highest percentage up to 94.5% (n: 1200) in day biting. Further data on other species collected by each trap are shown in Table 4.
Sampling method |
Total catch human place |
Total catch animal place |
Shelter pit |
Light trap |
Daily biting |
Total |
||||||
---|---|---|---|---|---|---|---|---|---|---|---|---|
No |
% |
No |
% |
No |
% |
No |
% |
No |
% |
No |
% |
|
An. claviger |
11 |
20 |
20 |
36.36 |
24 |
43.64 |
0 |
0 |
0 |
0 |
55 |
100 |
An. hyrcanus |
7 |
4.97 |
89 |
63.12 |
2 |
1.42 |
44 |
31.21 |
0 |
0 |
141 |
100 |
An. maculipennis s.l. |
91 |
5.09 |
1555 |
86.97 |
41 |
2.29 |
101 |
5.65 |
0 |
0 |
1788 |
100 |
An. marteri |
0 |
0 |
2 |
100 |
0 |
0 |
0 |
0 |
0 |
0 |
2 |
100 |
An. pseudopictus |
88 |
6.84 |
680 |
52.84 |
81 |
6.30 |
438 |
34.03 |
0 |
0 |
1287 |
100 |
An. sacharovi |
0 |
0 |
2 |
1.78 |
108 |
96.44 |
2 |
1.78 |
0 |
0 |
112 |
100 |
An. superpictus |
0 |
0 |
9 |
100 |
0 |
0 |
0 |
0 |
0 |
0 |
9 |
100 |
Cx. pipiens |
1437 |
27.87 |
2225 |
43.14 |
870 |
16.87 |
625 |
12.12 |
0 |
0 |
5157 |
100 |
Cx. tritaeniorhynchus |
700 |
11.34 |
3371 |
54.60 |
621 |
10.06 |
1481 |
24 |
0 |
0 |
6173 |
100 |
Cx. perexiguus |
27 |
30 |
25 |
27.77 |
18 |
20 |
20 |
22.22 |
0 |
0 |
90 |
100 |
Cx. mimeticus |
1 |
8.33 |
10 |
83.33 |
0 |
0 |
1 |
8.33 |
0 |
0 |
12 |
100 |
Cx. hortensis |
0 |
0 |
1 |
100 |
0 |
0 |
0 |
0 |
0 |
0 |
1 |
100 |
Ae. vexans |
43 |
3.38 |
16 |
1.25 |
5 |
0.39 |
6 |
0.47 |
1200 |
9.54 |
1270 |
100 |
Ae. caspius |
0 |
0 |
13 |
34.21 |
24 |
63.15 |
0 |
0 |
1 |
2.63 |
38 |
100 |
Cs. annulata |
2 |
4.08 |
33 |
67.34 |
10 |
20.40 |
4 |
8.16 |
0 |
0 |
49 |
100 |
Total |
2407 |
14.87 |
8051 |
49.74 |
1804 |
43.64 |
2722 |
16.82 |
1201 |
7.42 |
16184 |
Based on Table 5, larvae of Cx. pipiens, Cx. torrentium and Cx. tritaeniorhynchus showed values of SISA 1(ISA = 1), 0.805(ISA = 3.62) and 0.564 (ISA = 6.87), respectively, whereas it was 0.550 (ISA = 7.06) for Anopheles maculipennis s.l. Among adult mosquitoes, the highest SISA (0.822, 0.637) and the lowest ISA (3.31, 5.71) were calculated for An. pseudopictus and An. maculipennis s.l. in total catch animal, respectively. SISA was 0.977 (ISA = 1.25), 0.946 (ISA = 1.594) and 0.933 (ISA = 1.87) in association with Cx. pipiens in total catch human, shelter pit and total catch animal, respectively. It was 0.938 (ISA = 1.68) in shelter pit, 0.938 (ISA = 1.69) in light trap, 0.913 (ISA = 2.125) in total catch animal and 0.886 (ISA = 2.25) in total catch human for Cx. tritaeniorhynchus.
Larvae |
Adult |
||||||||||||
---|---|---|---|---|---|---|---|---|---|---|---|---|---|
Total catch human |
Total catch animal |
Shelter pit |
Light trap |
Daily biting |
|||||||||
Species |
SISA |
ISA |
Species |
SISA |
ISA |
SISA |
ISA |
SISA |
ISA |
SISA |
ISA |
SISA |
ISA |
An. claviger |
0.000 |
24.06 |
An. claviger |
0.000 |
20.97 |
0.000 |
21.22 |
0.000 |
20.88 |
0.000 |
21.3 |
0.000 |
17.1 |
An. hyrcanus |
0.000 |
14.5 |
An. hyrcanus |
0.000 |
18.78 |
0.000 |
14.09 |
0.000 |
20 |
0.000 |
16.4 |
0.000 |
17.1 |
An. maculipennis s.l. |
0.550 |
7.06 |
An. maculipennis s.l. |
0.369 |
7.93 |
0.637 |
5.719 |
0.000 |
12.78 |
0.000 |
16 |
0.000 |
17.1 |
An. pseudopictus |
0.273 |
10.81 |
An. pseudopictus |
0.454 |
7 |
0.822 |
3.313 |
0.46 |
6.938 |
0.668 |
4.66 |
0.000 |
17.1 |
An. marteri |
0.000 |
24.5 |
An. marteri |
0.000 |
22.19 |
0.000 |
23.97 |
0.000 |
20.75 |
0.000 |
22 |
0.000 |
17.1 |
Cx. pipiens |
1 |
1 |
An. sacharovi |
0.000 |
22.19 |
0.000 |
23.94 |
0.000 |
20.69 |
0.000 |
19.8 |
0.000 |
17.1 |
Cx. torrentium |
0.805 |
3.62 |
An. superpictus |
0.000 |
22.19 |
0.000 |
22.44 |
0.000 |
22.06 |
0.000 |
22 |
0.000 |
17.1 |
Cx. tritaeniorhynchus |
0.564 |
6.87 |
Cx. pipiens |
0.977 |
1.25 |
0.933 |
1.87 |
0.946 |
1.59 |
0.696 |
4.34 |
0.000 |
17.1 |
Cx. perexiguus |
0.000 |
17 |
Cx. tritaeniorhynchus |
0.886 |
2.25 |
0.913 |
2.12 |
0.938 |
1.68 |
0.938 |
1.69 |
0.000 |
17.1 |
Cx. territans |
0.000 |
19.19 |
Cx. perexiguus |
0.000 |
17.53 |
0.000 |
18.03 |
0.000 |
20.78 |
0.000 |
20.6 |
0.000 |
17.1 |
Cx. mimeticus |
0.037 |
14 |
Cx. mimeticus |
0.000 |
21.13 |
0.000 |
19.19 |
0.000 |
22.06 |
0.000 |
20.9 |
0.000 |
17.1 |
Cx. hortensis |
0.000 |
21.69 |
Cx. hortensis |
0.000 |
22.19 |
0.000 |
23.94 |
0.000 |
22.06 |
0.000 |
22 |
0.000 |
17.1 |
Cs. annulata |
0.000 |
15.12 |
Ae. vexans |
0.000 |
19.75 |
0.000 |
22.63 |
0.000 |
19.78 |
0.000 |
19.8 |
0.1 |
9 |
Cs. longiareolata |
0.152 |
12.44 |
Ae. caspius |
0.000 |
22.19 |
0.000 |
23.69 |
0.000 |
19.66 |
0.000 |
22 |
0.000 |
16.1 |
Cs. morsitans |
0.000 |
22.69 |
Cs. annulata |
0.000 |
19.97 |
0.000 |
16.34 |
0.000 |
16.47 |
0.000 |
18.6 |
0.000 |
17.1 |
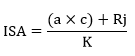
Demonstration of the monthly changes in the population abundance of mosquito species, along with meteorological parameters is crucial in understanding the biology of potential vector species for efficient mosquito control strategies. This is the first comprehensive study on this topic in Mazandaran Province, northern Iran using the ISA/SISA indices in the expression of the most abundant species.
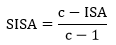
Vector abundance is a key determining factor that is often used as a risk indicator of vector-borne diseases. It is quantitatively more important than vector competence (although competence is a transmission requirement). It could explain the importance of abundant species in an area and why some vectors could contribute to epidemics without considering the competence for transmission [39, 40]. Culex pipiens is the most abundant species both in the larval and adult stages based on index of SISA/ISA in the present study. It was noted to be a common species in other studies in different parts of Iran [34, 41–44], but it should be mentioned that none of these researchers reported abundance of species based on the SISA/ISA index.
Although Culex pipiens was collected most frequently by total catch in animal places, it was the predominant species (based on index of SISA/ISA) in total catch in human places and shelter pit compared to other species, respectively. It indicates that the species tends to be attracted to humans, animals and also shows some extent of exophily in the study area. It is possible that humans come into contact with pathogens this species may carry. Such studies could establish baseline data for public health interventions in control programs, therefore, an assessment of different trapping methods is also required to adjust the design of future entomological and pathogen surveillance efforts [45]. The monthly activity of Cx. pipiens (larvae and adult) begins in mid-spring after diapause termination and reaches its largest peak in July and then declines again with an irregular fluctuations until the species disappears. It seems that the spring rains is a cause for the population of the species to peak in July, while no significant association was observed between Cx. pipiens and meteorological factors, probably high compatibility and access to diverse breeding places could help increasing population density of the species in early warm season. In contrast, Cx. pipiens was active from May to November and June to September [28, 46]. The population density of this species increased in July [46] and May to August [47], reaching its largest peak in August [46, 47]. Culex pipiens showed an increase in population density from May to July in north-eastern Croatia, then sharp decline occurred toward the end of the season [48]. In northern Italy, the species had maximum activity peak in July [49], that is almost consistent with the results of the present study.
There is not much data about the seasonal activity of culicine mosquitoes, especially in adult stage, in Iran [29]. The highest activity peak of Cx. pipiens was documented in mid-July in Guilan Province. There is no significant correlation between species population density and the meteorological data [29], which is in accordance with our research. Variations in the seasonal patterns of the species in this study and findings in other regions probably can be due to differences in the topography and climates.
Culex pipiens with its ornithophilic behavior and opportunistic feeder that bites both humans and animals, can be as bridge vector between birds and humans so is believed to be the principal vector of West Nile Virus [50]. It also shows an important role in transmission of several human pathogens including St. Louis encephalitis virus (SLEV), filarial worms as well as wildlife pathogens such as avian malaria [51]. The existence of swamps for migrating birds and their active presence throughout the Autumn and Winter in the province, detection of virus in the species in Guilan Province [52], can cause a concern for entry and the spread of the virus in the region.
Culex tritaeniorhynchus, the second most abundant species based on index of SISA/ISA in the study area, was first collected in May (larval stage) and June (adult stage), increased sharply in July, becoming the most abundant species, and displayed a rapid decline in December. The abundant species shifted from Cx. tritaeniorhynchus to Cx. pipiens in November, probably it could be due to high adaptability of Cx. pipiens to the environmental conditions in the area. In contrast, this species showed the highest peak of activity in August in Belek Region of Turkey [28]. While the peak of activity was observed in July in Guilan Province [29], which is in agreement with our study.
Culex tritaeniorhynchus is caught with the highest number by total catch in animal places which reflects the zoophilic tendencies of the species in the study area. Based on the results of a study in India, it is considered to be predominantly exophilic and normally zoophilic [53]. It was recorded to be the most abundant species in numerous studies in Iran, without reporting any SISA/ISA index [32, 33, 43, 54].
Culex tritaeniorhynchus is the primary vector of Japanese encephalitis (JE) in southern Asia. It has also been observed infected with dengue, Rift Valley fever, Sindbis, Getah and Tembusu viruses, and microfilariae of both Brugia malayi and Wuchereria bancrofti, in many areas of eastern and southeastern Asia [55]. The species is a principle vector of Rift Valley fever in Saudi Arabia [56], WNV in Asia [9] and a possible vector of Japanese encephalitis in Iran and Iraq [57], which indicates a high risk species for human health.
Among the Anopheles, An. maculipennis s.l. is numerically the most abundant species in the present study, mostly sampled by total catch methods in animal places, displayed to be predominantly zoophilic. This is consistent with other studies, but there is no evidence of SISA/ISA indexes to express the most abundant species in these studies. [42, 58–60]. What is interesting is that, despite having the highest numerical abundance of species, An. pseudopictus was calculated as the most abundant species in all sampling methods (except daily bites) based on ISA/SISA index. In addition, An. sacharovi also had the highest numerical abundance in the Shelter Pit, but it was not considered as the most abundant species based on the index of SISA/ISA.
Moreover, An. sacharovi had also the most abundant species in the shelter pit, but, it with regards to its high numerical abundance. Therefore, this shows the importance of species distribution at different sites and computational value of the index ISA/SISA Anopheles maculipennis s.l. is known to be the most important malaria vector in northern and western parts and the central plateau of Iran [61]. Moreover, there is a belief that this species can play a vector role in WNV transmission in various countries of the old world [62, 63]. Recently, the myxoma virus genome was detected in wild caught An. maculipennis that fed on wild rabbits by polymerase chain reaction (PCR) in Southern England, UK. Batai virus (BATV) and Anopheles associated C virus (AACV) was also identified and isolated from Anopheles maculipennis complex in entomological surveys in Germany, Italy and France [64]. With regards to the malaria historical records and WNV in the northern parts of Iran [52, 65], understanding the population dynamics and the maximum monthly peaks of the species is important in controlling the diseases in the study area.
The highest monthly activity peak of An. maculipennis (larvae and adult) is in June. In contrary to our results, An. maculipennis s.l. showed the highest peak of activity in the mid-July in Guilan [29] and July–August in Kalaleh County of Golestan Province [30], northern Iran. In neighboring Turkey, the species peaked in August and July–August [66, 67]. These differences in population patterns could possibly be due to regional ecological differences. On the other hand, some researchers believe that these discrepancy might also be due to the low collection effort involved in the studies [26] or sampling regimes [28, 29, 49, 66, 67].
Climate change and the environment affect the abundance and distribution of vectors and their intermediate hosts [68]. In the present study, monthly population fluctuations of Cs. annulata, Cs. longiareolata and Ae. vexans are correlated with rainfall. Although these species showed irregular monthly population fluctuations, they were more active in spring and autumn. Culiseta annulata had a major peak in November [28], which is in accordance with our research. On the other hand, Cs. longiareolata was active in July and September [66], whereas in the present study, the species had the largest peak in October, which is quite similar to that of Ae. vexans.
The largest peak of Ae. vexans was reported in June [66] and August [67].There are evidence that Ae. vexans and Cs. annulata are important vectors of WNV [69, 70]. Among the Aidini tribe, Aedes vexans is recorded to be the most abundant species based on ISA/SISA index. It was caught in all traps and is the most abundant collected species in day biting compared with other species, and shows anthropophilic tendencies in the study areas. This species demonstrated high prevalence and collected by day biting in other studies performed in different parts of Iran [58, 71–73], this may be a reflection of the fact that this method has a high level of efficiency for collecting this species. However, to observe ethical values, this collection methods cannot be used freely and with extended time and should in fact be restricted or modified in compliance with ethical standards [74].
The species is known to be the main vector of Tahyna virus in central Europe [75], potential vector of the dog heartworm Dirofilaria immitis in Europe [76] and principal vectors of Rift Valley fever in Saudi Arabia [56]. Recently, Zika virus is revealed in the salivary glands of the field-caught Ae. vexans [77]. It is a flood water mosquitoes, so, their population abundance depends on the water dynamics of temporary pools [26]. Rainfall as an important climatic factor may have a range of different correlation with the population of the species, from positive, negative and/or ineffective and sometimes with a lag phase [78] a significant positive correlation between its monthly activity and rainfall was observed in our study. The current study was not designed and aimed to address the analysis of lag time between climate factors and population density of the species, however, it seems that there is probably a lag time of at least 15 days after rain at the beginning of the rainy season before the Ae. vexans population jump start. In concordant with our findings, there is a lag time of at least 15 days between the peak of rainfall and abundance of the species [79–81]. Moreover, other studies have revealed a correlation between rainfall and the abundance of species with a 10-day lag in the early rainy season and 20 days after the end of the rainy season [82]. In the study of Diallo et al. [81] rainfall patterns displayed that heavy rains between August and September 2005 had negatively impacted on the population density of Ae. vexans, whereas in 2006, population peak was observed following the rainfall peak. These findings show the complexity of the relationship between climate factors and population density of mosquitoes. Therefore, it is recommended to measure the seasonal activities of species over multiple years, to show a better understanding of the correlation between population frequency and climatic factors, and the impact of other variables.
The highest number and population density of Ae. vexans was found during early autumn, especially in October. Vector-borne diseases show seasonal patterns with inter and intra-annual variability, which are partly described by climate and environmental factors [79]. Therefore, these results are important for health authorities in controlling mosquitoes as well as in the tourism industry for nuisance control, but more importantly, it provides a detailed estimate of the timing of risk for human populations.
Based on ISA/SISA indices, July in which Cx. pipiens and Cx. tritaeniorhynchus have the highest population peak, is the most crucial time for efficient mosquito control programme in the area study.
Acknowledgment
We would like to thank the staff of Mazandaran Provincial Health Deputy for their direct help in the field sampling, also we express our appreciation to the people of the villages for their kind assistance with the sampling teams during the study.
Funding
The study was supported by the Deputy for Research and Technology of Mazandaran University of Medical Sciences, Mazandaran, Iran by grant No. 93–1017.
Availability of supporting data
Not applicable.
Authors ‘contributions
SHN implemented fieldwork, the data collection, interpreted the results, and drafted and wrote the paper. MFD analyzed the data. AAE revised original draft, is a supervisor and project manager, received research funding. All the authors approve the final version of the article.
Ethics approval and consent to participate
Not applicable.
Consent for publication
Not applicable.
Competing interests
All authors declare no conflicts of interest.