Epidemics and Networks: A Social Network Analysis of the Spread of COVID-19 in South Korea and Policy Implications

DOI: https://doi.org/10.21203/rs.3.rs-98644/v1

Abstract

This study estimates the COVID-19 infection network from actual data and draws on implications for policy and research. Using contact tracing information of 3,283 confirmed patients in Seoul metropolitan areas from Jan 20 to July 19, 2020, this study creates an infection network and analyzes its structural characteristics. The main results are as follows: (1) out-degrees follow an extremely positively skewed distribution, and (2) removing the top nodes on the out-degree significantly decreases the size of the infection network. (3) The indicators, which express the infectious power of the network, change according to governmental measures. Efforts to collect network data and analyze network structures are urgently required for the efficiency of governmental responses to COVID-19. Implications for better use of a metric such as R0 to estimate infection spread are also discussed.

1. Introduction


The spread of infectious diseases is determined by two factors: the physical and chemical characteristics of the virus, and the social network that defines the structure of contact among people. Humans are not just hosts for viruses. They are actively involved in social contact with others and, as a result, spread the viruses to not just anyone but more or less socially predictable subjects. How humans form social networks affects the overall state and structure of the spread of infection. The current article focuses on this second aspect, that is, social networks. We measure the out-degree distribution of the COVID-19 transmission network in South Korea and predict its function, which allows us to examine the implications of transmission network information in terms of policy responses to COVID-19, and provides a better-informed interpretation of the various reproduction numbers.

Although it is widely known that the characteristics of virus transmission networks are an important determinant of the size and condition of outbreaks, such evidence has been highly limited in policy-making and research on COVID-19, making it challenging to implement evidence-based policies for transmission networks. Social distancing is one such example. Despite the fact that there are local structures for the whole transmission network that disproportionately contribute to the spread of infection, social distancing policies recommend or enforce decreased contact among all members of society, equally. Because this recommendation is not based on scientific analysis of the spread network, the policy may be considered less than efficient or effective.

This lack of scientific examination of transmission networks also limits the interpretation of major indicators of infection, which may lead to inefficient and/or ineffective policies. One important example is the calculation and interpretation of various reproduction numbers (e.g., R, R0). R is an indicator on which governmental authorities heavily rely on to determine the current state and future risks of viral infection transmission for quarantine and isolation however, an estimation process of this indicator suggests that it does not evaluate network structural characteristics of viral transmission, such as skewness of contact opportunities, thus leading to occasional failures in providing reliable information, which is important for decision-making on resource distribution to control the outbreak.

R is the product of the transmission rate (infection-producing contacts per unit time) and infectious period. To obtain each item, for example a transmission rate, we assume a model for the infection process (e.g., SIR, SEIHR) and estimate the model's parameters using the number of people at each stage and the rate at which that number increases and decreases. The transmission rate is one of these estimated model parameters [1]. This type of estimation assumes that the transmission rate is determined by the proportion of people at each stage, its rate of increase and decrease, and the rest of the parameters (isolation rate, recovery rate, etc.), which overlook the impact of the transmission network structure. However, the transmission network structure can affect transmission rates. Even if the proportion of people in each stage and the other parameters are the same, the transmission rate may vary depending on the infection network structure to which people belong.

Meyer et al.’s research is a good example of the impact of network structure. Meyer et al. pointed out that outbreaks under the same R0 (basic reproduction number) can be very different depending on the distribution of out-degrees, the latter meaning the number of transmissions made by each infected person [2]. They compared power-law distributions, the extreme right-skewed distributions often observed in network measures to more moderate Poisson distributions. Though they are expressed by the same R0, the outbreak becomes much more serious if the out-degree follows a Poisson distribution. In contrast, the outbreak may not be as serious if the out-degree follows a power-law distribution because it is likely that a very small number of super-spreaders leads us to overestimate patient increasing rate and R0. By the same logic, the same R0 under a Poisson distribution might suggest that the virus has spread more evenly to the overall population. This result implies that the interpretation of R0, without considering the characteristics of transmission networks, might be incomplete.

The effect of transmission networks on the spread of infection is only theoretically acknowledged, while scientific evidence is absent from current COVID-19 policies. We are not the first to point this out. Existing research has raised the same concerns. However, most existing research relies on hypothetical data, which is understandable given the scarcity of empirical transmission networks [3,4]. However, we suggest that it is strongly recommended to collect and analyze empirical network data if we want COVID-19 policy to closely reflect the realities and feasibility between cost and benefit.

The case of South Korea provides an interesting venue for this research for two reasons. First, transmission data exists in South Korea. The Infectious Disease Control and Prevention Act (in Korean, 감염병의 예방 및 관리에 관한 법률) mandates disclosure of information about confirmed patients, including “movement paths, transportation means, medical treatment institutions, and contacts of patients with the infectious disease.”[5] In compliance with this law, information on the routes of infection has been consistently collected from the initial stage and publicly disclosed on local government websites. By collecting and combining these pieces of information, we can construct the whole network data for the spread of COVID-19 in South Korea.

Second, South Korea has thus far controlled COVID-19 without relying on shutdowns or mobility restrictions. This allows us to evaluate the structural characteristics and their impact on transmission, while less distorted by policy measures that affect naturally existing social ties. We derive several network indicators and their distributions for real transmission data from South Korea, thereby seeking possibilities for improving the efficiency and efficacy of the current policies to curb the COVID-19 outbreak.

More specifically, we attempt to answer the following research questions:

  1. What are the characteristics of the COVID-19 transmission network in South Korea?
  2. What are the implications of the distribution of the COVID-19 transmission network index in South Korea from policy and research perspectives?

2. Materials And Methods

Data

Our data provide information on those infected and the route of infection of each patient made publicly accessible by the Seoul, Gyeonggi-do, and Incheon local governments in South Korea. Because these three municipalities comprise the Seoul metropolitan area, our data show the situation in the capital region of South Korea. Most of the COVID-19 infections in South Korea occurred in the Seoul metropolitan area and in Daegu and Gyeongsanbuk-do. However, since infections in Daegu and Gyeongsangbuk-do occurred rapidly in the early period (February and March), and the government was not well prepared for gathering data, there is a lack of data on the regions’ route of infection.

Although webpages containing publicly accessible information differ across local governments, the items commonly disclosed are the confirmation identification number, infection routes, date of confirmation for COVID-19 positivity, and the hospital where the infected person is being treated.

We paid particular attention to the route of infection, which comprises a record of key contacts in the infection process identified by the local government and health authorities. This record contains both people and events. If a patient number is recorded as a route of infection for a particular patient, the most perfectly specified is the source of infection. However, if a mass infection occurs in a confined space or a person has returned from a foreign country and is found to be a patient, it is difficult to know who infected whom. In this case, the name of the event or place is recorded instead of the patient number. In other words, the record of the infection route is data that allows us to build infection networks, at least in a limited form.

The specific data collection process is as follows. We created a scraping program that automatically collects relevant information from three local government websites. Because information is presented across many pages, it is difficult for human researchers to collect information individually. After the data were collected using this program, we converted the raw data into structured network data. First, we extracted the link information, and formed a network of infections between individuals. Individuals are nodes, and links are the infection relationships between them. If another patient is identified in the infection path of one patient, a connection between them is assumed. Simultaneously, two properties of all nodes were extracted and recorded: the confirmed date of each patient and the category of the infection path. Infection path categories describe whether an individual patient's path to infection falls under <Personal>, <Group>, <Overseas>, or <Unknown>. In many cases, events or groups are listed on the infection path information page of individual patients. For example, “Patient No. 2000 was infected via a mass infection in Itaewon” and was recorded on the local government's homepage. In this case, the link information cannot be identified because no interpersonal infection information exists. This person's infection path is categorized into <Group>. <Personal> means that a specific patient infected the patient, <Overseas> means a person was infected from abroad, and <Unknown> is a case where the route of infection is unknown.

Finally, our infection network data consisted of patients in the Seoul metropolitan area from January 20 to July 19. The network consists of 3,283 nodes and 1,005 links. Links have direction because infection has direction. The frequency of the node infection path category is as follow: <Personal>: 972, <Group>: 869, <Overseas>: 748, <Unknown>: 694.

Method

We applied three main methods of analysis: network analysis, hypothesis tests on the distributions of network indicators, and virtual structural changes in the network.

First, network analysis refers to calculating various network indicators to obtain previously overlooked structural information. We have paid particular attention to the out-degree of each node that constitutes the Korean COVID-19 infection network, mean distance of the network, and diameter of the network. The key to managing infectious diseases is to reduce people’s contagion power. From the perspective of network science, this information is expressed through three indicators. One is the out-degree of each node, which means how many direct infections the node has produced. The second is the mean distance of a network, which refers to the average path length between all node pairs in the network. We can interpret the mean distance of an infection network as the average potential range of infection. The third is the diameter, which is the length of the longest geodesic in a network. In the context of infectious disease, diameter shows the most extended “Nth transmission” in the network. See Figure 1 for the intuitive meaning of each indicator. We tried to measure the infectivity of the nodes and the infection network using these three indicators. In particular, the mean distance and diameter are indicators based on the whole network. By analyzing how the two indicators change, depending on time and policy, we identified what changes in the whole network structure are observed depending on time and policy implementation.

Figure 1. A small directed network

Second, we conducted several hypothesis tests on the out-degree distribution to determine the features of the distribution. If an out-degree can be a way of measuring the infectious power of nodes, the features of the distributions of out-degrees are also important. That is, health policies should be determined based on the characteristics of the distribution. As Meyer et al. pointed out, the infection status of a society could be different depending on the out-degree distribution [2]. Beyond infection networks, network science has long pointed out that the distribution of degree in many networks contains special features. The discussion and debate on scale-free networks and power law initiated by Barabasi is representative [6,7]. If out-degree follows the power law, it is not helpful to count on the central tendency, such as the mean of out-degree, which results in rethinking many health policies based on the average trend.

We tested whether the out-degree in the COVID-19 network of South Korea follows the power law. To this end, we followed the procedure proposed by Clauset et al. [8]. First, we estimated the parameters of the power-law distribution, assuming that the out-degrees of nodes were based on the power-law distribution. Then, using bootstrap, we calculated the distances between the 3,000 sets of data generated from the estimated distribution and the distribution itself. The 3,000 distance values represent random fluctuations that the data would show when they follow the power-law distribution. Then, we compared the distances with the distance between our actual data and the estimated power-law distribution. This determines how many times the distances based on simulated data are farther than the distance between our real data and the estimated distribution. Using the results, we analyzed whether the null hypothesis that the out-degrees of nodes follow the power law could be rejected. The Kolmogorov–Smirnov statistic was used to calculate the distance. Finally, the explanatory power of the power-law distribution was compared with other distributions, which could be an alternative model for fitting a heavy-tailed distribution.

Third, the virtual structural changes in the network were used to estimate the expected effects of network-based health policies. If the health authorities had the network information perfectly, they would have controlled the most infectious node first in the overall infection network. If successful, it would have had the effect of isolating and eliminating the nodes in the measured infection network. We observed how the overall structure of the infection network and related indicators changed by removing the top 1% or 5% nodes on the out-degree. This gives us an idea of the expected effect of health policies using network information.

All the analyses explained above were performed using R [9] and its packages, including the following: “tidyverse” [10] (for data wrangling and visualization), “igraph” [11] (for network analysis), “lubridate” [12] (for handling date), “ggraph” [13] (for visualization), “slam” [14] (for data wrangling), and “PoweRlaw” [15] (for analyzing power law).

Seoul National University Institutional Review Board approved this study (IRB No. E2009/003-001, Results of review: Exemption).

3. Results

Power law hypothesis test on the out-degree distribution of a node

We analyzed the characteristics of the out-degree distribution of nodes to identify the features of the COVID-19 infection network in South Korea. The out-degrees were calculated considering the link direction [16].

First, the out-degree distribution of all nodes is presented in Figure 2. The pattern of the graph shows a model of distribution with heavy tails.

Figure 2. A histogram of out-degree

We estimated the parameter of a power-law distribution using the poweRlaw library in R, according to the method proposed by Clauset, assuming our data follow a power-law distribution. As a result, out-degrees with values higher than two were estimated to follow the power-law distribution of the following formula (x: out-degree).

Figure 3 presents a log-log plot of out-degree.

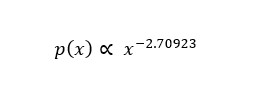
Figure 3. A log-log plot of out-degree

Comparing the distance between the estimated distribution and the 3,000 sampled data from the distribution with the distance between the estimated distribution and our actual data, we could not reject the hypothesis that our data follow a power-law distribution. The P-value was 0.610333, meaning that the distances between 61.03% sets of sampling data and the estimated model were farther than the distance between our actual data and the model.

Finally, we tested the significance of the distance difference between the three alternative distributions and power-law distribution after estimating the parameters of each distribution based on our data: log-normal distribution, exponential distribution, and Poisson distribution. We used Vuong’s likelihood ratio test for this process [17]. The results showed that the power-law distribution had much better explanatory power than the exponential and Poisson distributions. However, the difference in goodness of fit between the power-law and log-normal distribution was indistinguishable. Specific results for each test are shown in Table 1.

Table 1. Vuong's likelihood ratio test.


p-value

Power-law vs log-normal

0.6398939

Power-law vs exponential

0.006273197

Power-law vs Poisson

0.009079904


Network structure change depending on time and policy

We analyzed how the network structure changed in accordance with the main policy changes in Korea. Considering Korea’s main quarantine policy, the entire period can be divided into three stages: 1) Early stage (01/20/2020–03/21/2020); 2) social distancing stage (03/22/2020–05/05/2020); and 3) distancing in usual life stage (05/06/2020–7/19/2020).

We measured four indicators for each stage. Two of them are the mean distance and diameter, which were explained in the methods section. The other two are the number of human nodes and the number of links. The first is said to be the number of confirmed patients that make up the infection network at that time, and the latter is the number of infections that occurred at that time. The results are presented in Table 2.

Table 2. Network indicators by period.

Period

Number of human nodes

Number of links

Mean distance of the network

Diameter

Early-stage period

691

250

1.447300771

6

Social distancing period

718

133

1.204968944

3

Distancing in the usual life period

1856

520

1.465359477

5


It is noteworthy that the mean distance and diameter decreased significantly during the period of social distancing.

The effect of deleting crucial nodes

We analyzed how the overall network structure and key indicators change when important nodes are deleted to anticipate the effects of policies utilizing network information. To this end, we measured several indicators by removing the 32 nodes corresponding to the top 1% and the 164 nodes corresponding to the top 5% based on out-degree. Measured indicators are the four previously utilized indicators. The results are presented in Table 3:

Table 3. Network indicator by removing nodes.

Network

Number of human nodes

Number of links

Mean distance of the network

Diameter

Whole network

3283

1005

1.439620081

7

Removing the top 1%

2786

510

1.350299401

7

Removing the top 5%

2383

180

1.086734694

3


When the top 1% nodes were deleted, the number of confirmed patients in the network decreased by more than 15%, and by more than 27% when the top 5% were deleted. Figure 4, Figure 5, and Figure 6 present the results of visualizing each network.

4. Discussion

The results of our study are summarized as follows: First, the distribution of out-degrees follows an extremely positive skewed distribution. Second, removing nodes in the top 1% and 5% of the out-degrees dramatically reduces the number of patients in the network and multiple distance indicators. Third, existing policies had a changing effect on the infection network structure. During the social distancing period, the mean distance and diameter of the infection network were significantly reduced.

This study has three main implications. First, it indicates the importance of interpreting network indicators to analyze the key infection indicators currently utilized. For example, various reproducibility indices (R) do not take into account network structural effects. However, the network structure can affect the rate of increase in the number of infected persons or the transmission rate. If the distribution of out-degrees is an extremely positive skewed distribution, as we have revealed in the actual infection network data in Korea, the basic reproduction index may overestimate the actual risks. Therefore, considering various network and infection indicators together allows for evidence-based decision making on COVID-19 policy.

Second, the study suggests that by analyzing various network indicators and their distributions, quarantine authorities can make their policies more feasible. If the degree distribution of infection networks is an extremely positive skewed distribution, as our current data show, screening and managing nodes with high infection potential may be more efficient than interventions targeting the entire population. This is evidenced by the significant effect of the virtual deletion of the top 1% and 5% nodes from our data. Conversely, if the distribution of network indicators is close to a normal distribution, comprehensive policies targeting the entire population may be useful. Furthermore, this study demonstrates how the various network indicators related to infectious forces vary depending upon the significant policies already in place. It means network indicators can supplement existing indicators in measuring the effectiveness of quarantine policies.

Third, our study suggests that contact tracing is as important as testing for COVID-19 infection and that we need to invest more resources. Our data, summarized in subsection <Data>, indicates that the infection path investigation is relatively insufficient compared to the infection itself. The <Unknown> or <Group> categories account for a vast proportion. However, as we have seen, one neglected patient can produce a massive number of patients. The positively skewed out-degree distribution proves this. In order to curb the number of patients in the right tail, it is necessary to track the infected person's contact path as much as possible. In short, it is necessary to invest resources to improve contact tracing capacity, as much as the ability to check for infections.

This study has some limitations. Above all, there are limitations to the data. The data we use is missing information from Daegu and Gyeongsangbuk-do, which has produced many patients. In addition, our data, based on government announcements, inevitably underestimate links between individuals. For example, suppose a patient is infected from a group infection. In that case, it can be assumed that a specific individual existed in the patient's infection path in reality. However, the data could not find this other individual who infected the patient.

However, perfect data cannot be found. Furthermore, if data from Daegu and Gyeongsangbuk-do are secured, and the infection path data including interpersonal infection network is complete, it is likely to support the conclusion of this study more strongly by expanding the interpersonal link much more than it is now. This is because group infections are likely to include super-spreaders, that is, high out-degree nodes. It is assumed that significant events in Daegu will also be the same. In sum, this study utilizes actual data, providing limited but meaningful results.

Data availability

The data is publicly available via https://www.seoul.go.kr/coronaV/coronaStatus.do (Seoul), https://www.gg.go.kr/bbs/board.do?bsIdx=722&menuId=2903#page=1 (Gyeonggi), https://www.incheon.go.kr/health/HE020409 (Incheon)

References


  1. Choi S, Ki M. Estimating the reproductive number and the outbreak size of COVID-19 in Korea. Epidemiol Health. 2020;42:e2020011.
  2. Meyers LA, Pourbohloul B, Newman ME, Skowronski DM, Brunham RC. Network theory and SARS: predicting outbreak diversity. J Theor Biol. 2005 Jan 7;232(1):71-81.
  3. St-Onge G, Thibeault V, Allard A, Dubé LJ, Hébert-Dufresne L. School closures, event cancellations, and the mesoscopic localization of epidemics in networks with higher-order structure. arXiv preprint arXiv:200305924. 2020.
  4. Block P, Hoffman M, Raabe IJ, Dowd JB, Rahal C, Kashyap R, et al. Social network-based distancing strategies to flatten the COVID-19 curve in a post-lockdown world. Nat Hum Behav. 2020 Jun;4(6):588-96.
  5. Republic of Korea. Infectious disease control and prevention act. 2020.
  6. Newman M, Barabasi A-L, Watts DJ. The structure and dynamics of networks: Princeton University Press; 2011.
  7. Barabási A-L. Network science: Cambridge university press; 2016.
  8. Clauset A, Shalizi CR, Newman MEJSr. Power-law distributions in empirical data. 2009;51(4):661-703.
  9. R Core Team. R: A Language and Environment for Statistical Computing. Vienna, Austria: R Foundation for Statistical Computing; 2020.
  10. Wickham H, Averick M, Bryan J, Chang W, McGowan LDA, Francois R, et al. Welcome to the tidyverse. Journal of Open Source Software. 2019;4(43):1686.
  11. Csardi G, Nepusz T. The igraph software package for complex network research. InterJournal. 2006;Complex Systems:1695.
  12. Grolemund G, Wickham H. Dates and times made easy with lubridate. Journal of Statistical Software. 2011;40(3):1-25.
  13. Pedersen TL. ggraph: An Implementation of Grammar of Graphics for Graphs and Networks. 2020.
  14. Hornik K, Meyer D, Buchta C. slam: Sparse Lightweight Arrays and Matrices. R package version 0.1-47 ed; 2019.
  15. Gillespie CS. Fitting Heavy Tailed Distributions: The poweRlaw Package. Journal of Statistical Software. 2015;64(2):1-16.
  16. Wasserman S, Faust K. Social network analysis: Methods and applications: Cambridge university press; 1994.
  17. Vuong QH. Likelihood Ratio Tests for Model Selection and Non-Nested Hypotheses. Econometrica. 1989;57(2):307-33.


Declarations

Author contributions

WJ: conceptualization, data analysis, result interpretation, and writing manuscript. DC: conceptualization, result interpretation, supervision, and writing manuscript. MY: conceptualization, result interpretation, and writing manuscript. GG: conceptualization, data acquisition, data analysis, and result interpretation

Competing interests

The authors declare no competing interests.

Funding

The authors received no specific funding for this work.