Effects of Short Term Omega-3 Supplementation on Body Composition, Food Intake, and Lipid Profile in Elite Athletes: A Double-blind Randomized Controlled Trial

DOI: https://doi.org/10.21203/rs.3.rs-98846/v1

Abstract

Background and Aims: animal studies consistently showed a key role for omega-3s in decreasing fat mass (FM). Also, previous studies have shown that increased omega-3 stimulates fat loss in individuals who experience obesity, diabetes and metabolic syndrome. However, it is not known whether omega-3 supplementation make similar effects in healthy individuals with low FM. This study aimed to investigate the effects of omega-3 on changes in body composition, food intake, and lipid profile in healthy athletes.

Methods: 36 healthy men were allocated into either the supplement or the placebo group. Dietary intake assessed by the 24-hour food recall, before and after the intervention. Anthropometric measures, blood pressure, and lipid profile were measured at baseline and after 3-weeks.

Results: The weight did not significantly change at the end of the study. Body fat percent decreased significantly at the end of the study in the omega-3 group (p= 0.003), but intergroup differences were not significant. FM decreased but fat free mass (FFM) increased in omega-3 groups (p<0.05). In Lipid profile indices just HDL-C increased (for omega-3 group p=0.001; for placebo group p=0.01; after adjustments p=0.78). Also, in the omega-3 group, energy intake (p=0.0007) and protein intake (p=0.04) after intervention increased, but after baseline adjustments they were not significant.

Conclusion: 3-week omega-3 supplementation seems to be not effective in decreased FM, and increased HDL-C, and energy and protein intake in elite athletes. Further studies are recommended to determine the effect of different doses of omega-3 on adipose tissue in athletes with low FM.

Clinical Trial Registration The present study was prospectively registered at the Iranian Registry of Clinical Studies on December 19, 2019 (ID: 20190625044008N1). https://en.irct.ir/trial/43332.

Background And Aims

Nutritional supplements improve health indicators in the general population and especially in athletes. According to the International Olympic Committee, athletes use dietary supplements for various reasons such as remain in good health, intake of specific nutrients that is beneficial for their sports, replacement of micro and macronutrient deficiencies, and provide the energy balance that might be difficult to achieve through food intake alone[1]. One of these nutritional supplements that widely used in recent years are omega-3 fatty acids that claimed to be useful for accelerate recovery, decreased appetite, change the expression of metabolic-related  genes, increased muscle protein synthesis, and decreased fat mass (FM) [1-3].

Many studies showed nutrients have a direct effect on body composition [4-7]. As body fat percentage is a marker of health and it is determinant in athletic performance, measurement of the effect of nutrients on FM could be remarkable. As noted, one of these nutrients is omega-3 [8-10].

Omega-3s are essential nutrients for humans, that include alpha-linoleic acid (ALA; 18:3), eicosapentaenoic acid (EPA; 20:5), and docosahexaenoic acid (DHA; 22:6). ALA is found in seeds, nuts, flaxseed, and canola oil. Whereas the main source of these essential fatty acids is marine foods that should be yield from the diet or through supplementation [11-16]. It is recommended that adults intake 500 mg per day of EPA and DHA by consuming 2 servings of fish per week [17]. Although fish consumption increased in recent decades, the intake of essential fatty acids from foods contributes to the provide a small amount of daily requires [18]. So, the American Heart Association recommends supplementation for adults not eating enough oily fish[8].

Omega-3 is beneficial for human health; regulate blood lipids, increased cognition, improve immunity, and neuromuscular function, [19, 20]. Although some animal studies found omega-3 intake through the diet may reduce body weight, body fat accumulation, and particularly visceral fat, the effectiveness of omega-3 supplementation as a complementary method in weight loss is not definitive [5, 21, 22]. Also, previous human studies showed in obesity, diabetes, metabolic syndrome, and some cancers omega-3 could alter body composition[5, 23]. On the other hand omega-3 enhanced the expression of metabolism related genes such as PPAR gamma that enhanced fat oxidation [24, 25]. Some studies demonstrated as omega-3 increased appetite and food intake, so it could increase weight. Though weight increased; fat storage decreased and fat free-mass (FFM) increased. Results in healthy adults are contradictory [3, 26]. The studies suggest omega-3 is more effective in weight gain rather than weight loss, had different populations. For example, in patients with pancreatic cancer, omega-3 supplementation resulted increasing in weight and FFM [27], but for the patient with obesity, resulted in weight loss [4, 28-30]. Besides, in healthy humans, there is controversy about the weight change potential of omega-3 supplements. It was suggested that the effect of omega-3 on weight reduction, if any, is likely to be small, with gradual changes over time, and that is due to reduce body fat, increasing fat oxidation, and energy expenditure [5, 20].

Also, sports performance is highly dependent on the body compositions of athletes[31, 32]. Besides the previous studies showed omega-3 supplements could decrease FM in people with obesity, but fat loss is important for some healthy individuals with normal fat mass. In many fields of sport, reduce fat is important to enhance performance, even if body fat is in the normal range. The excess body fat can limit endurance, balance, coordination, and movement capacity. Thus, athletes competing in sports that require high levels of flexibility benefit from having low levels of body fat. For example, Endurance athletes such as distance runners, cyclists, and triathletes benefit greatly from having low percent of body fat [33].

Changes in weight are due to changes in body composition, but the exact amount of change in each part of the body composition (FM and FFM) is not known. As physical activity is an important confounder for change in body compositions, the difference in the amount of physical activity may impress the results of the supplementation. Until now, to our knowledge, no study has investigated the efficacy of omega-3 supplementation on body composition changes in healthy athletes by considering physical activity. As such, the aim of this study was to determine the effects of omega-3 supplementation on weight, body composition, food intake and lipid profile changes.

Methods

Study Design and Patients: A randomized double-blind placebo-controlled trial was conducted involving 18 athletes and 18 healthy man volunteers. The inclusion criteria were: 1) Athlete volunteers who have national sports rank or players of the professional soccer or any sports leagues; 2) At the age range of 20 to 30 years old; 3) BMI between 18.5 to 25 kg/m2; 4) Intake of omega-3 less than 1600 mg/day according to food frequency questionnaire (FFQ: 147 items) in last year; 5) Avoidance of any weight reducing drugs, dietary supplements, vitamins, minerals, and protein powders at least 6 months before and throughout the intervention; 6) Not having coagulopathy blood disease, kidney disease, liver damage, pancreatitis, diabetes, cancer, thyroid disorders, and inflammatory diseases or history of heart disease and stroke according to the individual statement; 7) No smoking; 8) Normal blood lipid profile tests before the start of the study. The exclusion criteria were: 1) Allergic reaction to the compositions of omega-3; 2) Unwillingness for cooperation; 3) Any drastic change in diet, duration, level, or type of physical activity and regular lifestyle; 4) Consuming alcohol, and smoking.

Following a public announcement of the study, volunteers willing to participate were recruited from public and private gyms, teams, stadiums, councils, and departments of sports and youth, department of physical education, sports medicine board in the Tabriz, Iran. The participants were the athletes in at last one filed (football 9, volleyball 3, basketball 4, athletics 2, archery 1, martial arts 6, swimming 4, weightlifting 3, wrestling 1, rock climbing 3). Participants who meet the eligibility criteria and be agree to enroll to study, after being given a full explanation of the study procedures, signed a statement of informed consent was taken from each participant before the commencement of baseline data collection. The present study was conducted according to the guidelines of the Helsinki Declaration. The study was approved by the Ethics Committee of the Tabriz University Medical of Sciences (IR.TBZMED.REC.1398.782) in October 2019, and the trial was registered at the Iranian registry of the clinical trial website (www.irct.ir) as IRCT20190625044008N1 (https://en.irct.ir/trial/43332).

Randomize, Blinding, and study method: For randomization, a blinded colleague who was not involved in any of the study stages randomly divided the participants into the intervention and placebo groups (1:1) by using RAS (Random Allocation Software). Allocation concealment was achieved through the use of closed letters with consecutive numbering. The blinded assistant created a 2-digit code for each participant to facilitate identification and tracking. Blinding of participants and investigators was supported through the provision of omega-3 or placebo containers with identical labeling. Placebo and supplements must be similar in terms of color, shape, and size. Gelatin capsule supplements and placebo will be stored at room temperature. Therefore, subjects and investigators will not be known for the treatment assignments in the study. Participants and researchers were all blinded to participant group members throughout the study. Subjects assigned to the omega-3 (n=18) and placebo (n=18) groups, using a randomized block procedure with stratified subjects in each block based on metabolic equivalents (METs) from GPAC physical activity questionnaire. So participants will be classified into 4 groups: 1) the omega-3 group with high MET receiving supplements of two omega-3 soft gel capsules per day, Zahravi Pharmaceutical Co, Tabriz, Iran, consists of 240 mg of DHA, 360 mg EPA.

2) The omega-3 group with low and moderate MET receiving supplements of omega-3.

3) The placebo group with high MET receiving placebo two soft gel capsules per day, each capsule containing one g of edible paraffin oil; provided by Zahravi Pharmaceutical, Co., Tabriz, Iran.

4) The placebo group with low and moderate MET receiving paraffin soft gel capsules. 

Intervention: All the participants received supplements or a placebo for three weeks. All participants were asked to take the capsule with their main meal. To keep informed of the regular intake of supplements and possible problems during the study, we called with participants once every week and also on the second visit asked them about how to consume supplements. Participants were asked to return boxes of drugs and the compliance of participants was evaluated by counting the number of unconsumed capsules at the end of the course and the subjects with less than 90% consumption were excluded. (None of the participants who complete the trial, had compliance less than 90%). Every week compliance of the sports activity and diet, evaluated by phone as a question of whether the diet or physical activity has changed a lot or not. (None of the participants excluded because of this reason). 

Assessment of Physical Activity and Dietary Intake: The global physical activity questionnaire (GPAQ) was used to estimate physical activity levels. A trained researcher filled out the questionnaire for each participant before and after the intervention, via face-to-face interview [34]. The validity and reliability of GPAQ have been confirmed previously by BashiriMoosavi et al. [35]. Data processed according to guidelines for analysis of the GPAQ that a total metabolic equivalents score (MET-minutes/week) was calculated, with patients categorized as high (≥3000 MET), moderate (600–3000 MET), or low (<600 MET) levels of activity (just high and low METs included the intervention). Changes in Dietary intake was assessed using a 24-hour recall questionnaire at the beginning, the same days every week, and at the end of the study is taken to ensure dietary intake didn’t significantly change. FFQ was completed before the intervention, by a trained nutritionist, to assess the omega-3 intake in the past year. Nutritionist IV software (First Databank, San Bruno, CA, USA), modified for Iranian foods, was used for dietary data analysis. 

Blood Sampling and Biochemical Measurements: 10 to 12 hours night fasting blood samples (5 mL) in sterile tubes with EDTA as an anticoagulant (Vacutainer K2E) was drawn for biochemical analyses. For serum separation samples are centrifuged at 3000 RPM for 5 minutes then 3 ml of whole blood samples are collected in a sterile microtube without any anticoagulant and store at -80 ° C until the serum markers of the study measured. Blood profile indexes including Serum Total cholesterol (TC), triglycerides (TG), and high-density lipoprotein (HDL-C) were measured through enzymatic methods using the colorimetric technique, by commercial kits (Pars-Azmoon Co., Tehran, Iran). LDL is calculated by the Friedewald equation[36]. 

Anthropometric measurement: Anthropometric parameters including weight and height were measured. The weight of the participants measured with minimal clothing and without shoes by digital scale to the nearest 0.05 g{Organization, 1995 #1095}. Height measured using a wall stadiometer in standing position without shoes with a precision of 0.5 cm (Seca, Germany) [37].  Wrist circumference measured using a tape meter to the nearest 0.1 cm.  BMI was calculated as weight (kg) divided by height squared (m2). Body composition evaluated using Tanita MC-780 S MA (Amsterdam, the Netherlands). RMR was measured by indirect calorimetry using Fitmate Pro (Rome, Italy). The measurements were performed by a trained nutritionist. Besides, blood pressure was measured in a comfortable sitting position in the left arm after at least five-minutes resting, using an aneroid sphygmomanometer and stethoscope. It was measured on two occasions and the mean of the two was taken as the individual’s blood pressure. 

Sample Size and Statistical Analysis: Considering the differences between the two studied groups for one of the main outcomes, we calculated the sample size as follows:

Z1-α/2=1.96      α= 0.05     1-β=0.90       Z1-β= 1.282

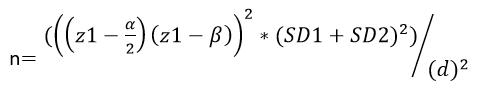
According to the equation above, the sample size was calculated by nearly 14 in each group and we selected 18 in each group, including a possible 30% loss to follow-up and discontinued intervention, and for great accuracy. 

Statistical analysis was done by STATA software [ver.16] (StataCorp, College Station, Texas 77845 USA). Normality of the numeric variables checked by Kolmogorov- Smirnov test. Data expressed using mean (SD), median (min-max) for the numeric normal and non-normal variables respectively, and frequency (percent) for categorical variables. The between-group comparisons of baseline measures and demographic variables done by independent t-test, Mann-Whitney U test, and/or Chi-square test where appropriate. For within-group comparisons paired t-test and Wilcoxon sign-rank test used for the numeric normal and non-normal variables, respectively, before and after intervention measurements were taken. To assess the effect of intervention the analysis of covariance (ANCOVA) used controlling for baseline measures and confounders.  In all analyses, P values less than 0.05 considered as significant.

Results

Of the 373 valentines who were screened by phone, 57 met all inclusion/exclusion criteria. However, after a face to face meeting, 21 were excluded due to a BMI>30 (n=11) or refusing to participate further (n=10). 36 participants were recruited with one loss to follow up in the placebo group, respectively, by three weeks. Therefore, a total of 35 participants completed the study (omega-3 group n=18; placebo group n=17). No adverse effects were reported by any of the participants, retained or lost, at any stage of the trial. Figure.1 demonstrates the study of flowchart. 

Blood pressure, Physical Activity and Dietary Intake

There was no significant difference between the two groups for level of physical activity (p=0.74), blood pressure (SBP: P=0.96; DBP: P=0.60), and demographic characteristics at baseline (Table 1). Also, the physical activity level of the participants who completed the trial (n=35) remained unchanged. As shown in Table 2, energy intake and macronutrient intake between the two groups was not significantly different at baseline. With-in group analyses adjusted for baseline values showed a significantly higher intake of energy intake in the omega-3 group compared to the placebo. Energy intake in omega-3 group increased after intervention (MD=264.22; 95%CI=399.38, 129.05; p<0.05). Adjustments to the data for baseline differences demonstrate no significant difference observed at the end of the study (p=0.13). Also, protein intake in the omega-3 group increased after the intervention (p<0.05). Carbohydrate, fat, MUFA, and PUFA adjustments to the data for baseline differences demonstrate no significant within- or between-group differences observed at the end of the study in either group. 

Table 1

Baseline characteristics of the study participants.

Variables

Omega-3 Group (n=18)

Placebo Group (n=17)

p

Age (year)a

21.83(3.71)

21.89(2.59)

0.053c

Education b


Diploma

8(44.44)

4(22.22)

  0.07f

Diploma and Associate

10(55.56)

10(55.56)


≥Bachelor

0(0.00)

4(22.22)


Marital status b


Single

15(83.33)

16(88.89)

1.00f

Married

3(16.67)

2(11.11)


SBP(mmHg)

110(100,12)

110(110.12)

0.96d

DBP(mmHg)

70(70.72)

71.5(70.75)

0.60d

Physical activity level


Low and Moderate

8(44.44)

10(55.56)

0.74f

High

10(55.56)

8(44.44)


MET/week

3143.5(3147.23)

2711.83 (2782.83)

0.44c

Notes: a Mean (standard deviation). b Number (%). c Based on independent-samples t-test. d Based on Mann–Whitney U-test. e Based on Pearson Chi-Square test. f Based on Fishers exact test. g Median (25th and 75th percentile)

Abbreviations: DBP: Diastolic blood pressure; MET: Metabolic equivalent; SBP: Systolic blood pressure.


Table 2

Comparison of the dietary Intake between study groups at baseline and at the end of the intervention

Variable

Omega-3 Group (n=18)

Placebo Group (n=17)

MD (95% CI), P

Energy (kcal/day)


Before

2833.70(783.14)

2736.90(568.45)

96.80(-366.74, 560.33), 0.67b

After

3097.92(812.97)

2723.16(612.74)

374.76(-122.61, 872.13), 0.13a

MD (95% CI), pc

264.22(-399.38, -129.05), 0.0007 c         

62.62(-45.37, 170.61), 0.24c


Protein (g)


Before

98.42(35.87)

97.70(35.63)

0.71(-23.50, 24.93), 0.95b

After

110.46(31.17)

100.44(27.88)

10.02(-10.36,30.40), 0.32 a

MD (95% CI), pc

-12.05(-23.62, -.47), 0. 0.04c

-0.86(-15.23, 13.52), 0.90 c


Carbohydrate (g)


Before

491.22(131.18)

468.06(109.90)

23.16(-58.81, 105.13), 0.28b

After

521.74(158.86)

464.33(104.52)

57.41(-35.67, 150.48), 0.22 a

MD (95% CI), pc

-30.52(-70.14, 9.10), 0.94 c

10.60(-36.02, 57.23), 0.32 c


Fat (g)


Before

54.86(23.08)

55.20(27.35)

-.34(-17.48, 16.8), 0.97b

After

66.54(24.43)

55.70(25.37)

10.85(-6.28, 27.97), 0.21 a

MD (95% CI), pc

-11.67(-24.28, 0.92), 0.96 c

.91(-14.30, 16.13), 0.90c


PUFA (g)


Before

12.14(5.17)

10.62(4.84)

1.52(-1.9, 4.92), 0.37 b

After

13.92(6.02)

12.01(5.87)

1.91(-2.18, 6.00), 0.35a

MD (95% CI), pc

-1.78(-4.64, 1.08), 0.20c

-1.31(-5.01, 2.39), 0.47


MUFA(g)


Before

18.78 (8.76)

19.18 (10.75)

-0.391 (-7.033, 6.25), 0.90 b

After

22.87 (9.29)

19.90(10.79)

2.98 (-3.93, 9.89), 0.39a

MD (95% CI), pc

-4.09 (-8.72, 0.54),

0.08 c

-0.19(-6.49, 6.12), 0.95 c


Notes: Mean (SD) and Mean difference (95% CI) are presented for normally distributed data; Median (25th and 75th percentiles), Median difference and coefficient (95% CI) are presented for data not normally distributed. cp based on paired samples t-test. bp based on independent samples t-test. ap based on analysis of covariance (ANCOVA) adjusted for baseline values.

Abbreviations: MUFA, Monounsaturated fatty acids; PUFA, Polyunsaturated fatty acids.


Lipid Profile

The two groups had similar lipid profiles at baseline (Table 3). At the three week follow-up, there were no significant changes, within or between groups, for TG, TC, LDL-C, and LDL-C/HDL-C. After intervention HDL-C was significantly increased in both groups (omega-3: p=0.001; placebo: p=0.013), although, after adjustment for the baseline values, Lipid Profile showed no statistically significant intergroup difference. 

Table 3

Comparison of the body composition and lipid profile between study groups at baseline and at the end of the intervention

Variable

Omega-3 Group (n=18)

Placebo Group (n=17)

MD (95% CI), P

Weight (kg)


Before

73.98(12.36)

71.87(13.65)

2.11(-6.71, 10.93), 0.62

After

74.44(12.44)

73.69(66.72)

0.75(-8.19, 9.69), 0.86

MD (95% CI), pc

-0.467(-.94, .007), 0.053


-0.635(-1.05, -0.22), 0.0053         


Body fat percent


Before

16.47(5.27)

15.88(6.11)

.0594(-3.27, 4.46), 0.76

After

15.49(5.99)

16.04(5.51)

-0.558(-4.52, 3.41), 0.77

MD (95% CI), pc

0.99(0.31, 1.67)

0.003

0.58(0.08, 1.1), 0.02


FM (kg)


Before

12.71(6.31)

12.08(6.25)

0.64(-3.62, 4.89), 0.76

After

12.35(6.70)

11.08(6.24)

1.27(-3.19, 5.72),0.57

MD (95% CI), pc

0.37(0.01, 0.72), 0.04

1.60(-0.95, 4.16), 0.20


FFM (kg)


Before

61.26(6.80)

59.79(7.99)

1.47(-3.55, 6.50), 0.56

After

62.07(6.78)

61.28(7.98)

0.08(-4.30, 5.87), 0.76

MD (95% CI), pc

-0.80(-1.3, -.267), 0.0058         

-0.91(-1.44, -0.39)

0.002


SMM(kg)


Before

58.20(6.48)

56.79(7.61)

1.41(-3.38, 6.20), 0.28

After

58.98(6.46)

58.22(7.62)

0.75(-4.09, 5.60), 0.75

MD (95% CI), pc

-0.77(-1.28, -0.26), 0.997

-0.88(-1.38, -.37), 0.002         


TBW (kg)


Before

44.64(4.60)

43.64(5.27)

1.00(-2.35, 4.35), 0.55

After

45.33(4.69)

44.67(5.38)

0.66(-2.80, 4.13), 0.70

MD (95% CI), pc

-0.69(-1.15, -0.22), 0.006     

-0.73(-1.16, -0.312), 0.002    


BMR


Before

1831.89(217.34)

1782.44(247.42)


49.44(-108.30, 207.19)

, 0.53

After

1849.11(219.30)

1827.82(245.43)


21.29(-138.59,  181.15), 0.79

MD (95% CI), pc

-17.22(-32.36, 2.08), 0.03

-25.88(-40.78, 10.98),0.002


TG (mg/dL)


Before

97.78(42.95)


106.67(48.03)

-8.89(-39.75, 21.98), 0.56

After

99.89(25.59)

96.29(27.85)

3.59(-14.78, 21.97)

0.693

MD (95% CI), pc

-2.11(-25.55, 21.33), 0.85

12.29(-5.71, 30.30), 0.17


TC (mg/dL)


Before

148.83(28.44)

146.22(35.24)

2.61(-19.08, 24.30), 0.81

After

155.17(25.95)

144.29(30.93)

10.87(-8.72, 30.46), 0.27

MD (95% CI), pc

-6.33(-17.66, 4.99), 0.25

1.59(-18.70, 21.88), 0.87


HDL-C (mg/dL)


Before

45.67(8.15)

47.89(9.32)

-2.22(-8.15, 3.70), 0.45

After

51.94(8.02)

52.65(7.03)

-0.70(-5.90, 4.49), 0.78

MD (95% CI), pc

-6.28 (-9.69, -2.86),

0.0012

-5.23 (-9.21, -1.26), 0.013


LDL-C (mg/dL)


Before

83.61(18.28)

77(37.74)

6.61(-13.47, 26.70), 0.51

After

83.24(22.57)

72.39(30.00)

10.86(-7.33, 29.05), 0.23

MD (95% CI), pc

0.367(-8.97, 9.70), 0.93


4.36(-15.97, 24.70), 0.65


LDL-C/HDL-C


Before

1.85(0.360)

1.68(0.83)

0.17(-0.26, 0.61), 0.43

After

1.64(0.49)

1.39(0.61)

0.24(-0.14, 0.62), 0.20

MD (95% CI), pc

0.22(-0.01, 0.45),0.06         

0.30(-0.083, 0.69), 0.12         


Notes: Mean (standard deviation) and mean difference (95% CI) are presented for normally distributed data; Median (25th and 75th percentiles). cp based on paired samples t-test. bp based on independent-samples t-test. dp based on Mann–Whitney U-test. fp based on Wilcoxon signed-ranked test. hp based on analysis of covariance (ANCOVA) adjusted for baseline values. gp based on quintile regression adjusted for baseline values.

Abbreviations: BMI, Body mass index; BMR, basal metabolic rate; CI, confidence interval; HDL-C, high-density lipoprotein cholesterol; FM, Fat mass; FFM, fat free mass; LDL-C, low-density lipoprotein cholesterol; SMM, skeletal macule mass; TBW, total body water; TC, total cholesterol; TG, triglyceride.


Anthropometric Measures

As presented in Table3, weight increased significantly in both groups. However, no statistically significant between-groups differences were observed for weight, at the end of the study, when the baseline values and dietary intakes were taken into consideration. Body fat percent and FM were decreased, on the other hand, FFM, TBW, and BMR increased (Table3). By the way, after adjustment for the baseline values, body composition showed no statistically significant inter- and between-group differences.

Discussion

This study investigated the effects of omega-3 on healthy athletes. More specifically, the present study examined the effect of three week omega-3 supplementation on weight, body composition, lipid profile, and dietary intake in elite athletes with normal weight and FM.

To our knowledge 10 human randomized controlled trials measured the effects of omega-3 on the weight changes. Clinical evidence shows a dose-dependent improvement in weight loss with the range of 250-2040 mg omega-3 per day [29, 38-42]. Although two studies showed 700 mg omega-3 caused weight gain [43, 44]. The range of the weight reduction due to omega-3 supplement was 100 g in Krzymińska-Siemaszko study to 7000 g in the study of Munro et al. [45, 46]. As presented in this study, weight increased by 467g after supplementation in the intervention group, but after consideration of baseline values, the effect of supplementation was not significant.

Omega-3 changes the weight by altering body composition, mostly FM and FFM. Results are inconclusive. Many previous studies showed FM reduced with omega-3 supplementation [6, 29, 38, 42, 43, 46, 47]. Three studies demonstrated the decrease in FFM [38, 43, 46], although, Couet et al. showed in young healthy adults Lean body mass increased after omega-3 supplementation for 3-weeks by 200 g [28]. In another study, Noreen et al. demonstrate in 6-weeks Lean body mass increased by 500 g in trained adults[29]. Our findings demonstrate FM reduced by 370 g and FFM increased by 800 g in the omega-3 group but after adjustments differences were not significant between the intervention and placebo group.

The probable reasons for different results are: 1) the effect of gender on body composition. Our study included just male participants, so the changes in FM were less than similar studies. As the amount of FM is higher in females, so, female participants had more fat reduction than male participants [29, 38, 40, 41, 44, 47], 2) the duration of supplementation, although studies with longer duration showed controversial results [29, 38, 41, 44, 45], 3) omega-3 would be more effective for improving body composition in patients with obesity, diabetes, or cardiovascular disease rather than among healthy individuals, 4) the baseline differences in omega-3 content in body tissues, while the fulfillment of the resources could change the result. By considering this, the role of omega-3 in alter the body composition in different situations seems to be notable.

The mechanisms by which omega-3 alter body weight are not well understood.

The expression of genes such as peroxisome proliferator-activated receptor (PPAR) gamma alters the regulation of fat metabolism [48]. There is also a study that suggests omega-3 could improve body fat reduction through change the activity of anabolic and anti-catabolic pathways, which promotes the maintenance of muscles and increased metabolic rate, specifically the mammalian target of rapamycin (mTOR) [49, 50].

In our study, in blood lipid profile just significant improvements were observed in the HDL-C after inter-group analysis, although considering between-group analyses showed no statistical significance between omega-3 and the placebo group. In agreement with our study, one study showed HDL-C increased after 6-weeks supplementation with 5.2 g omega-3 [51]. In contrast with the present study, three studies found omega-3 supplementation had a significant decreased in HDL-C [38, 52, 53]. There are two reasons for the inconsistent results between our study and the previous studies. First other RCTs were conducted using patients with diabetes or cardiovascular as participants, compared to our participants as healthy individuals. Secondly, the dose and duration of supplements were not the same [38, 51-55]. However, several hypotheses have been proposed to explain the effect of omega-3 on lipid profile is: first, reducing LDL-C and cholesterol synthesis; enhancing LDL-C receptors in the liver, increasing LDL-C and cholesterol catabolism; increasing the expression of AMP-activated protein kinase (AMPK); and nuclear factor-kB (NF-κB) protein expression. However, this mechanism is uncertain and some studies have shown neutral effects [56, 57].

Animal studies showed omega-3 consumption can reduce food intake in rodents [58, 59]. Human studies in this regard are limited and inconclusive. Safaeiyan A et al. (2018) showed 2 g omega-3 supplementation in 4-weeks had not any effect on total energy and macronutrient intake between the groups, but changed the both within the groups was significant [60]. In another study, Kartz et al. (2009) showed that increasing dietary omega-3 by increased 3.6% of total energy intake did not have any effect on food intake [61]. Our study showed omega-3 after 3-weeks increased energy and protein intake, but after adjustments, the results were not significant. In agreement with our findings. Elevated appetite could increase food intake. There is evidence suggesting that omega 3 may decrease appetite and increased thermogenesis; the reason would be increased plasma concentrations of adiponectin and leptin [62-66].

One of the limitations to this study was the low dose of omega-3 because the participants are healthy athletes, so the maximum intake for them should be 3 g per day, but in future controlled studies high doses are suggested. Another limitation is the changes in body composition measured with the BIA method, which has an error to the exact estimates of body composition and thus cannot be monitored the exact effects of omega-3. The participants of this study were male athletes, future studies with both sexes are suggested. Participant dietary intake was measured using 24-h food recall, in which under-reporting may have occurred. Cross-check with food frequency questionnaire suggest. In the future studies assessment, the effect of omega-3 supplementation on fat distribution in the body, such as visceral or subcutaneous fat suggested.

Conclusion

Based on our findings, supplementation with omega-3 in healthy adult men resulted in improving body composition status, including decrease FM, FFM, the body fat percent, and energy and protein intakes. After baseline adjustments, omega-3 supplementation seems to be not effective in decreased FM, and increased HDL-C, and energy and protein intake in elite athletes. Omega-3 fatty acids supplementation may increase HDL-C that helps to prevent obesity, metabolic syndrome, and hypertriglyceridemia. Further studies are recommended to determine the effect of different doses of omega-3 on adipose tissue and blood lipids in athletes with low fat mass.

Abbreviations

ANCOVA = analysis of covariance

BMI = body mass index

BMR= basal metabolic rate

BP= blood pressure

CI= confidence interval

DBP= Diastolic blood pressure

FFM= fat free mass

FM= fat mass

HDL-C= high-density lipoprotein cholesterol

LDL-C= low-density lipoprotein cholesterol

METs= metabolic equivalents

MUFA= Monounsaturated fatty acids

NF-κB= nuclear factor-kB

PPAR= peroxisome proliferator-activated receptor

PUFA= Polyunsaturated fatty acids

RCT= randomized controlled trial 

SBP= Systolic blood pressure

SD= standard deviation

SMM= skeletal macule mass

TBW= total body water

TG= triglyceride

TC= total cholesterol

Declarations

Compliance with Ethical Standards

The present study was conducted according to the guidelines of the Helsinki Declaration. It was approved by the Ethics Committee of the Tabriz University Medical of Sciences (IR.TBZMED.REC.1398.782) in October 2019.

Data Sharing Statement

The data are available from the corresponding author, upon reasonable request.

Acknowledgment

The authors would like to thank the people who participated in this trial.

Funding

This study was funded by Tabriz University of Medical Sciences, Tabriz, Iran (grant number: 63564); however, no publication fee was supported by any organization to publication of this article. The results of this article are derived from the Ph.D. thesis of Sara Moradi.

Disclosure

The authors declare no conflict of interest.

References

  1. Maughan, R.J., et al., IOC consensus statement: dietary supplements and the high-performance athlete. International journal of sport nutrition and exercise metabolism, 2018. 28(2): p. 104-125.
  2. Żebrowska, A., et al., Omega-3 fatty acids supplementation improves endothelial function and maximal oxygen uptake in endurance-trained athletes. European journal of sport science, 2015. 15(4): p. 305-314.
  3. Rawson, E.S., M.P. Miles, and D.E. Larson-Meyer, Dietary supplements for health, adaptation, and recovery in athletes. International Journal of Sport Nutrition and Exercise Metabolism, 2018. 28(2): p. 188-199.
  4. Herbst, E., et al., Omega‐3 supplementation alters mitochondrial membrane composition and respiration kinetics in human skeletal muscle. The Journal of physiology, 2014. 592(6): p. 1341-1352.
  5. Buckley, J.D. and P. Howe, Anti‐obesity effects of long‐chain omega‐3 polyunsaturated fatty acids. Obesity reviews, 2009. 10(6): p. 648-659.
  6. Logan, S.L. and L.L. Spriet, Omega-3 fatty acid supplementation for 12 weeks increases resting and exercise metabolic rate in healthy community-dwelling older females. PLoS One, 2015. 10(12): p. e0144828.
  7. Saber, A., et al., Secretion metabolites of dairy Kluyveromyces marxianus AS41 isolated as probiotic, induces apoptosis in different human cancer cell lines and exhibit anti-pathogenic effects. Journal of Functional Foods, 2017. 34: p. 408-421.
  8. Brown, T.J., et al., Omega-3, omega-6, and total dietary polyunsaturated fat for prevention and treatment of type 2 diabetes mellitus: systematic review and meta-analysis of randomised controlled trials. bmj, 2019. 366: p. l4697.
  9. NUTRITION, S. and C. TOXICITY, Advice on fish consumption: benefits & risks. 2004, Norwich, TSO (The Stationery Office).
  10. Rabar, S., et al., Lipid modification and cardiovascular risk assessment for the primary and secondary prevention of cardiovascular disease: summary of updated NICE guidance. Bmj, 2014. 349: p. g4356.
  11. Gladman, S.J., et al., Improved outcome after peripheral nerve injury in mice with increased levels of endogenous omega-3 polyunsaturated fatty acids. Journal of Neuroscience, 2012. 32(2): p. 563-571.
  12. Halcox, J.P., Cardiovascular risk and lipid management beyond statin therapy: the potential role of omega–3 polyunsaturated fatty acid ethyl esters. Clinical Lipidology, 2013. 8(3): p. 329-344.
  13. Virtanen, J.K., Dietary polyunsaturated fat intake in coronary heart disease risk. 2015, Taylor & Francis.
  14. Rizos, E.C., et al., Association between omega-3 fatty acid supplementation and risk of major cardiovascular disease events: a systematic review and meta-analysis. Jama, 2012. 308(10): p. 1024-1033.
  15. Harris, W.S., et al., Towards establishing dietary reference intakes for eicosapentaenoic and docosahexaenoic acids. The Journal of nutrition, 2009. 139(4): p. 804S-819S.
  16. Muskiet, F.A., et al., Is docosahexaenoic acid (DHA) essential? Lessons from DHA status regulation, our ancient diet, epidemiology and randomized controlled trials. The journal of Nutrition, 2004. 134(1): p. 183-186.
  17. Baum, S.J., et al., Fatty acids in cardiovascular health and disease: a comprehensive update. Journal of clinical lipidology, 2012. 6(3): p. 216-234.
  18. Rhodes, D., et al., 2011–2012 What We Eat in America, NHANES Tables 1–40. Worldwide Web Site: Food Surveys Research Group2014, 2014.
  19. McGlory, C., P.C. Calder, and E.A. Nunes, The Influence of Omega-3 Fatty Acids on Skeletal Muscle Protein Turnover in Health, Disuse, and Disease. Frontiers in Nutrition, 2019. 6(144).
  20. Smith, G.I., et al., Omega-3 polyunsaturated fatty acids augment the muscle protein anabolic response to hyperinsulinaemia–hyperaminoacidaemia in healthy young and middle-aged men and women. Clinical science, 2011. 121(6): p. 267-278.
  21. Krebs, J.D., et al., Additive benefits of long-chain n-3 polyunsaturated fatty acids and weight-loss in the management of cardiovascular disease risk in overweight hyperinsulinaemic women. Int J Obes (Lond), 2006. 30(10): p. 1535-44.
  22. Fearon, K., et al., Effect of a protein and energy dense N-3 fatty acid enriched oral supplement on loss of weight and lean tissue in cancer cachexia: a randomised double blind trial. Gut, 2003. 52(10): p. 1479-1486.
  23. Lorente-Cebrián, S., et al., Role of omega-3 fatty acids in obesity, metabolic syndrome, and cardiovascular diseases: a review of the evidence. Journal of physiology and biochemistry, 2013. 69(3): p. 633-651.
  24. Janani, C. and B.R. Kumari, PPAR gamma gene–a review. Diabetes & Metabolic Syndrome: Clinical Research & Reviews, 2015. 9(1): p. 46-50.
  25. Marion-Letellier, R., G. Savoye, and S. Ghosh, Fatty acids, eicosanoids and PPAR gamma. European journal of pharmacology, 2016. 785: p. 44-49.
  26. von Schacky, C., et al., Low Omega-3 Index in 106 German elite winter endurance athletes: a pilot study. International journal of sport nutrition and exercise metabolism, 2014. 24(5): p. 559-564.
  27. Barber, M., et al., The effect of an oral nutritional supplement enriched with fish oil on weight-loss in patients with pancreatic cancer. British journal of cancer, 1999. 81(1): p. 80.
  28. Couet, C., et al., Effect of dietary fish oil on body fat mass and basal fat oxidation in healthy adults. International journal of obesity, 1997. 21(8): p. 637.
  29. Noreen, E.E., et al., Effects of supplemental fish oil on resting metabolic rate, body composition, and salivary cortisol in healthy adults. Journal of the International Society of Sports Nutrition, 2010. 7(1): p. 31.
  30. Gerling, C.J., et al., Variable effects of 12 weeks of omega-3 supplementation on resting skeletal muscle metabolism. Applied Physiology, Nutrition, and Metabolism, 2014. 39(9): p. 1083-1091.
  31. Högström, G.M., et al., Body composition and performance: influence of sport and gender among adolescents. The Journal of Strength & Conditioning Research, 2012. 26(7): p. 1799-1804.
  32. Tipton, K.D., Nutritional support for exercise-induced injuries. Sports Medicine, 2015. 45(1): p. 93-104.
  33. Rossi, F.E., et al., The effects of a sports nutrition education intervention on nutritional status, sport nutrition knowledge, body composition, and performance during off season training in NCAA Division I baseball players. Journal of sports science & medicine, 2017. 16(1): p. 60.
  34. Armstrong, T. and F. Bull, Development of the world health organization global physical activity questionnaire (GPAQ). Journal of Public Health, 2006. 14(2): p. 66-70.
  35. BashiriMoosavi, F., et al., Level of physical activity among girl high school students in Tarom county and relevant factors. Iranian Journal of Health Education and Health Promotion, 2015. 3(2): p. 133-140.
  36. Friedewald, W.T., R.I. Levy, and D.S. Fredrickson, Estimation of the concentration of low-density lipoprotein cholesterol in plasma, without use of the preparative ultracentrifuge. Clinical chemistry, 1972. 18(6): p. 499-502.
  37. Ashtary-Larky, D., et al., Relationship between the body fat percentage and anthropometric measurements in athletes compared with non-athletes. Zahedan Journal of Research in Medical Sciences, 2018. 20(2).
  38. Mansoori, A., et al., Docosahexaenoic acid-rich fish oil supplementation improves body composition without influence of the PPARγ Pro12Ala polymorphism in patients with type 2 diabetes: a randomized, double-blind, placebo-controlled clinical trial. Lifestyle Genomics, 2015. 8(4-6): p. 195-204.
  39. Munro, I.A. and M.L. Garg, Dietary supplementation with n-3 PUFA does not promote weight loss when combined with a very-low-energy diet. British Journal of Nutrition, 2012. 108(8): p. 1466-1474.
  40. Pacifico, L., et al., A double-blind, placebo-controlled randomized trial to evaluate the efficacy of docosahexaenoic acid supplementation on hepatic fat and associated cardiovascular risk factors in overweight children with nonalcoholic fatty liver disease. Nutrition, Metabolism and Cardiovascular Diseases, 2015. 25(8): p. 734-741.
  41. Parker, H.M., et al., Effect of Fish Oil Supplementation on Hepatic and Visceral Fat in Overweight Men: A Randomized Controlled Trial. Nutrients, 2019. 11(2): p. 475.
  42. Jafari Salim, S., et al., Effect of omega-3 polyunsaturated fatty acids supplementation on body composition and circulating levels of follistatin-like 1 in males with coronary artery disease: a randomized double-blind clinical trial. American Journal of Men's Health, 2017. 11(6): p. 1758-1764.
  43. Huerta, A.E., et al., Effects of α‐lipoic acid and eicosapentaenoic acid in overweight and obese women during weight loss. Obesity, 2015. 23(2): p. 313-321.
  44. Gunnarsdottir, I., et al., Inclusion of fish or fish oil in weight-loss diets for young adults: effects on blood lipids. International Journal of Obesity, 2008. 32(7): p. 1105-1112.
  45. Krzymińska-Siemaszko, R., et al., The Effect of a 12-Week Omega-3 Supplementation on Body Composition, Muscle Strength and Physical Performance in Elderly Individuals with Decreased Muscle Mass. J Nutr, 2015. 12(9): p. 10558-74.
  46. Munro, I.A. and M.L. Garg, Dietary supplementation with long chain omega-3 polyunsaturated fatty acids and weight loss in obese adults. Obesity research & clinical practice, 2013. 7(3): p. e173-e181.
  47. Mortazavi, A., et al., The effect of omega-3 fatty acids on serum apelin levels in cardiovascular disease: A randomized, double-blind, placebo-controlled trial. Reports of biochemistry & molecular biology, 2018. 7(1): p. 59.
  48. Mori, T., et al., Dietary fish oil upregulates intestinal lipid metabolism and reduces body weight gain in C57BL/6J mice. The Journal of nutrition, 2007. 137(12): p. 2629-2634.
  49. Whitehouse, A.S. and M.J. Tisdale, Downregulation of ubiquitin-dependent proteolysis by eicosapentaenoic acid in acute starvation. Biochemical and biophysical research communications, 2001. 285(3): p. 598-602.
  50. Gingras, A.A., et al., Long‐chain omega‐3 fatty acids regulate bovine whole‐body protein metabolism by promoting muscle insulin signalling to the Akt–mTOR–S6K1 pathway and insulin sensitivity. The Journal of physiology, 2007. 579(1): p. 269-284.
  51. Tinker, L.F., et al., (n-3) fatty acid supplementation in moderately hypertriglyceridemic adults changes postprandial lipid and apolipoprotein B responses to a standardized test meal. The Journal of nutrition, 1999. 129(6): p. 1126-1134.
  52. Krantz, M.J., et al., Effects of omega-3 fatty acids on arterial stiffness in patients with hypertension: a randomized pilot study. Journal of negative results in biomedicine, 2015. 14(1): p. 1-6.
  53. Lee, K.W., A.D. Blann, and G.Y. Lip, Effects of omega-3 polyunsaturated fatty acids on plasma indices of thrombogenesis and inflammation in patients post-myocardial infarction. Thrombosis research, 2006. 118(3): p. 305-312.
  54. Doenyas-Barak, K., et al., N-3 fatty acid supplementation to routine statin treatment inhibits platelet function, decreases patients’ daytime blood pressure, and improves inflammatory status. European journal of clinical pharmacology, 2012. 68(8): p. 1139-1146.
  55. Root, M., et al., A randomized trial of fish oil omega-3 fatty acids on arterial health, inflammation, and metabolic syndrome in a young healthy population. Nutrition journal, 2013. 12(1): p. 40.
  56. Higuchi, T., et al., Levels of plasma insulin, leptin and adiponectin, and activities of key enzymes in carbohydrate metabolism in skeletal muscle and liver in fasted ICR mice fed dietary n-3 polyunsaturated fatty acids. The Journal of nutritional biochemistry, 2008. 19(9): p. 577-586.
  57. Kondo, K., et al., Effects of a fish-based diet on the serum adiponectin concentration in young, non-obese, healthy Japanese subjects. Journal of atherosclerosis and thrombosis, 2010: p. 1003170207-1003170207.
  58. Wang, H., L.H. Storlien, and X.-F. Huang, Effects of dietary fat types on body fatness, leptin, and ARC leptin receptor, NPY, and AgRP mRNA expression. American Journal of Physiology-Endocrinology and Metabolism, 2002. 282(6): p. E1352-E1359.
  59. Rokling-Andersen, M.H., et al., Marine n-3 fatty acids promote size reduction of visceral adipose depots, without altering body weight and composition, in male Wistar rats fed a high-fat diet. British journal of nutrition, 2009. 102(7): p. 995-1006.
  60. Safaeiyan, A., et al., Effect of omega-3 fatty acids on appetite, energy and macronutrient intake and body weight in obese adults: a randomized clinical trial. PROGRESS IN NUTRITION, 2018. 20: p. 203-209.
  61. Kratz, M., et al., Dietary n-3-polyunsaturated fatty acids and energy balance in overweight or moderately obese men and women: a randomized controlled trial. Nutrition & Metabolism, 2009. 6(1): p. 24.
  62. Takahashi, Y. and T. Ide, Dietary n-3 fatty acids affect mRNA level of brown adipose tissue uncoupling protein 1, and white adipose tissue leptin and glucose transporter 4 in the rat. British Journal of Nutrition, 2000. 84(2): p. 175-184.
  63. Pérez-Matute, P., et al., Eicosapentaenoic acid actions on adiposity and insulin resistance in control and high-fat-fed rats: role of apoptosis, adiponectin and tumour necrosis factor-α. British Journal of Nutrition, 2007. 97(2): p. 389-398.
  64. Krebs, J., et al., Additive benefits of long-chain n-3 polyunsaturated fatty acids and weight-loss in the management of cardiovascular disease risk in overweight hyperinsulinaemic women. International journal of obesity, 2006. 30(10): p. 1535-1544.
  65. Parra, D., et al., A diet rich in long chain omega-3 fatty acids modulates satiety in overweight and obese volunteers during weight loss. Appetite, 2008. 51(3): p. 676-680.
  66. Gray, B., et al., Omega-3 fatty acids: a review of the effects on adiponectin and leptin and potential implications for obesity management. European journal of clinical nutrition, 2013. 67(12): p. 1234-1242.