Fabrication and characterization of carbon doped In2O3
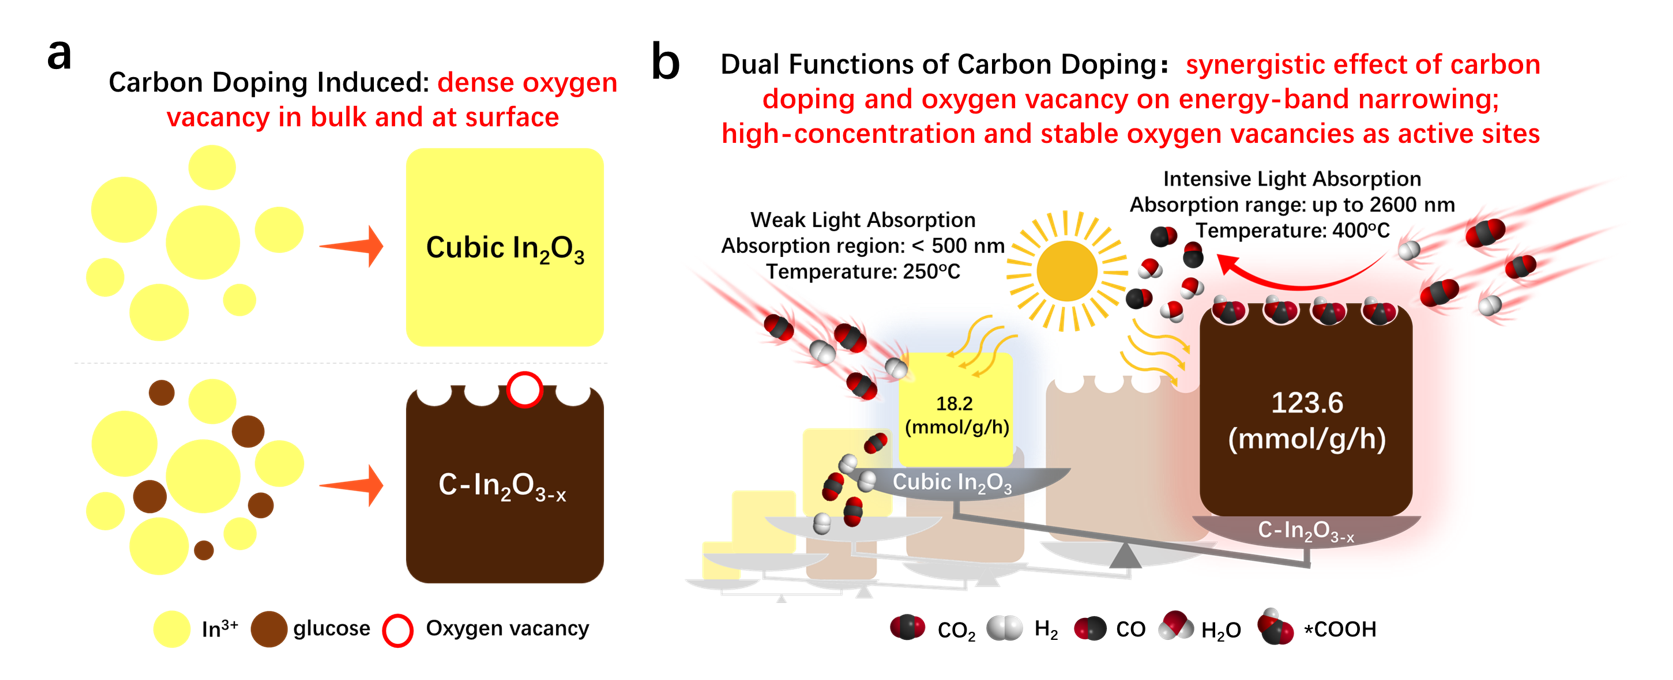
In this experiment, glucose as the carbon source was introduced to prepare carbon doping In(OH)3 (C-In(OH)3) nanoparticle precursors (Figure S1 and S2) by hydrothermal reactions. After calcinating in the Ar atmosphere, the C-In(OH)3 was dehydrated to form C-In2O3-x, and the morphology remained almost unchanged. Particle size ranged from 50 to 200 nm and the particle surface was covered many small protuberances (Figure 1a) with uniformly distributed carbon (Figure S3). The 0.177 nm spacing on the high-resolution transmission electron microscope (HR-TEM) image confirmed the (440) lattice plane in the cubic In2O3 crystalline phase corresponding to Fast Fourier transform (FFT) patterns with diffraction along the [110] axis (Figure 1b). The crystal structure was characterized by powder X-ray diffraction (XRD); all the peaks can be indexed into the standard In2O3 PDF card (JCPDS card No.71-2194) (Figure 1c).
In order to investigate the existential form of doped carbon and the relevant structural adjustment in In2O3, we simulated the most likely four modalities, including carbon atom substitution for oxygen atom (Cs-O), carbon atom substitution for indium atom at two different positions (Cs-Ina and Cs-Inb), and the interstitial carbon into the lattice of In2O3 (Ci). Specific properties, formation energies, bond lengths and ionic valence, were listed in Table S2. The results revealed the interstitial carbon model had the smallest formation energy of 7.59 eV (Figure 1d) and required minimal energy injection than the other three cases. In comparison, model III, the substitution of indium at position B, had the second lowest formation energy. However, the atomic radii of carbon and indium atoms were too far apart for substitution doping to occur31. Therefore, we speculated the carbon atom tended to be an interstitial state to anchor into the In2O3 lattice. Interstitial carbon could further affect the coordination of neighboring atoms to manipulate electronic properties. As seen from the X-ray absorption fine structure (XAFS), the In K-edge k2χ(k) vibrational lines presented a great difference between C-In2O3-x and standard cubic In2O3, which qualitatively revealed distinct local atomic arrangements (inset of Figure 1e). In Figure 1e, the four main peaks could be regarded as In-In shell and In-O shell in the R space for refined local atomic arrangements. We found that doped carbon atoms shortened the length of In-In bonds and enlarged the length of In-O bonds (Table S3). In addition, the maximum K-edge absorption of C-In2O3 was reduced to 27938.7 eV (Figure S4), indicating the generation of oxygen vacancy, the coordination number reduction of In-O and In-In, which resulted in higher disorder degrees32,33. Compared with standard cubic In2O3, the C-In2O3 with the presence of a noticeable structure distortion helped to maintain structural stability34,35.
Raman spectra provided more proof on local structural change and distortion of C-In2O3-x (Figure S5). Distinct photon modes at 309, 407, 491, and 628 cm-1 were consistent with Raman active modes of the cubic structure In2O336,37, but when the carbon was doped into the In2O3 lattice with different carbon doping levels, these highlighted peaks become smoother, suggesting introduced carbon disrupts original lattice structure 38. To investigate the effect of doped carbon on the chemical state and electronic structure of In2O3, we performed X-ray photoelectron spectroscopy (XPS) characterization. From the In 3d core-level spectra (Figure 1f), the two peaks located at 443.7 eV and 451.4 eV were assigned to the In 3d5/2 and In 3d3/2 signals39,40. However, with interference from carbon, both peaks moved toward higher binding energy with an about 0.5 eV shift, confirming indium atoms did accept electrons from doped carbon. To prove the XPS results, we computed the charge difference density (isosurface value is 3 e nm-3) of model IV in Figure 1d and found much net gain of charge was distributed around indium atom (inset of Figure 1f). Experimental data corroborated theoretical calculation, proving that carbon was successfully anchored in the lattice of In2O3 and therefore altered its original electronic structure.
Photothermal CO2 reduction performance
To reveal the advantages of C-In2O3 in the photothermal-driven RWGS reaction, we conducted the catalytic performance tests (Figure 2a) of the Vo-poor In2O3, Vo-rich In2O3-x, and C-In2O3-x with different carbon doping levels (Table S4). Benefiting from the richer concentration of active sites, Vo-rich In2O3-x had 18.2 mmol gcat-1 h-1 of CO production rate, which was three times higher than that of Vo-poor In2O3. This result was consistent with the literature analyses that oxygen vacancy facilitated CO2 adsorption to yield high RWGS reactivity18,23,41. When the appropriate amount of carbon was doped, the catalytic activity of C-In2O3-x-3 achieved six-fold enlargement compared with Vo-rich In2O3-x (123.6 mmol gcat-1 h-1). Low doping concentration limited light absorption capacity to enhance the photothermal conversion efficiency in endothermic RWGS reaction while high doping concentration led that extra carbon cannot anchor in the In2O3 lattice and form inert “free carbon” around the In2O3 nanoparticle to compete for the light energy. The more detail of the mechanism for the high activity will be discussed in next section. With the optimal sample, the CO2 conversion rate of C-In2O3-x eventually reached 45% with near-unity CO selectivity without the production of CH4 (Figure 2b) and the remarkable catalytic performance kept holding beyond 20 cycles in stability test (Figure 2c). The blank control test under the photothermal conditions also confirmed the doped carbon in the C-In2O3-x was stable and could not be decomposed to CO2 or CO (Figure S6). Further, the turnover number of the cyclic stability test (the amount of yield product/the amount of catalyst) was 190.56 that was much larger than 1, indicating photothermal RWGS reaction exhibits typical feature of catalysis.
Mechanism and pathway of photothermal CO2 reduction
Photothermal catalysis of CO2 reduction involves two main steps. The first step is light absorption and photothermal transformation via the active sites on the catalyst surface (local temperature effect); the second is CO2 adsorption and subsequent catalytic process28. In the first step, the catalysts are required to possess broader spectral coverage to maximize energy absorption and energy transfer efficiency. Because the photoexcited carriers (electron-hole pairs) could heat the non-plasmonic C-In2O3-x through non-radiative recombination from either Auger or Shockley-Read-Hall (i.e., trap assisted) to drive the thermally catalytic process, which rendered the mechanism for lattice vibrations and heat generation6,42, and powerfully assisted in lowering the photochemical activation energy43,44. Unlike the pale yellow of In2O3 crystals or the pale gray of In2O3-x, the color of C-In2O3-x appeared jet black (inset of Figure 3a), having broader photon absorption ranges from 250 to 2400 nm and stronger absorption intensity. Doped carbon atoms could extend the scope to the visible light region and defect state caused by oxygen vacancy further extended it to infrared region (Figure 3a). Combined with the bandgap structure (Figure S7) and ultraviolet photoelectron spectroscopy (UPS) (Figure S8), a schematic illustration of the bandgap structure of C-In2O3-x was depicted and shown in Figure S9. The band structure and density of states (DOS) of C-In2O3-x regulated by doped carbon could be explained using density functional theory (DFT). In Figure S10, compared with the cubic In2O3, when an oxygen vacancy was generated around an interstitial carbon, a new defect energy level with more massive DOS emerges. In this case, the electrons can be easily excited into the conduction band through the intermediate state, thereby achieving higher photoconversion efficiency45-47.
On the other hand, the radiative recombination competed against non-radiative recombination. After carbon doping, the fluorescence significantly quenched, demonstrating that radiative recombination of the photon-generated carriers had been suppressed by extracting the electrons (Figure S11). Therefore, the C-In2O3-x system could reach near 400 °C within 10 minutes, which is far higher temperature than those of Vo-poor In2O3 and Vo-rich In2O3-x (Figure 3b). The surface of C-In2O3-x worked as a "nanoscale heat source," which absorbed the photon energy and rapidly converted it into heat that was conducted to the active sites of C-In2O3-x in a short time.
The next step was adsorption of gas molecules onto the surface and subsequent catalytic process. For clarity, in temperature-programmed desorption (TPD) of CO2, the peak at 480℃ indicated the adsorption was in the form of chemisorption via the oxygen vacancies on C-In2O3-x48,49. If the oxygen vacancy is filled under annealing in air, the adsorption capacity could be notably reduced (Figure S12). In order to prove the role of oxygen vacancy as the active site was in the catalytic process, we conducted comparative DFT calculations of In2O3 and In2O3-Ovac [110] slabs (Figure S13 -15). The Gibbs free energy for the intermediate *CO of RWGS reaction on In2O3 slab without oxygen vacancy was 0.66 eV which was higher than the slab with oxygen vacancy (0.32 eV). Thus, a high concentration of oxygen vacancies was expected to increase the capacity of CO2 adsorption and lower the energy barrier of photothermal CO2 reduction RWGS reaction. Electron spin resonance spectroscopy (ESR) effectively evaluated the oxygen vacancy concentration (Figure 3c). Limited signals of Vo-poor In2O3 and Vo-rich In2O3-x were detected, while a stronger signal of C-In2O3-x appeared at g=2.004, which could be explained as more concentrated electrons are trapped around the surface oxygen vacancies50. Next, to prove the carbon doping has a function in elevating oxygen vacancy concentration, the formation energy of oxygen vacancy was simulated (inset of Figure 3c). In non-defective In2O3 crystal, the oxygen vacancy formation energy was 4.98 eV, while the energy decreased to 3.10 eV after interstitial carbon anchored into In2O3 lattice (Table S3). Our result suggested that interstitial carbon assembled with oxygen vacancy to form a higher concentration active sites, thereby pushing forward the RWGS reaction.
We then performed the in-situ Fourier Transform Infrared (FTIR) characterization in a flow cell to investigate the catalytic pathway of RWGS reaction on the active sites of C-In2O3-x. As displayed in Figure 3d, the C-In2O3-x exhibited OH stretching band within the range 3400-3730 cm-1. Peaks located at 1500 and 1390 cm−1 were identified as chemisorbed CO2 and H2 molecules, as well as bicarbonate (HCO3−) and carbonate (CO3−) formation. The detectable peak at 2894 cm−1 was attributed to bending vibration δ(CH). Here, the peaks corresponding to crucial intermediate methoxy (H3CO*) in the spectra were at 2839 and 1090 cm−1, and COOH* were at 1578 and 1232 cm−1. Therefore, the incoming electrons coupled with resident protons reduced the amount of CO2 molecules at the active sites, oxygen vacancy, then formed COOH* and H3CO* intermediates and transferred into CO* consistently. Simultaneously, the peak at 2107 cm−1 and 1643 cm−1 were the diagnostic vibrational modes of CO and H2O respectively, indicating the reaction pathway that features CO* as the intermediate from carboxyl through the RWGS reaction51-54. In general, oxygen vacancy with doped carbon as active sites effectively activated CO2 molecules and stabilized the intermediates, so as to reduce the activation energy and promote photothermal CO2 reduction (Figure 3e).