3.1 Distribution of Pfmdr 1 and Kelch 13 genes among the age groups, gender, birth orders and blood groups.
The molecular study indicated that the Pfmdr1 presented itself in various forms among the samples examined. The genetic constitutions were classified as mutant, wild, and a mixture of mutant and wild. The mixed group (mutant/wild) was the highest being expressed in 77 (38.5%) children infected with malaria, followed by the mutant gene (35.5%, n = 71), wild gene (20.5%, n = 41) and the resistant genes were absent in 11 infected children (5.5%) (Figure 1). The wild type is the normal chloroquine sensitive genes, while the mutant and the mutant/wild ones are the Pfmdr1 resistant strains.
The results further showed that 11 (37.9%) of the neonates had the Pfmdr1 mutant genes, 12 neonates (41.4%) had both mutant and wild genes and 6 neonates (20.6%) had the wild type (Table 3). Among the infants, 30 (37.0%) had the mutant genes, 42 infants (51.9%) had both mutant and wild genes while 9 (11.1%) had the wild type. In the age groups >12 months to 5 years, 32 children (40.5%) had the mutant genes, 40 children (50.6%) had both the mutant and the wild genes and 7 (8.9%) had the wild genes. Forty-four (38.3%) of the males had the mutant genes, 51 (44.3%) had both the mutant and wild genes and 20 males (17.4%) had the wild genes. Similarly, 29 females (39.2%) had the mutant genes, 30 females (40.5%) had both mutant and wild genes and 15 females (20.3%) had only the wild genes. However, Chi-square analysis showed that there is no significant difference in the distribution of Pfmdr1 between gender (χ2= 0.634, df = 1, p>0.05). The distribution of malaria parasite wild mutant genes (Pfmdr1) was present in all birth orders except birth order greater than 5. However, the mutant/wild genes were highest (60%) in birth order 4 and lowest (33.3%) in birth order greater than 5. The wild type was highest (66.7%) in birth order greater 5 and lowest (10%) in birth order 4 (Table 3).
The result also revealed that mutant gene was highest (60%) among AB blood group and lowest in blood group B. Similarly, the wild type resistant gene was highest (30%) in blood group AB and lowest (15.4%) in both blood group A and B. In contrast, the mixed type (mutant/wild) was highest (51.3%) in blood group B and lowest in blood AB (10%).
Table 3
The Distribution of malaria Parasite resistant genes (Pfmdr1) among various groups
|
Variables
|
Mutant gene
(%)
|
Mutant /wild
(%)
|
Wild
(%)
|
df
|
P-value
|
|
Age Groups:
|
|
|
|
|
|
|
Neonates
|
11(37.9)
|
12 (41.4)
|
6 (20.7)
|
|
|
|
Infants
|
30 (37.0)
|
42 (51.9)
|
9 (11.1)
|
0.005
|
|
|
>12months-5yrs
|
32 (40.5)
|
40 (50.6)
|
7 (8.9)
|
|
|
|
Gender:
|
|
|
|
|
|
|
Male
|
44 (38.3)
|
51 (44.3)
|
20 (17.4)
|
1
|
0.634
|
|
Female
|
29 (39.2)
|
30 (40.5)
|
15 (20.3)
|
|
|
|
Birth Orders:
|
|
|
|
|
|
|
1
|
37 (44.6)
|
33 (39.8)
|
13 (15.6)
|
|
|
|
2
|
21 (35.0)
|
24 (40.0)
|
15 (25.0)
|
4
|
0.003
|
|
3
|
15 (45.5)
|
13 (39.4)
|
5 (15.2)
|
|
|
|
4
|
3 (30.0)
|
6 (60.0)
|
1 (10.0)
|
|
|
|
≥5
|
0 (0.0)
|
1 (33.3)
|
2 (66.7)
|
|
|
|
Blood Groups:
|
|
|
|
|
|
|
A
|
9 (34.6)
|
13 (50.0)
|
4 (15.4)
|
|
|
|
B
|
13 (33.3)
|
20 (51.3)
|
6 (15.4)
|
3
|
0.029
|
|
AB
|
6 (60.0)
|
1(10.0)
|
3 (30.0)
|
|
|
|
O
|
51 (44.7)
|
43 (37.7)
|
20 (17.5)
|
|
|
NB: Total Positive by DNA PCR out of the randomly selected 200 positive samples =189
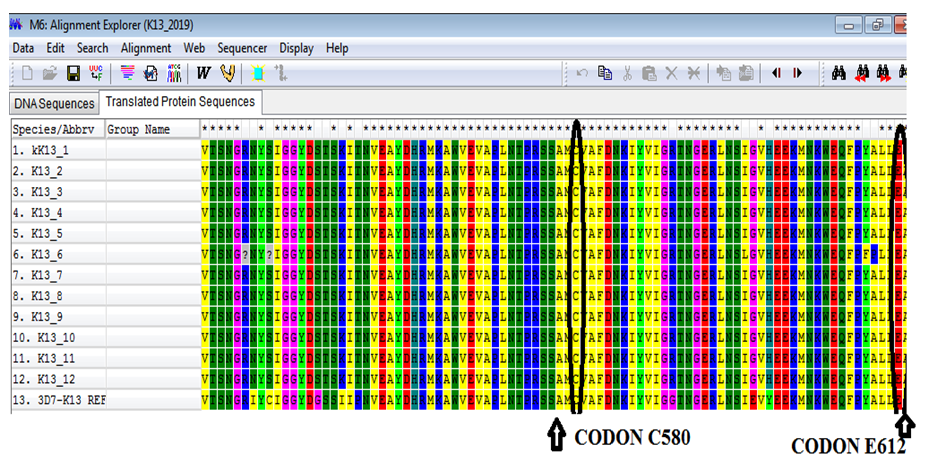
The results as presented in Table 4 revealed that there was a point mutation in the codon position 557 where the amino acid Alanine was replaced by Serine in the PfK13 detected in some of the blood samples of the participants in the current study. Table 4 also showed the codon positions in the first column, the second column showed the reference amino acid for the wild type (sensitive), the third column showed the amino acids for the mutant genes and the last column showed the observed amino acids for the test samples. The codon positions 580, 612, 476, 569, 449, 557, 458, 617 and 112 have the amino acids Cysteine (C), Glutamic Acid (E), Methionine (M), Alanine (A), Glycine (G), Alanine (A), Asparagine (N), Alanine (A) and Glycine (G) respectively for the reference amino acids.
Plate 1 showed the screen shot of the PfK13 amino acid sequence alignment and when observed closely, there were point mutations in some of the amino sequence in some of the codon positions, for example, the amino acid Proline had replaced Alanine in the DNA sequence of the PfK13_6 species in the last yellow column, there were also two point mutations in the 6th and 9th column of the same PfK13 species.
Table 4
Sequence Comparison with global reported SNPS in pfk13
|
CODON POSITION
|
REFERENCE AMINO ACID (wild type)
|
MUTANT TYPE AMINO ACID
|
OBSERVED AMINO ACID
|
|
580
|
C
|
Y
|
C
|
|
612
|
E
|
D
|
E
|
|
476
|
M
|
I
|
M
|
|
569
|
A
|
S
|
A
|
|
449
|
G
|
A
|
G
|
|
557
|
A
|
S
|
S
|
|
458
|
N
|
Y
|
N
|
|
617
|
A
|
T
|
A
|
|
*112
|
G
|
E
|
G
|
| * Non-propeller mutation |
Number of Mutant alleles Detected = 0
SNPs: single nucleotide polymorphisms
Amino Acids: Cysteine (C), Glutamic Acid (E), Methionine (M), Alanine (A), Glycine (G), Asparagine (N), Tyrosine (Y), Aspartic Acid (D), Isoleucine (I), Serine (S), Threonine (T).
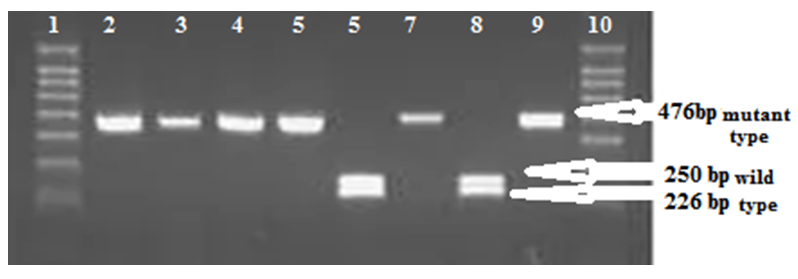
3.2 DNA Electrophoresis of Pfmdr1 (N86Y) and PfK13 genes
Two hundred blood samples were randomly selected from the 261 positive samples for molecular tests. The image gel in Plate 2 showed the electrophoregram of Pfmdr1 (N86Y) gene Apo1 digest products resolved on 2% Agarose gel. Restriction enzyme was used to identify the mutated gene and to express the percentages of the manifestation of various genotypes such as mutant, wild and mixed types. Lanes 1 and 10 are the 100 base pairs (bp) DNA Ladder. The loaded wells showed bands that separated from the well to a base pair of 476 bp for the mutant type, 250 bp for the wild type and 226 bp for the mixed type. The 226 bp being the lightest migrated fastest ahead of 250bp and the 476bp mutant genes. Lanes 2 to 5, 7 and 9 were the undigested mutant (86Y) strains. Lanes 6 and 8 were digested (wild type or the sensitive genes).
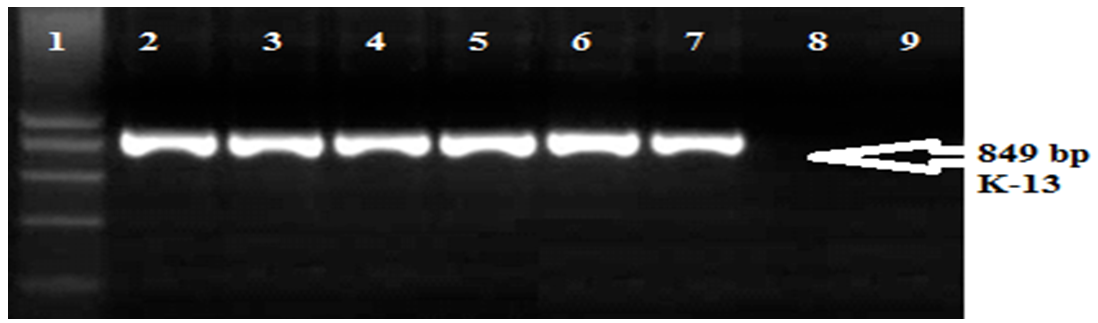
The image in Plate 3 showed the electrophoregram of PfKelch13 propeller gene nest 2 PCR amplicons resolved on 1.0% Agarose gel. Lane 1 showed the 1.3kB DNA ladder while lanes 2-7 showed the undigested PfKelch 13 amplicons (mutant genes).