Participants
IQ trajectories in the current study were derived from 265 participants (89 female/176 male) diagnosed with autism spectrum disorder whose intellectual ability was assessed at up to two time points in early childhood (T1: Mean: 3.2(0.5) years, and T2, M(SD)= 11.3(1.0)) and a third time point in middle childhood (9-12 years of age; T3). Developmental quotient (DQ) was measured at Time 1 using the Mullen Scales of Early Learning (MSEL)(17), and at Time 2 and Time 3 using the MSEL or the Differential Ability Scale (DAS)(18) (depending on language abilities). To allow longitudinal analysis, T-scores from both the MSEL and DAS subtests were converted to standardized scores with a mean of 100 and standard deviation of 15, and then averaged to obtain an overall standardized score.
Autism was diagnosed by research–reliable clinical psychologists at the Intellectual and Developmental Disabilities Research Center (IDDRC) at the UC Davis MIND Institute using the Autism Diagnostic Interview–Revised and the Autism Diagnostic Observation Schedule (ADOS)-Generic or ADOS-2 (19–22). ADOS CSS ranges from 1 to 10, with higher scores indicating greater autism symptom severity. Participants were English speaking without suspected vision, hearing, or neurological conditions. All research activities were conducted at the University of California Davis MIND Institute and Imaging Research Center and were approved by the UC Davis Institutional Review Board. Parents or legal guardians provided informed consent prior to participation. The data described in the current research is available from the corresponding or senior authors upon reasonable request.
Identification of IQ Trajectory Groups
In recent work(9), we identified three IQ trajectory groups: (1) Persistently-High IQ (P-High): Individuals whose IQs remained within normal range throughout childhood, n=48 (18 female), (2) Persistently-Low IQ (P-Low): Individuals whose IQs remained low in the range of intellectual disability throughout childhood, n=108 (32 female), and (3) Changers: Individuals whose IQs began in the range of intellectual disability but increased over childhood, n=70 (39 female). Mean IQs of each group at baseline and outcome timepoints are reported in Table 1, as well as other sample characteristics. Briefly, trajectory groups had been identified using latent class growth analysis (13) to identify distinct IQ trajectories in a sample of ASD youth, with age matched TD controls serving as a reference group. All participants with at least one timepoint were included in the analysis (nASD=373; nTD=162). Linear and quadratic age-based models were tested for the ASD group. Both information-heuristic (e.g., information criterion values) and inferential (e.g., likelihood ratio tests) relative fit comparisons were used to select the best-fitting modeling solution (23). Namely, information-heuristic indices include the Akaike Information Criterion (AIC) (24), Bayesian Information Criterion (BIC) (25), and sample size-adjusted BIC (SBIC) (26), in which lower values indicate better fit, as well as the approximate Bayes Factor (27,28). As an inferential index, the approximate correct model probability (CMP) (25) compares a single model versus all other models under consideration, and models with a CMP >.10 should be considered as candidate models.
Imaging Acquisition and Processing
Structural MRI at T1 were acquired during natural nocturnal sleep (29) on a 3 Tesla Siemens Trio with an 8-channel head-coil, which included a T1-weighted MPRAGE (TR 2,170 ms, TE 4.86 ms, FOV 256, 192 sagittal slices, 1.0 mm slice thickness, 8:46 acquisition time). Spatial inhomogeneity in images were distortion corrected using a calibration phantom acquired at each scan (ADNI MAGPHAM, The Phantom Laboratory; Image Owl, Inc., Greenwich, NY, USA, http://www.phantomlab.com) (30). Images were visually assessed for quality and by using a previously described quantitative procedures (31).
Identifiable information was removed from each MPRAGE, defaced, and then uploaded to MRICloud (https://mricloud.org) (32) for image segmentation. Gray and white matter labels defined by the LONI Probabilistic Brain Atlas protocol (LPBA40) (33,34) were segmented using multi-atlas image segmentation. Multi-atlas image segmentation registers a set of age-appropriate anatomically labeled atlases onto a target brain image using diffeomorphic registration, which produces a set of candidate segmentations, and consensus segmentations are then produced using joint-label fusion, an advanced voting procedure (35–37).
Network Definitions
Regions of interest for each network were chosen based on established large-scale intrinsic functional connectivity networks (38).
FPN Network
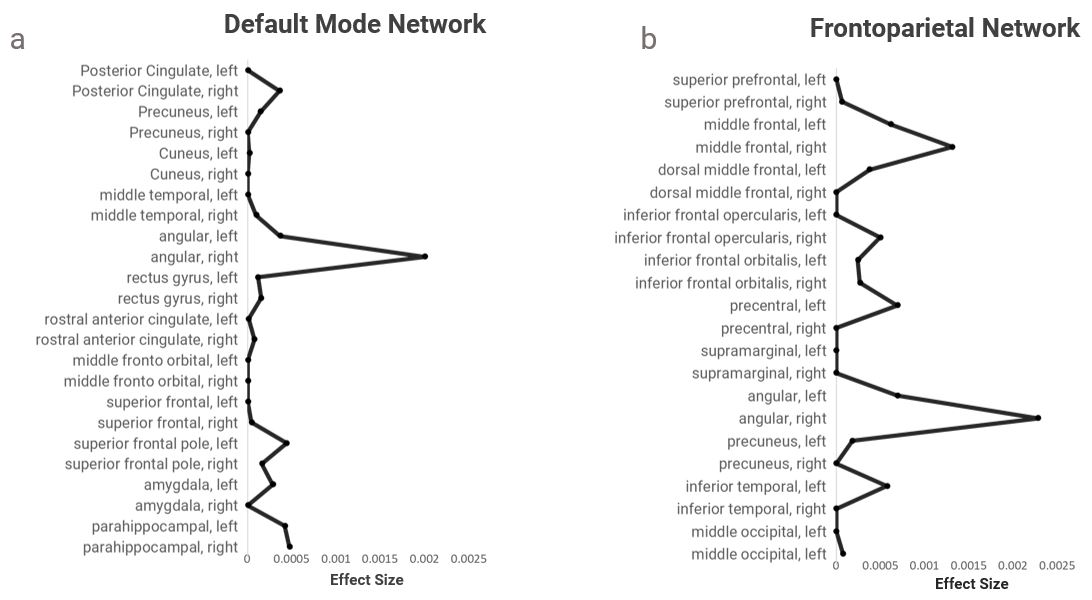
The FPN comprised the following regions of interest: bilateral superior prefrontal gyri, middle frontal gyri, dorsal middle frontal gyri, opercularis of the inferior frontal gyri, orbitalis of the inferior frontal gyri, precentral gyri, supramarginal gyri, angular gyri, precunei, inferior temporal gyri, and the middle occipital gyri.
DMN Network
The DMN comprised the following regions of interest: bilateral posterior cingulate cortices, rostral anterior cingulate cortices, precunei, cunei, middle temporal gyri, angular gyri, gyri rectus, middle fronto orbital gyri, the prefrontal and poles of the superior frontal gyri, amygdalae, and parahippocampal gyri.
Analytic Strategy
We used multivariate distance matrix regression (MDMR) to identify associations between the identified IQ trajectory groups and the volumes of regions of interest within the FPN and DMN networks at baseline. MDMR is a robust, person-centric, multivariate regression method with application in connectomic, genomic, and ecological research (15,39,40). MDMR regresses a Gower-transformed pair-wise distance matrix onto an explanatory model and residual term (15,41). The distance matrix is an index representing how much individuals differ from one another across a set of outcomes (e.g. brain measurements). When constructing a distance matrix, a distance metric must be chosen. Here we chose the Manhattan “city-block” distance, as we’ve done previously (39), because it is more robust to extreme values than either Euclidean and Pearson’s distances, and can be a better choice for high-dimensional datasets (42). Interpretation of the results of MDMR regressions is aided by distance-based redundancy analysis, a dimension-reduction technique that aids visualization of multivariate datasets which is constrained on the variables of interest and other covariates (43,44), and by using Euclidean projection to estimate distances between group centroids (45). Finally, we use a bootstrapping technique to estimate relative effect sizes for individual outcomes (e.g., brain regions within the network) to each MDMR result (16,39).
Collectively this procedure allows us to first identify the overall pattern differentiating individuals of different groups (P-High, P-Low, Changers), and then second, to identify specific regions within the network which contribute most to the overall pattern using effect-size analysis. We then follow up and descriptively identify the specific volumetric differences (adjusted for total brain volume) in brain regions exhibiting the greatest effect sizes within each significant MDMR result. MDMR analyses separately examined the FPN and DMN distance matrices which were regressed on the following model: Y = β0 + β1(IQ trajectory groups) + β2(age) + β3(sex). Interactions between sex and trajectory groups were also tested.

