Extracted gelatin from the waste of fresh and grilled chicken skin was used to prepare films as a biodegradable packaging material from solutions of various gelatin concentrations using a casting approach. The thermal behavior of extracted gelatins was investigated by differential scanning calorimetric. The particle size and zeta potential of dispersed nanoparticles of gelatins were measured by dynamic light scattering. The surface area of lyophilized gelatin nanoparticles was calculated from the adsorption of N2 gas. Mechanical properties, water vapor permeability (WVP), and oil uptake (OU) of all manufactured films were studied. Tensile strength values significantly increased for films manufactured from both gelatin sources when the concentration increased from 4 % to 6 % up to 5.1 MPa. The elongation of waste skin gelatin-based films was higher than waste grilled skin gelatin (WG)-based films using 4 % and 8 % concentrations up to 57 %. Films manufactured from WG had significantly lower WVP than waste skin gelatin (WS) analogous at a 4 % gelatin concentration. The WVP of films manufactured from gelatin significantly increased as gelatin concentration increased where OU showed higher oil resistance for films manufactured from WS up to 91 % using 4 % gelatin concentration. The morphological structure of the gelatin film was investigated with scanning electron microscopy (SEM). A homogenized and smooth film surface was observed. The percentage of heavy metal was examined by inductively coupled plasma (ICP). The results of this study showed that the films manufactured using higher concentrations of gelatin possessed promising mechanical properties, good barrier properties, and high safety as a recommended biopolymer packaging material for food contact and pharmaceutical applications.
Research Article
Efficient Eco-Friendly Nano-Extracted Gelatin as Biodegradable Packaging Material
https://doi.org/10.21203/rs.3.rs-1033618/v1
This work is licensed under a CC BY 4.0 License
Version 1
posted
You are reading this latest preprint version
Recycling waste protein
gelatin
packaging film
water permeability
oil swelling
overall migration
Packaging of food and beverage is one of the largest upward industries within the plastic, glass, and paper packaging [1]. The conservatively plastic industries of packaging materials face great challenges such as sustainability, environmental problems, and the dwindling of fossil fuel-based feedstocks [2]. Biopolymers sources could replace or reduce commonly plastics production which are disbursed industrially, mainly for applications in the food packaging sector [3]. Recently, natural biopolymers gained great advantages as renewable in several types, biodegradable in the environment or edible [4] biopolymers can form polymer films with a wide range of natural polymers (chitosan, starch, carrageenans, pectin, gelatin, collagen, whey protein, corn, etc.) [5].(eira et al., 2011)
One of the main industries for supplying the meat and protein needs for the customers is poultry [7]. (Carrillo-Lopez, 2018).
The production rate is expanding with high rates [8]. Large quantities of solid wastes are produced as a by-product. For example, the waste for the slaughter weight of chicken is 33 % [9]. Many efforts are going to exploit these wastes and convert them to high-value-added products. Gelatin is one of the most add-value products from protein waste especially the slaughter of chicken. Gelatin was extracted from leather solid waste for potential application in chemical sand-fixation [10]. Bone can be used as a source to produce gelatin through the biocatalysis process [11]. Collagen is a special type of extracted protein from raw trimming waste of tannery for many applications like tissue engineering and the pharmaceutical industry [12]. Gelatin is selected as an interesting biodegradable material due to the semi-crystalline behavior of hydrated gelatin and low melting temperature [13]. The high density for the dynamic hydrogen bonding of amide linkages provides unique mechanical properties. Gelatin is known as an extracted protein through a precise hydrolysis process of the insoluble fibrous of collagen [14]. Skin and bones produced as waste during animal slaughtering and processing are the main sources of collagen [15]. Therefore, gelatin can be considered a low-cost biopolymer with excellent functional film-forming properties [16].
The effect of plasticizers on the thermal and functional properties of gelatin had been studied [17], but less attention has focused on the effect of utilizing various ingredient concentrations and their subsequent impact on the properties of such films. The study of nanoparticle formation of technical grade of gelatin as applied packaging film is one of the novel characters during this research.
As shown in the previous state of the art, most of the recent researches are aimed to extract gelation as protein for various applications with clear deficiency to used nanotechnology. For that, this work was modified cheap and easy preparation method as a novel waste reduction technique combined nanotechnology add-value product. This new trend in waste assessment was targeted to produce nano-gelatin and evaluate its enhancement in one of the vital application sectors as novel packaging nano-film.
The objective of this study was to prepare nanoparticles of extracted gelatins from waste chicken skin. Two types of gelatin were extracted waste skin gelatin (WS) and waste grilled skin gelatin (WG). The size, charge, and surface area of gelatin nanoparticles were evaluated. Additionally, the mechanical properties, water vapor permeability, and oil permeability properties of gelatin films manufactured using various ingredient concentrations from waste chicken skin fresh or grilled were evaluated.
2.1. Materials
The fresh chicken skin was obtained from a local company. Grilled chicken waste was purchased from Food manufacturing factories. Glycerol used as plasticizer and glutaraldehyde as crosslinker were purchased from Sigma Aldrich, Germany. Sodium hydroxide and hydrochloric acid were used as received without pre-purification.
2.2. Methods
2.2.1. Chicken skin preparation
The chilled chicken skin was kept in a refrigerator (4°C) overnight. After that, waste fresh skin was washed with a water stream to remove any impurities, the skin was cut into small parts and lyophilize-dried for 72 hrs. Completely dry skin was milled and then defatted according to (AOAC, 2006). On the other hand, waste grilled skin was soaked in water to eliminate burned parts, which floated above the water surface.
2.2.2. Extraction of gelatin from waste grilled and waste skin chicken
The extraction process of gelatin from chicken skin (grilled or fresh) was occurred according to our previous work [18] with slight modification. 15 g of defatted dried skin (grilled or fresh) was soaked in 200 mL of 0.05 M sodium hydroxide. The solution was kept in a water bath shaker at 25 oC for one hour. After that, the sample was divided into a plastic (polycarbonate) tube and centrifuged at 5000 rpm for 10 minutes by ultracentrifuge Thermo-Scientific, SorvallMTX150, Germany. The alkaline solution was changed through triplicate repeating of this step to remove non-collagenous proteins and pigments. Precipitated discs were washed under a water stream and neutralized with 0.05 M hydrochloric acid. The sample was rewashed with Milli-Q water (18.5 Ω) to remove any salts and extracted through centrifuging at 10000 rpm for 15 min. slow decantation and concentrated solution with a rotary evaporator at 40°C under reduced pressure, followed by freeze-drying overnight.
2.2.3. Composition of gelatin
The ash, moisture, and fat content of gelatins were characterized according to the methods described by AOAC [19]. The content of protein was measured as a function of total nitrogen content by the Kjeldahl method [19]. The value of nitrogen in gelatin protein can be calculated by multiplying the determined value with factor 5.5. The extraction efficiency of gelatin was monitored based on the dry weight of fresh skin according to the following formula:

2.2.4. Bloom strength of gelatin gels
6.67 % of gelatin is dissolved in water to prepare a solution in standard bottles. The solution is vortexed and stands for three hours to hydrate at ambient temperature. After that, specific bottles are immersed in a water bath at 60°C for 25 minutes. The bloom bottles are placed to cool for 20 minutes at room temperature, followed by a conditioned water bath at 10°C for 16-18 hours. CT3-texture analyzer (Brookfield, USA) was used to determine the bloom strength of extracted gelatin (Ref: TA-10). Measurement was applied according to Gelatin Manufacturers Institute America (GMIA) and AOAC standards as a universal means of assessing gelatin quality.
2.2.4. Synthesis of gelatin nanoparticles
The double desolvation technique was used for the preparation of gelatin nanoparticles [20] with our vital modifications. 6.1 wt.% gelatin solution was prepared by dissolving 3.05 g of gelatin (WS or WG) in 50 mL Milli-Q water with warming condition with magnetic stirring. The desolvation step was carried out by adding 60 mL of acetone to the gelatin solution. This was followed by re-desolvation in Milli-Q water and lyophilizing the precipitated gelatin fraction. A 2% gelatin solution was obtained via dissolving 0.2 g of the lyophilized gelatin (0.2 g) in 20 mL of Milli-Q water at 50°C. The dropwise addition of acetone under continuous stirring at 800 rpm for 12 hours was leading to the formation of nanoparticles. The purified nanoparticles were prepared through three-step centrifugation at 32,000 rpm for 15 min and redispersed in acetone/water (30/70 mixture). The resulted dispersion of nanoparticles in Milli-Q water was kept in the refrigerator.
The nanoparticles were analyzed for the mean diameter and zeta potential of the waste gelatins (WS and WG) particles at 170°, by dynamic light scattering (DLS) (NICOMP 380 ZLS, PSS, Santa Barbara, CA, USA). The dispersed solution was lyophilized and stored as a powder to use for surface area measurement.
2.2.5. Differential scanning calorimetry
Differential scanning calorimetry DSC131 evo (SETARAM Inc., France) was used to perform the differential scanning calorimeter analysis. The instrument was calibrated using the standards (Mercury, Indium, Tin, Lead, Zinc, and Aluminum). Nitrogen and Helium were used as the purging gases. The test was programmed including the heating zone from 25°C to 400°C with a heating rate of 10°C / min. The samples were weighted in an Aluminum crucible 30 ul and introduced to the DSC. The thermogram results were processed using (CALISTO Data processing software v.149).
2.2.6. Film preparation
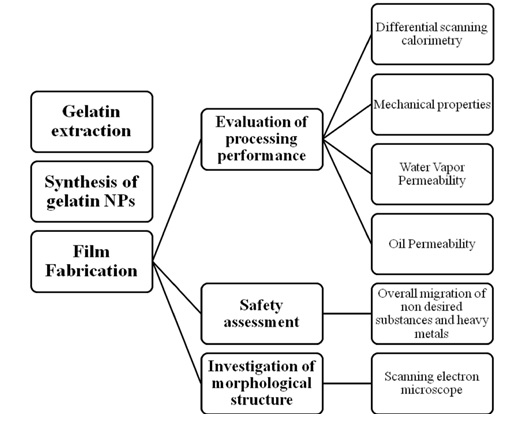
WG and WS based on gelatin films were prepared by solution casting employing concentrations that ranged from 4 % to 8 %. Glycerol as plasticizer (0.4 w/w) and glutaraldehyde as crosslinker (2.5 w/w) were added based on gelatin content. The films were cast in Teflon plates and dried for 24 hours at 80-85 % relative humidity and 35°C. After drying, films were peeled off from the Teflon plates and cut into test specimens. The prepared film was characterized according to scheme 1.
2.2.7. Mechanical properties
The mechanical properties are should be taken into consideration to meet the desired processing and applications demands. Mechanical properties of casted films were evaluated; tensile strength (TS), and elongation at break (E) of films were measured by Zwick/RoellZ020 instruments, (Ulm, Germany) according to the ASTM-D412.
2.2.8. Measurement of oil uptake and water vapor permeability (WVP)
The control to permeate the gases, vapors is one of the important issues for flexible packages. That is very critical for some products that need specific barrier protection. WVP was measured for gelatin films according to ASTMF249 for determining WVP of synthetic packaging materials. Water vapor permeation analyzer Systech model 7001 was used to investigate the water permeability of gelatin films. The measurements were maintained under controlled temperature (38 oC) and humidity (88 -90 % RH). Oil uptake of gelatin films was determined using the published method [21].
2.2.9. Investigation of morphological structure
A Quanta 400F scanning electron microscope (SEM) was used to investigate the morphology of the films. Before the SEM analysis, the samples were fractured in liquid nitrogen and coated with gold prior.
2.2.10. The overall migration
Many international regulations have been legalized regarding the migration of specific substances such as heavy metals, degradation products, and additives. These materials could have bad taste, odors, or suspected harmful effects to consumers. The overall migration (OM) simulants and conditions as detailed in EU Regulation Nr. 10/2011 (The PIM), Simulant A: 10 % v/v ethanol, Simulant B: 20 % v/v ethanol, Simulant D2: rectified olive oil. All samples were compared to a blank sample (Millipore water with resistivity 18.5 MΩ) as reference. The overall migration is expressed as the amount in milligrams of material lost from one decimeter square surface (mg/dm2). As the single-sided cell method was used, results were calculated considering the area of only one surface of the test specimen. After 10 days at 40°C, the samples were picked up from contact and the extraction aqueous solutions were collected in a rotatory evaporated flask to dryness and weighted until constant weight (EN 1186-5-single side contact in cell test) [22].
2.2.11. Total heavy metals determination
All samples were digested using nitric acid before the metals determination to be an acceptable matrix for consistent recovery of metals that are compatible with the analytical method (APHA, 2017). The heavy metals determinations were performed on Agilent 5100 Inductively Coupled Plasma – Optical Emission Spectrometer (ICP-OES) with Synchronous Vertical Dual View (SVDV) [23].
3.1. Gelatin Composition and bloom strength of gelatin gels
The composition of (waste skin gelatin) WS and (waste grilled skin gelatin) WG are tabulated in Table 1. The protein content, moisture and ash content were 81.37 %, 9.96 and 0.41 % respectively for the lyophilized chicken skin gelatin. The evaluation of the difference in the composition of the extracted gelatin from chicken skin fresh (WS) and grilled (WG) is necessary to understand the properties of the prepared films.
|
Yield, % |
Moisture, % |
Protein, % |
Ash, % |
Bloom, g/m2 |
|
|---|---|---|---|---|---|
|
WS |
17.3±1.01 |
9.96±0.06 |
81.37±0.32 |
0.41±0.03 |
247 ±1.31 |
|
WG |
14.9±0.94 |
3.4±0.02 |
77.13±0.28 |
1.3±0.06 |
179 ±0.85 |
The gel strength of WS is higher than WG 28.2 % probably due to the thermal treatment of WG through the grilling process. The gel strength of extracted gelatin from fish or chicken gives 181 and 263, respectively[24]. In addition, horse mackerel gelatin shows bloom strength 280 [25] and 177 g [11]. The low value of fish gelatin may be due to hydroxyproline content being relatively low in fish skin [26]. The hydroxyproline and proline can form hydrogen bonding with free water and triple-helix of gelatin structure [15]. Also, the bloom strength of gelatin is affected by many factors like chemical handling of gelatin, type, form, concentration, and source of gelatin, besides the thermal history of the extracted gelatin [11]. In addition, the value of bloom strength is directly proportional to the gelation point, melting, and gelation time of the extracted gelatin.
3.2. Differential Scanning Calorimetry
One of the most popular tools to investigate thermal behaviors in food ingredients such as gelatin is Differential scanning calorimetry (DSC). Recently, endothermic Tm of bovine gelatin was characterized during the thermal investigation of extracted gelatin [27].
Figure 1 shows the thermographic trend of WS and WG. Detectable peaks are calculated to determine onset temperature (To), offset temperature (Tf), maximum temperature (Tmax) and heat of energy (ΔH). The chicken waste gelatin exhibits two endothermic peaks one for glass transition temperature Tg ≈ 74°C and the other for melting. The melting peak is detected at 130.7°C (To), 143.6°C (Tf), 136.4 (Tmax), and 25.61 J/g (ΔH).
WG presented two endothermic peaks with a little shift than fresh chicken skin gelatin. The melting peak is calculated with thermal indices 126.6°C (To), 148.6°C (Tf), 137.8 (Tmax), and 26.12 J/g (ΔH). There is a detectable broadness of WG melting peak with temperature difference (Tf -To) 22°C where the difference of WS melting peak is 12.9°C. Additionally, the intensity of Heat flow response for WS is higher than WG. This is can be attributed to the thermal treatment of chicken skin through the grilling process.
3.3. Particle size and zeta potential
The particle size of WS and WG was measured according to Intensity-weight with uniform bell shape Gaussian distribution. The double desolvation process can be produced unique gelatin particles in nano-scale size.
The particle size distributions with unimodal form are illustrated in Fig. 2. Moreover, the zeta potential at low voltage was measured in an aqueous solution (pH 7). Over many measurements, the average zeta potential value was calculated as shown in Fig. 2. the stability of gelatin particles through eleven measurements is perfect and nearly the same.
|
Mean particle size, nm |
Polydispersity PDI |
Zeta potential, mV |
Nitrogen content, % |
|
|---|---|---|---|---|
|
WS |
63.5 |
0.365 |
16.98 |
11.71 |
|
WG |
75.5 |
0.401 |
21.86 |
8.27 |
Table 2 summarized the mean particle size and zeta potential of WS and WG. The surface area of lyophilized gelatins was tabulated. The results give excellent clues on the nanoparticle size for both types of extracted gelatins [28]. The mean diameter of WS and WG nanoparticles were 63 and 75 nm respectively. That reflects the high precision preparation method of nanoparticle gelatin. The zeta potential measurements presented the positive charge on gelatin particles with 16.8 and 21.8 mV for WS and WG respectively. The nitrogen content was decreased for WG than WS which can be indicated to thermal treatment of WG.
As well known, the unique relationship between volume/surface area of creating nanomaterials will be generated a novel character [29]. the prepared nano-gelatin with particle size less than 80 nm was shown a promising enhancement in physical properties of prepared nono-film. The zeta potential can give a clue for homogeneity and well dispersion of gelatin solution. This is directly related to the film performance and stability of collided particles during the casting process with a proper zeta value in the moderated stable range from 10 to 40 mV [30]. Particle size and zeta potential are vitally characterized by nanomaterials especially gelatin dispersed in an aqueous medium.
3.4. Mechanical properties
The mechanical properties of gelatin films were presented in Table 3. The tensile strength (TS) of WG and WS-based films were not significantly different from each other. This was also observed regardless of the gelatin concentrations used. However, TS values for films, manufactured from both sources of gelatin used in this study, significantly increased when the concentration increased from 4 % to 6 %. No further significant increases occurred when gelatin concentration increased from 6 % to 8 %.
|
Thickness, µm |
TS, MPa |
E, % |
||
|---|---|---|---|---|
|
4% |
WS-gelatin |
51 |
3.1 |
57 |
|
WG-gelatin |
43 |
2.3 |
48 |
|
|
6% |
WS-gelatin |
52 |
4.9 |
37 |
|
WG-gelatin |
49 |
4.3 |
34 |
|
|
8% |
WS-gelatin |
57 |
5.1 |
46 |
|
WG-gelatin |
55 |
4.7 |
38 |
|
| Means in the same column for 5 replicated samples with significant difference (P < 0.05) | ||||
TS was unaffected by the gelatin source. TS for films containing 8 % gelatin concentration manufactured using WS presented greater film strength than films manufactured from WG. This also happened to be the film with the greatest TS (20.42 N) of all films tested. The concentration of gelatin used also significantly affected TS, whereby the higher the concentration of gelatin used, the greater was TS.
No significant differences were observed for Elongation (E) values from films manufactured from both sources of gelatin and at gelatin concentrations between 4 % and 6 %. However, at an 8 % gelatin concentration, E values for films derived from WG had greater E than analogous films manufactured from WS. However, when gelatin concentrations ranged from 4 % to 6 %, E properties decreased, irrespective of gelatin species origin.
3.5. Water vapor permeability (WVP)
WVP values are indicated in Figure 3. WG and WS gelatin behaved differently from each other concerning WVP. This is maybe revealed to heat treatment of chicken skin within the grilling process. WG-based films containing a gelatin concentration of 4 % had lower WVP values when compared to WS-derived gelatin film equivalents. WVP values for both WG and WS-derived gelatin films had similar values by using 6 % and 8 % gelatin concentrations were used to manufacture films. The films manufactured from WG showed no significant differences from each other for WVP as the concentration of gelatin used to produce the films increased. However, films manufactured from WS showed increased resistance to WVP as the gelatin concentration increased from 4 % to 6 %, but not at any other concentration used.
WS skin with 4 % concentration possessed the lowest WVP value, below 60 g·mm/kPa·d·m2. it was noted that as the gelatin concentration increased in films, so too did the requirement for greater plasticizer addition. This consequently led to an increase in WVP, but this was especially apparent for films manufactured from WS. It is well recognized that the addition of plasticizer to a protein-based film mixed solution causes the protein network to become less dense and more permeable [31], however, the plasticizing effect noted in this study is interesting in that it appears to affect the same protein source in different ways, depending on the differences associated with the protein-based on its species origin.
3.6. Oil uptake (OU)
OU of films manufactured from WG- and WS and used at a 4 % concentration showed no significant differences (Figure 4). The films manufactured using both 6 % and 8 % gelatin showed significant differences in oil uptake by both films which resulted in differences in weight gain. The films manufactured from WS had more resistance to oil uptake. In terms of gelatin concentration, no significant differences were observed within each species-defined film type for OU.
3.7. Topographic investigation of gelatin films
The surface morphologies of the prepared films were characterized utilizing scanning electron microscopy (SEM). This helps to understand the effect of chicken waste sources (i.e. fresh or grilled skin).
It can be observed from the SEM images shown in Fig. 5 that the films exhibited uniform surface morphology. Gelatin-based fresh chicken skin wastes film was presence more homogenized and smoother than that based on grilled chicken skin wastes. This is maybe due to some impurities that remain in gelatin films based on WG or thermal degradation for the polymer chains during the grilling process.
3.8. Study the overall migration of chemical substances from the prepared films
The migration of any chemical substances from the prepared films has been studied according to the EU Regulation Nr. 10/2011. The stimulants were selected carefully to represent different food natures. As shown in Table 4, the prepared films showed highly acceptable migration limits. The overall migration (OM) from the WG and WS gelatin films were ranged from 0 up to 0.3 mg/dm2. The regulation limits the accepted level up to 10 mg/dm2.
|
Method Replicates |
Migration into 10% v/v ethanol (simulant A) mg/dm2 |
Migration into 20% v/v ethanol (simulant A) mg/dm2 |
Migration into 3% w/v acetic acid (simulant B) mg/dm2 |
Migration into Olive oil (simulant D2) mg/dm2 |
||||||
|---|---|---|---|---|---|---|---|---|---|---|
|
WS8% |
WG8% |
WS8% |
WG8% |
WS8% |
WG8% |
WS8% |
WG8% |
|||
|
1 |
0.1 |
0.1 |
0.4 |
0.2 |
0.3 |
0.2 |
0.0 |
0.1 |
||
|
2 |
0.2 |
0.3 |
0.2 |
0.3 |
0.1 |
0.3 |
0.0 |
0.0 |
||
|
3 |
0.0 |
0.2 |
0.3 |
0.3 |
0.3 |
0.1 |
0.0 |
0.2 |
||
|
Mean |
0.15 |
0.2 |
0.3 |
0.26 |
0.23 |
0.2 |
0.0 |
0.15 |
||
|
Acceptable |
10 |
10 |
10 |
10 |
10 |
10 |
10 |
10 |
||
3.9. Total heavy metals determination in various simulants
The migration of heavy metals in various stimulants (i.e. Simulant A: 10 % v/v ethanol, Simulant B: 20 % v/v ethanol, Simulant D2: rectified olive oil) had been investigated. The traced metals were cadmium, lead, mercury, chrome, aluminum, arsenic, and antimony. The levels of migrated heavy metals in different simulants were in the accepted levels as shown in Table 5 [32]. The highly acceptable levels of overall migration and the traces of the heavy metal ensure the prepared gelatin films are appropriate as a food-contact layer.
|
Conc. in 3% acetic acid, µg/L |
Conc. in 20% ethanol µg/L |
Conc. in 10% ethanol µg/L |
Conc. in Olive oil µg/L |
Acceptable Value µg/L |
||||||
|---|---|---|---|---|---|---|---|---|---|---|
|
WS8% |
WG8% |
WS8% |
WG8% |
WS8% |
WG8% |
WS8% |
WG8% |
|||
|
Cd |
0.03 |
0.06 |
0.01 |
0.02 |
0.01 |
0.01 |
0.008 |
0.01 |
5 |
|
|
Pb |
0.10 |
0.13 |
0.06 |
0.07 |
0.02 |
0.04 |
0.01 |
0.02 |
10 |
|
|
Hg |
0.07 |
0.09 |
0.03 |
0.05 |
0.02 |
0.03 |
0.01 |
0.01 |
12 |
|
|
Cr |
0.11 |
0.16 |
0.09 |
0.11 |
0.03 |
0.05 |
0.01 |
0.02 |
50 |
|
|
Al |
0.11 |
0.13 |
0.05 |
0.09 |
0.06 |
0.08 |
0.01 |
0.01 |
40 |
|
|
As |
0.10 |
0.14 |
0.08 |
0.13 |
0.08 |
0.12 |
0.01 |
0.01 |
10 |
|
|
Sn |
0.63 |
0.82 |
0.39 |
0.56 |
0.28 |
0.34 |
0.01 |
0.01 |
1200 |
|
Overall, it was shown in this study that gelatin formed very functional films which possessed some very good mechanical and barrier properties. Film properties, as affected by ingredient concentration, were interesting, but more so were the differences that emerged when gelatin was utilized from different animal sources for film manufacture and compared. The originality of bio-waste recycling especially gelatin is a global issue. For that, this research has deep originality by preparation add value products from waste with eco-friendly behavior as efficient packaging film. Moreover, this research article is discussing two novels missed research points: the effect of utilizing various ingredient concentrations and their subsequent impact on the properties of such films and the study of nanoparticle formation of technical grade of gelatin as applied packaging film
Gelatin was extracted from grilled and fresh chicken skin with a low-cost process. Biodegradable, cheap, and eco-friendly films based on the extracted gelatin have been fabricated. The effect of various ingredients and gelatin concentration were studied. The prepared films were fully evaluated as practical packaging substrates. The evaluation was achieved by investigation of mechanical properties, water vapor, and oil uptake, and migration of any undesirable substances.
Acknowledgement
The authors have great thankful for the nanomaterial investigation laboratory, Central lab. Network, National Research Centre for technical support and materials investigation.
- Ibrahim S, El Saied H, Hasanin M (2018) Active paper packaging material based on antimicrobial conjugated nano-polymer/amino acid as edible coating. J King Saud Univ - Sci. https://doi.org/10.1016/j.jksus.2018.10.007
- Padmanabhan SC, Cruz-Romero MC, Kerry JP, Morris MA (2018) Food Packaging: Surface Engineering and Commercialization. Nanomater Food Packag 301–328. https://doi.org/10.1016/B978-0-323-51271-8.00011-5
- Cutter CN (2006) Opportunities for bio-based packaging technologies to improve the quality and safety of fresh and further processed muscle foods. Meat Sci 74:131–142. https://doi.org/10.1016/J.MEATSCI.2006.04.023
- Ibrahim S, Abdel Rehim M, Turky G (2018) Dielectric study of polystyrene/polycaprolactone composites prepared by miniemulsion polymerization. J Phys Chem Solids 119:56–61. https://doi.org/10.1016/J.JPCS.2018.03.030
- Vieira MGA, da Silva MA, dos Santos LO, Beppu MM (2011) Natural-based plasticizers and biopolymer films: A review. Eur Polym J 47:254–263. https://doi.org/10.1016/J.EURPOLYMJ.2010.12.011
- A Roshani, J Shaigan AB (2012) Anaerobic digestion and methane production from poultry waste. J Environ Stud 38:83–88. https://doi.org/10.22059/ jes.2012.29102
- Piñon MI, Alarcon-Rojo AD, Renteria AL, Carrillo-Lopez LM (2018) Microbiological properties of poultry breast meat treated with high-intensity ultrasound. Ultrasonics. https://doi.org/10.1016/J.ULTRAS.2018.01.001
- Ma J, You F (2019) Superstructure optimization of thermal conversion based poultry litter valorization process. J Clean Prod 228:1111–1121. https://doi.org/10.1016/J.JCLEPRO.2019.04.346
- López-Andrés JJ, Aguilar-Lasserre AA, Morales-Mendoza LF, et al (2018) Environmental impact assessment of chicken meat production via an integrated methodology based on LCA, simulation and genetic algorithms. J Clean Prod 174:477–491. https://doi.org/10.1016/J.JCLEPRO.2017.10.307
- Dang X, Yuan H, Shan Z (2018) An eco-friendly material based on graft copolymer of gelatin extracted from leather solid waste for potential application in chemical sand-fixation. J Clean Prod 188:416–424. https://doi.org/10.1016/J.JCLEPRO.2018.04.007
- Ma Y, Zeng X, Ma X, et al (2019) A simple and eco-friendly method of gelatin production from bone: One-step biocatalysis. J Clean Prod 209:916–926. https://doi.org/10.1016/J.JCLEPRO.2018.10.313
- Masilamani D, Madhan B, Shanmugam G, et al (2016) Extraction of collagen from raw trimming wastes of tannery: a waste to wealth approach. J Clean Prod 113:338–344. https://doi.org/10.1016/J.JCLEPRO.2015.11.087
- Wang W, Zhang X, Teng A, Liu A (2017) Mechanical reinforcement of gelatin hydrogel with nanofiber cellulose as a function of percolation concentration. Int J Biol Macromol 103:226–233. https://doi.org/10.1016/J.IJBIOMAC.2017.05.027
- López D, Márquez A, Gutiérrez-Cutiño M, et al (2017) Edible film with antioxidant capacity based on salmon gelatin and boldine. LWT 77:160–169. https://doi.org/10.1016/J.LWT.2016.11.039
- Serrato-Avila JL, Navarro-Fernández JO, Hernández-Reséndiz R, et al (2019) Gelatin Paste as an Alternative Cost-Effective Hemostatic Agent in Cranial Surgery: Doing More with Less. World Neurosurg 122:224–228. https://doi.org/10.1016/J.WNEU.2018.10.224
- Mohajer S, Rezaei M, Hosseini SF (2017) Physico-chemical and microstructural properties of fish gelatin/agar bio-based blend films. Carbohydr Polym 157:784–793. https://doi.org/10.1016/J.CARBPOL.2016.10.061
- Park JW, Scott Whiteside W, Cho SY (2008) Mechanical and water vapor barrier properties of extruded and heat-pressed gelatin films. LWT - Food Sci Technol 41:692–700. https://doi.org/10.1016/J.LWT.2007.04.015
- Ibrahim S, Nawwar GAM, Sultan M (2016) Development of bio-based polymeric hydrogel: Green, sustainable and low cost plant fertilizer packaging material. J Environ Chem Eng 4:203–210. https://doi.org/10.1016/j.jece.2015.10.028
- AOAC (2006) Official Methods of Analysis. Assoc Off Anal Chem Gaithersburgs, MD
- Ahsan S, Mohra C (2017) The role of surface charge in the desolvation process of gelatin: implications in nanoparticle synthesis and modulation of drug release. Int J Nanomedicine 12:795–808
- Wang L, Auty MAE, Rau A, et al (2009) Effect of pH and addition of corn oil on the properties of gelatin-based biopolymer films. J Food Eng 90:11–19. https://doi.org/10.1016/J.JFOODENG.2008.04.030
- Kanishka Bhunia, Shyam S. Sablani, Juming Tang BR (2013) Migration of Chemical Compounds from Packaging Polymers during Microwave, Conventional Heat Treatment, and Storage. Compr Rev Food Sci Food Saf 12:523–545
- S. I . Abou - Elela, S. A. El - Shaf ai , M. E. Fawzy MS (2018) Management of shock loads wastewater produced from water heaters industry. Int J Environ Sci Technol 15:743–754
- Mhd Sarbon N, Badii F, Howell NK (2013) Preparation and characterisation of chicken skin gelatin as an alternative to mammalian gelatin. Food Hydrocoll 30:143–151. https://doi.org/10.1016/J.FOODHYD.2012.05.009
- Badii F HN (2003) Elucidation of the effect of formaldehyde and lipids on frozen stored cod collagen by FT-Raman spectroscopy and differential scanning calorimetry. J Agric Food Chem 26:1440–1446
- Arnesen JA, Gildberg A (2002) Preparation and characterisation of gelatine from the skin of harp seal (Phoca groendlandica). Bioresour Technol 82:191–194. https://doi.org/10.1016/S0960-8524(01)00164-X
- Rosolen IM authorMaryAnn (2013) Thermal transitions of gelatin evaluated using DSC sample pans of various seal integrities. J Therm Anal Calorim 114:1161–1166
- Vandervoort J, Ludwig A (2004) Preparation and evaluation of drug-loaded gelatin nanoparticles for topical ophthalmic use. Eur J Pharm Biopharm 57:251–261. https://doi.org/10.1016/S0939-6411(03)00187-5
- Ibrahim S, Labeeb A, Mabied AF, et al (2017) Synthesis of super-hydrophobic polymer nanocomposites as a smart self-cleaning coating films. Polym Compos 38:E147–E156. https://doi.org/10.1002/pc.24023
- Frank T, Li W, Wu Chen (2008) Albright’s Chemical Engineering Handbook. In: Albright L (ed). CRC Press Taylor & Francis Group, Indiana, USA, pp 1599–1665
- Abecassis J, Cuq B, Escudier J-L, et al (2018) Food chains, the cradle for scientific ideas and the target for technological innovations. Innov Food Sci Emerg Technol 46:7–17. https://doi.org/10.1016/J.IFSET.2017.09.011
- Kim K-C, Park Y-B, Lee M-J, et al (2008) Levels of heavy metals in candy packages and candies likely to be consumed by small children. Food Res Int 41:411–418. https://doi.org/10.1016/J.FOODRES.2008.01.004
Scheme 1 is available in supplementary section
- Scheme1.jpg
Scheme 1. Schematic pathway of the performed analysis for the fabricated films