Clinical characteristics
Data of 278 Patients (detailed clinicopathological characteristics are summarized in table 1) were analyzed in this study (female=101, males=177, median age=62.06 years) Patients with all tumor stages (T1 = 39, T2= 105, T3= 102, T4= 31, unknown=1), nodal and metastasis status (N0= 72 N+=206, M0=197, M1=81) were included. Data on lymphatic infiltration was available in 258 cases, data on venous infiltration in 274 cases. Lymphatic infiltration was observed in 165 patients (59.4%), venous infiltration in 90 patients (32.4%). (95% CI: 104.7 – 124.1). The 5-year overall survival was 29.8%, the 5-year disease-specific survival was 35.4%.
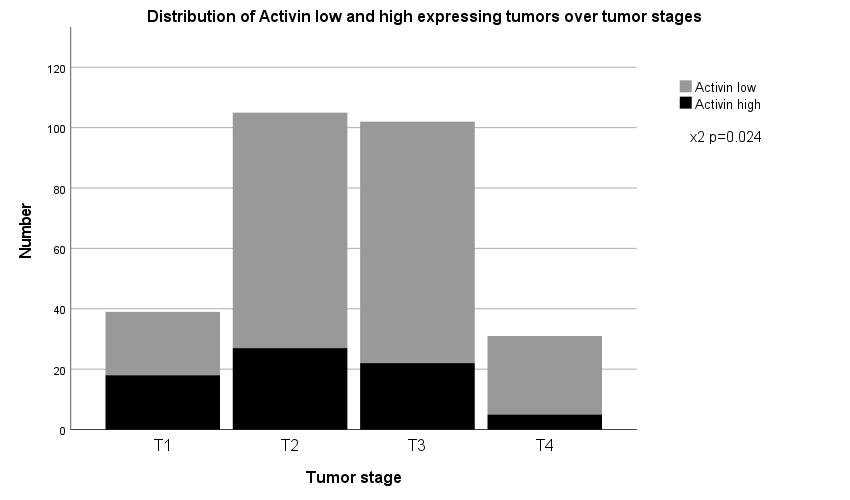
Activin protein expression is common in AEG/ASs and inversely correlated with tumor size, lymph node and distant metastasis
High activin protein expression was observed in 72 out of 278 primary tumors (25.9 %). Activin protein expression scores were negatively correlated with tumor size, lymph node and distant metastasis (p<0.013, p=0.009 and p=0.003 respectively). Accordingly, we observed a statistically significant inverse correlation of activin expression with UICC stages (see table 1).
Activin was not significantly correlated with tumor grading (p=0.10). With regard to the Lauren classification, higher activin expression scores were seen in tumors of the intestinal type when compared to tumors of diffuse or mixed type (p=0.04). Also, higher activin protein expression scores correlated with tumors classified as expansive as opposed to infiltrative tumors following the Ming Classification (p=0.007).
CD4+ T-helper cell tumor invasion correlates with higher activin expression
As immune modulating effects of activin are reported in other tumor entities, we decided to investigate tumor T-cell infiltration as possible confounding factor. We observed high infiltration of T-cells positive for CD3+, CD4+ and CD8+ in 119, 99 and 121 of tumors respectively. (42.8%, 35.6%, 43.5 % of cases). When correlating T-cell infiltration with activin protein expression, we observed no statistically significant correlation of activin expression with CD3+ or CD8+ T-cells, but a statistically significant correlation with CD4+ T-helper-cells (p<0.002). Additionally, we correlated activin with PD-1 and PD-L1 expression in lymphocytes and tumor cells. There was a trend towards higher activin protein expression in tumors with lymphocytes expressing PD-1 and PD-L1 respectively, but this trend did not reach statistical significance (p=0.051 and p=0.065 respectively).
Activin protein expression is positively correlated with longer overall survival, especially in tumors with high CD4+ cell count
Activin protein expression showed a statistically significant correlation with overall survival (see figure 2a) (74 +/- 8.4 versus 51+/-4.5 months, p<0.01). The correlation of activin protein expression and tumor specific survival did not reach statistical significance. When investigating the correlation of activin and overall survival in tumors of different UICC stages, the effect was predominantly found in tumors of UICC stage III (35 +/-9.2 versus 15 +/-2.4 months, p=0.01) (see figure 2b). In a multivariate analysis, only age and UICC stage remained statistical significantly correlated with overall survival (see table 2).
As published before, CD4+ T-cell infiltration is correlated with longer survival in AEG/AS patients (figure 2C, [29]). Interestingly, when investigating the correlation of high activin protein expression and CD4+ T-cells, we observed improved survival solely in patients with tumors expressing both high activin levels and high CD4+ infiltration (median survival 94.6 months +/- 13.0]). Tumors with either exclusively high CD4+ cells or exclusively high activin protein expression did not exhibit a longer survival (median survival 57.4 +/- 11.4 and 55.9 +/- 8.7 months) when compared with tumors low in CD4+ cell infiltration and activin expression (median survival 47.1 +/- 5.7 months) (figure 2d)